. 2015 May;65(5):1064-72.
doi: 10.1161/HYPERTENSIONAHA.115.05255. Epub 2015 Mar 2.

Transcriptional regulation of renal dopamine D1 receptor function during oxidative stress

Affiliations

Transcriptional regulation of renal dopamine D1 receptor function during oxidative stress

Anees A Banday et al. Hypertension. 2015 May.

Abstract

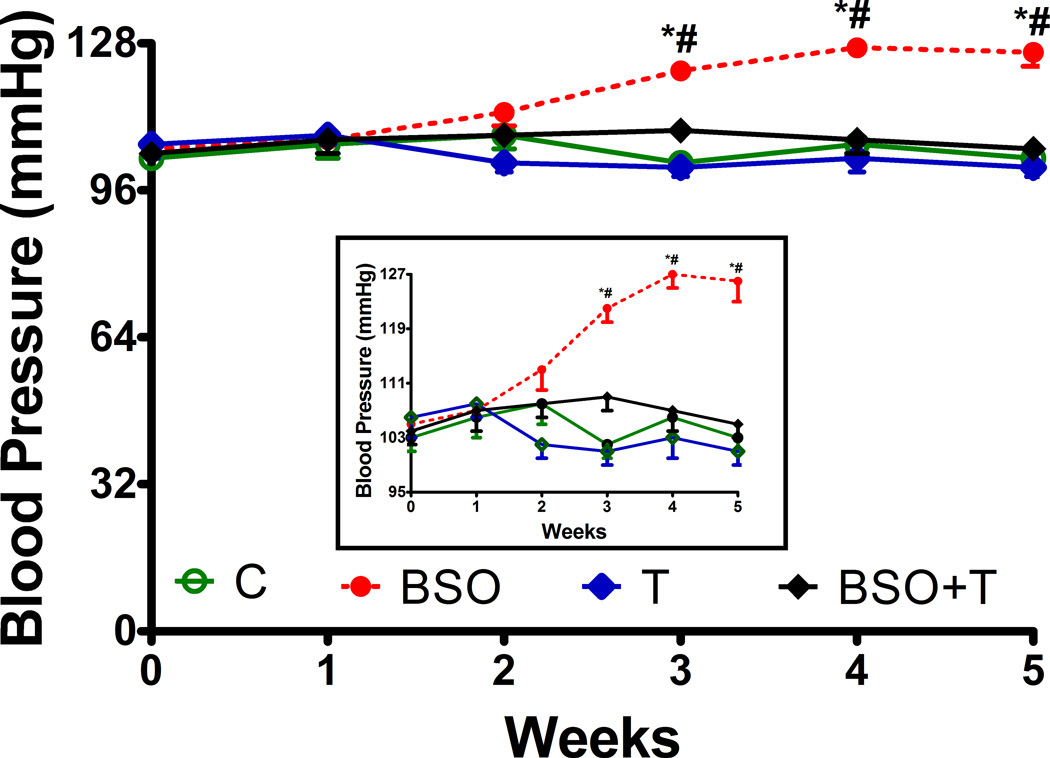
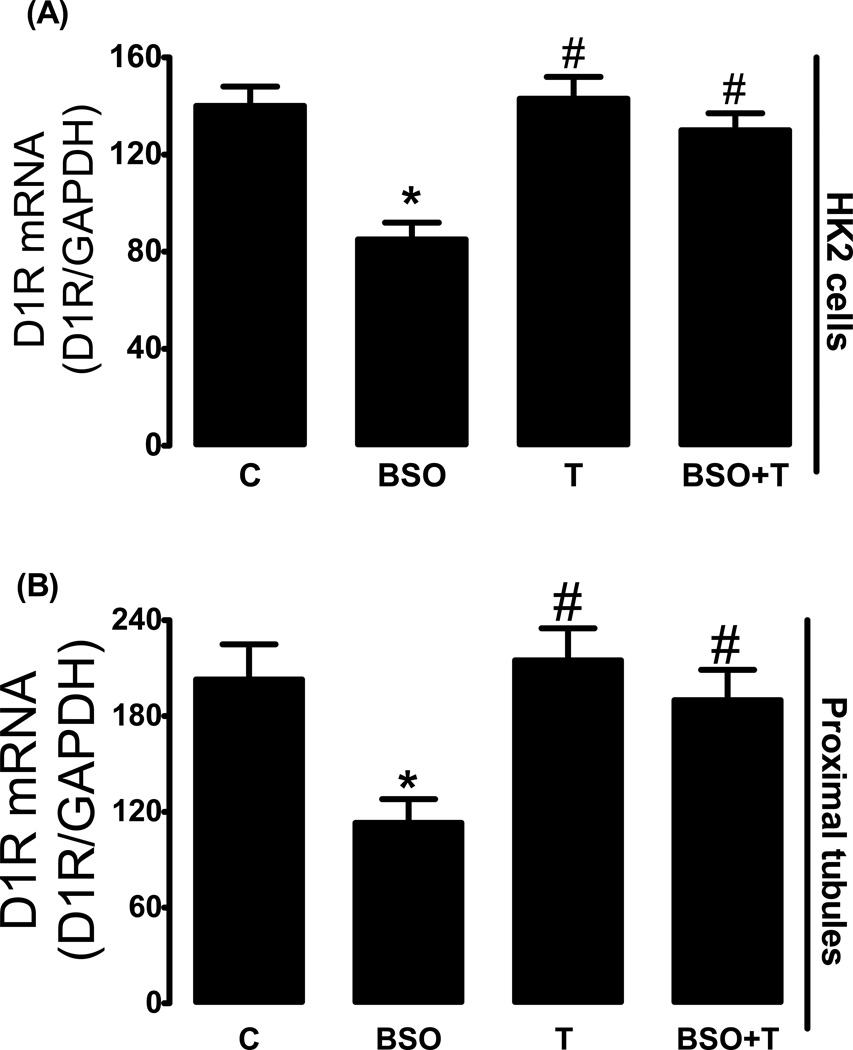
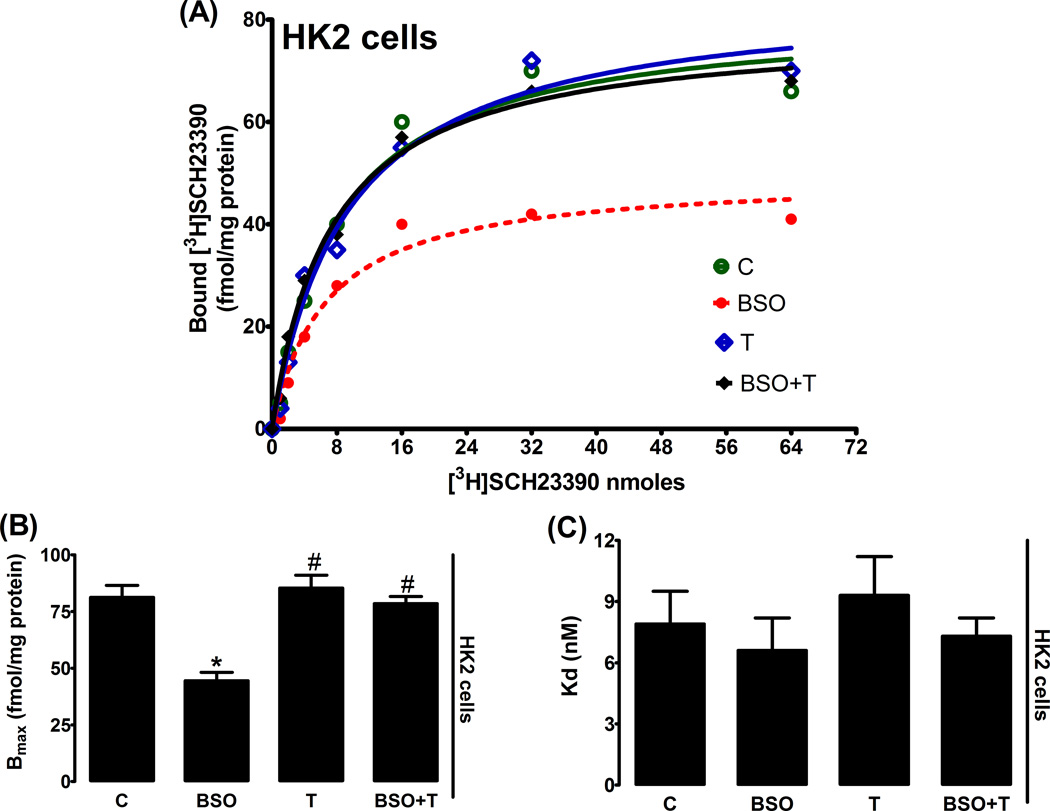
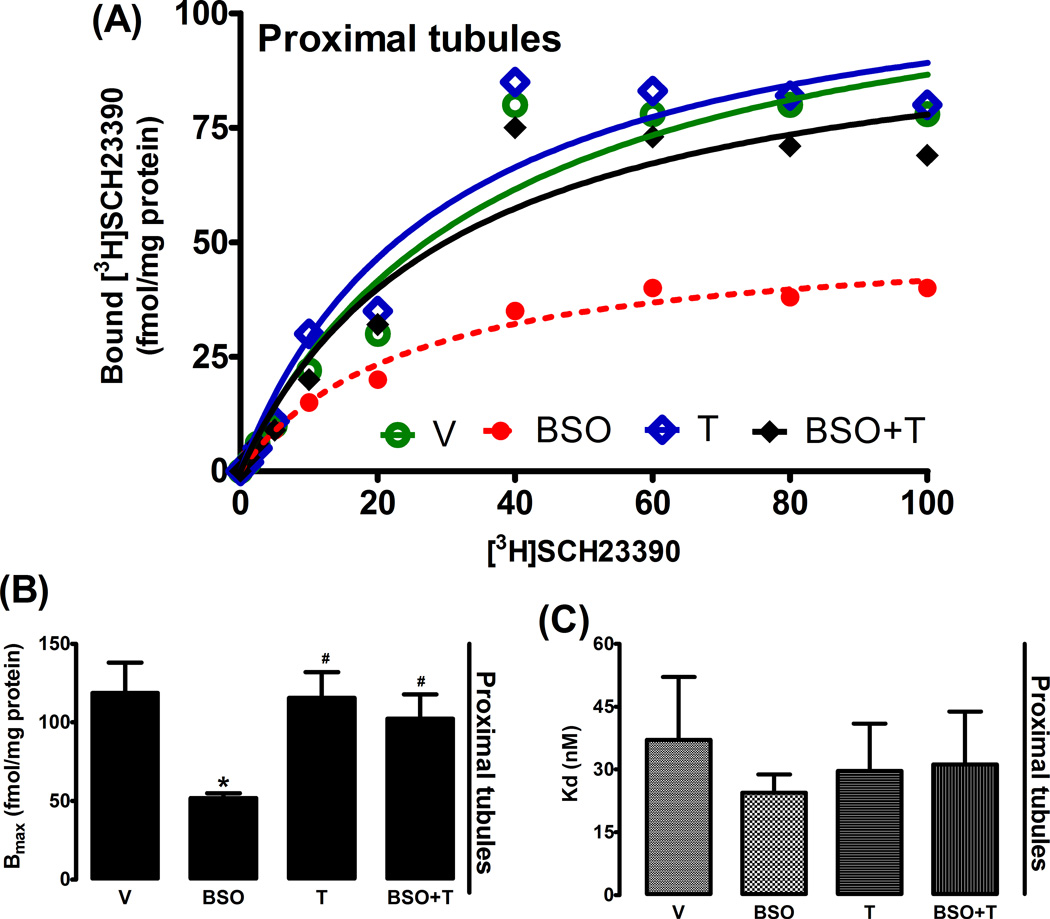
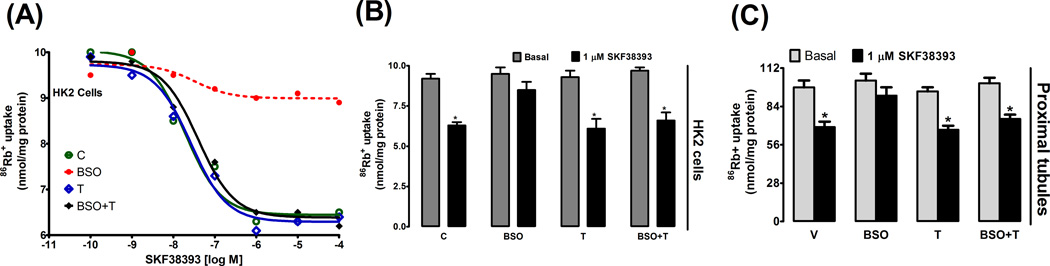
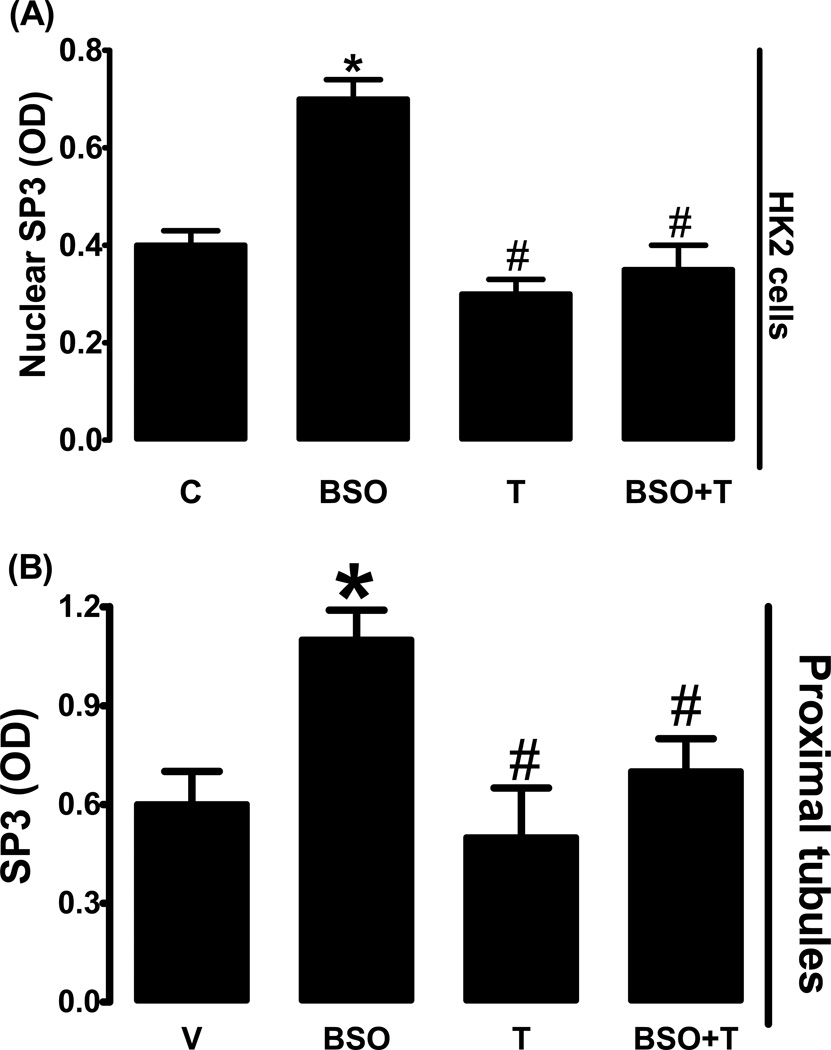
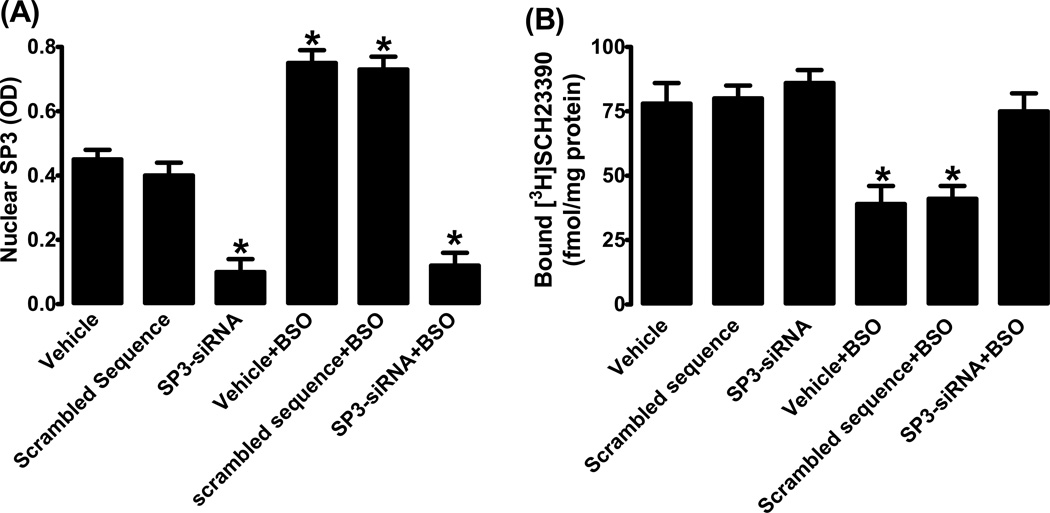
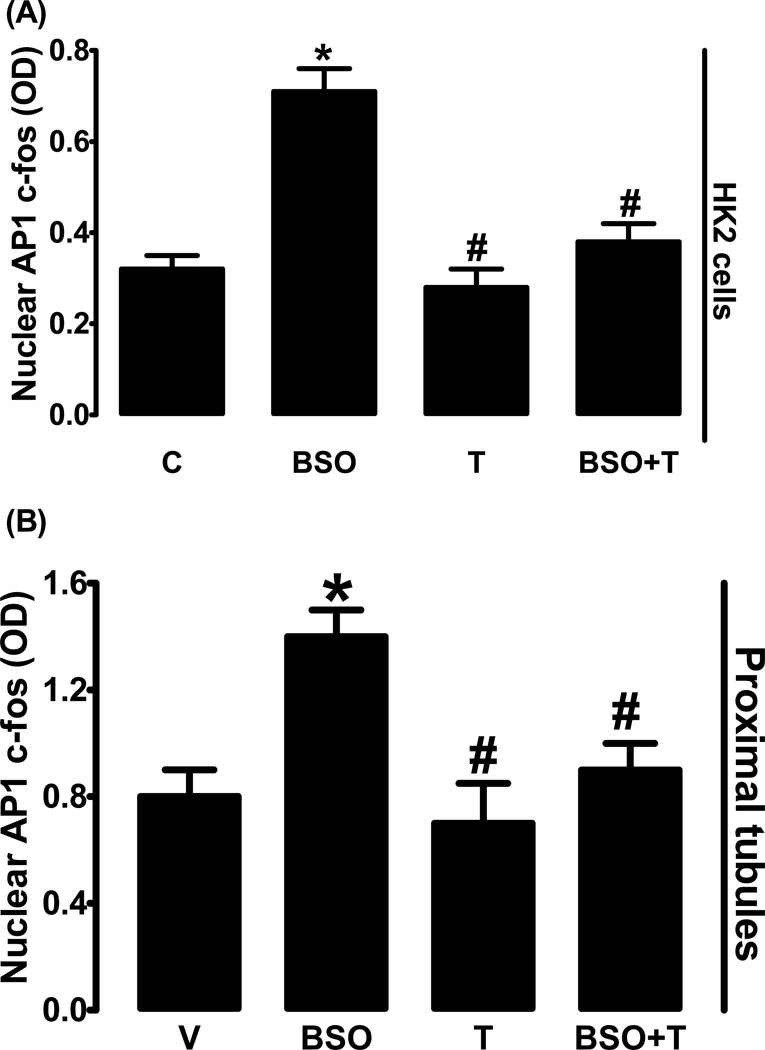
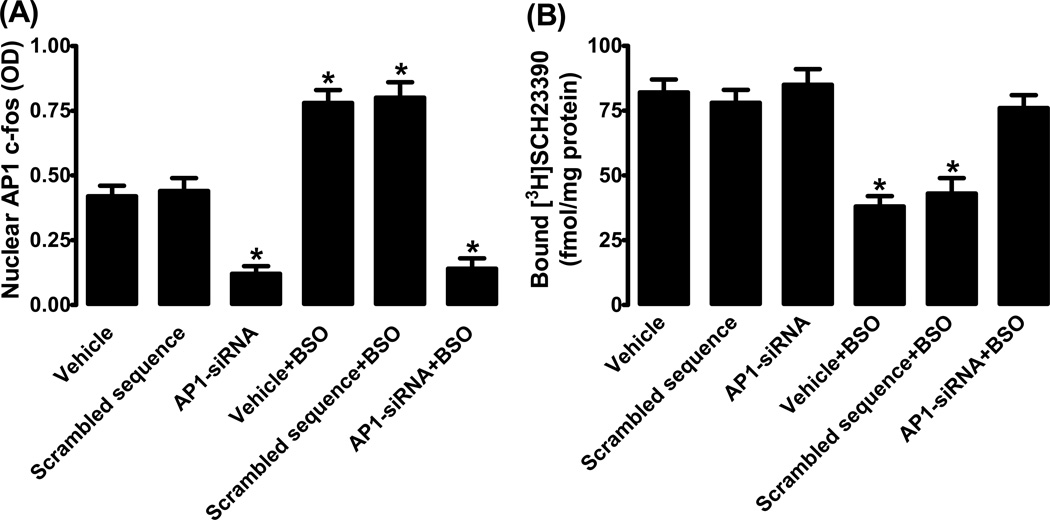
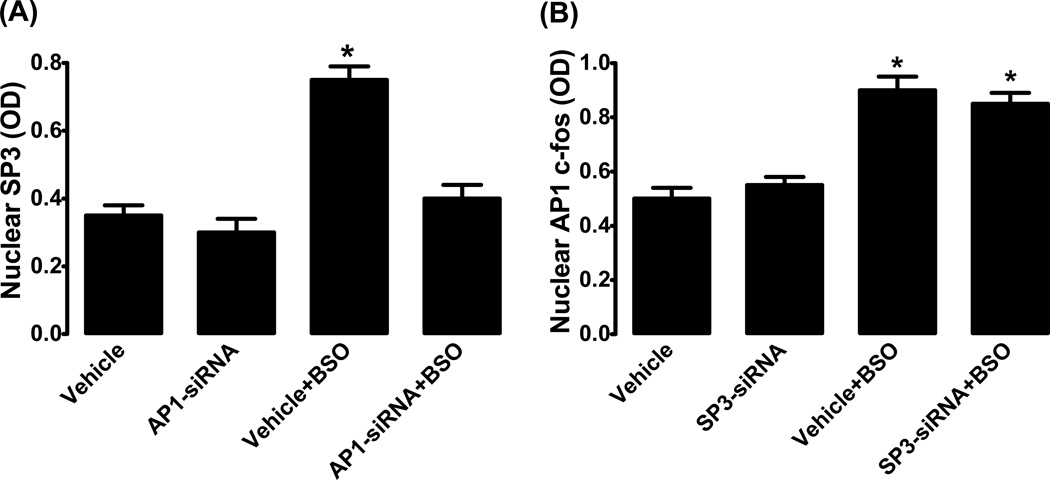
There exists a strong link between oxidative stress, renal dopaminergic system, and hypertension. It is reported that reactive oxygen species attenuate renal proximal tubular dopamine receptor (D1R) function, which disrupts sodium regulation and leads to hypertension. However, the mechanisms for renal D1R dysfunction are not clear. We investigated the role of redox-sensitive transcription factors AP1 and SP3 in transcriptional suppression of D1R gene and subsequent D1R signaling. Human kidney proximal tubular cells were treated with a pro-oxidant l-buthionine sulfoximine (BSO) with and without an antioxidant tempol. In human kidney cells, BSO caused oxidative stress and reduced D1R mRNA and membrane receptor expression. Incubation of human kidney cells with SKF38393, a D1R agonist, caused a concentration-dependent inhibition of Na/K-ATPase. However, SKF38393 failed to inhibit Na/K-ATPase in BSO-treated cells. BSO increased AP1 and SP3 nuclear expression. Transfection with AP1- or SP3-specific siRNA abolished BSO-induced D1R downregulation. Treatment of rats with BSO for 4 weeks increased oxidative stress and SP3-AP1 expression and reduced D1R numbers in renal proximal tubules. These rats exhibited high blood pressure, and SKF38393 failed to inhibit proximal tubular Na/K-ATPase activity. Control rats were kept on tap water. Tempol per se had no effect on D1R expression or other signaling molecules but prevented BSO-induced oxidative stress, SP3-AP1 upregulation, and D1R dysfunction in both human kidney cells and rats. These data show that oxidative stress via AP1-SP3 activation suppresses D1R transcription and function. Tempol mitigates oxidative stress, blocks AP1-SP3 activation, and prevents D1R dysfunction and hypertension.

Keywords: GTP-binding proteins; antioxidants; hypertension; kidney; kidney tubules, proximal.


Conflict of interest statement

Conflict(s) of Interest/Disclosure(s)

None

Figures

Figure 1
Figure 1
Effect of L-buthionine-sulfoximine (BSO) and tempol (T) on blood pressure in rats. The insert magnifies the increase in blood pressure in BSO-treated rats. Data represents Mean ± SE from 8–10 rats in each group. *P<0.05 vs baseline (at the beginning of the treatment) and #P<0.05 vs. control at corresponding time point.
Figure 2
Figure 2
Dopamine D1 receptor (D1R) mRNA level in HK2 cells and rat renal proximal tubules. (A) D1R mRNA levels in control (C, DMEM-F12), L-buthionine sulfoximine (BSO), tempol (T) and BSO + tempol treated HK2 cells. (B) Renal proximal tubular D1R mRNA levels in control (C, tape water), BSO, T and BSO + tempol treated SD rats. Experiments were performed in triplicate and data represents Mean ± SE from 4–6 cell passages (cells from passage 2–8) or 5–7 rats in each group. *P<0.05 vs C and #P<0.05 vs BSO.
Figure 3
Figure 3
Membrane dopamine D1 receptor (D1R) expression in HK2 cells. A representative dose response curve of D1R antagonist [3H]SCH23390 in HK2 membranes (A). Bmax and Kd obtained from Scatchard plot (B and C). Experiments were performed in triplicate and data represents Mean ± SE from 4–6 cell passages (cells from passage 2–8). *P<0.05 vs C and #P<0.05 vs BSO.
Figure 4
Figure 4
Membrane dopamine D1 receptor (D1R) expression in rat renal proximal tubules. A representative dose response curve of D1R antagonist [3H]SCH23390 in proximal tubule membranes (A). Bmax and Kd obtained from Scatchard plot (B and C). Experiments were performed in triplicate and data represents Mean ± SE from 5–7 rats in each group. *P<0.05 vs C and #P<0.05 vs BSO.
Figure 5
Figure 5
SKF38393-induced inhibition of Na/K-ATPase activity in HK2 cells and rat renal proximal tubules. A representative dose response curve of SKF38393-induced inhibition of Na/K-ATPase activity in control (C), L-buthionine sulfoximine (BSO), tempol (T) and BSO + tempol treated HK2 cells (A). SKF3893-induced (1 µmol/L) inhibition of Na/K-ATPase activity in HK2 cells (B) and renal proximal tubules (C). Experiments were performed in triplicate and data represents Mean ± SE from 4–6 cell passages (cells from passage 2–8) or 5–7 rats in each group. *P<0.05 vs. basal.
Figure 6
Figure 6
SP3 nuclear expression in HK2 cells and rat renal proximal tubules. Effect of BSO on SP3 nuclear expression in L-buthionine sulfoximine (BSO), tempol (T) and BSO + tempol treated HK2 cells (A) and renal proximal tubules from BSO and/or tempol treated rats (B). Experiments were performed in triplicate and data represents Mean ± SE from 4–6 cell passages (cells from passage 2–8) or 5–7 rats in each group. *P<0.05 vs C and #P<0.05 vs BSO.
Figure 7
Figure 7
SP3 and D1 receptor interaction. (A) SP3 nuclear expression in HK2 cells transfected with SP3 specific siRNA or scrambled DNA. (B) D1 receptor ligand [3H]SCH23390 binding. Mean ± SE from 4–6 experiments (cells from passage 2–8) performed in triplicate. *P<0.05 vs. vehicle.
Figure 8
Figure 8
AP1 (c-fos) nuclear expression in HK2 cells and rat renal proximal tubules. Effect of BSO on AP1 nuclear expression in L-buthionine sulfoximine (BSO), tempol (T) and BSO + tempol treated HK2 cells (A) and renal proximal tubules from BSO and/or tempol treated rats (B). Experiments were performed in triplicate and data represents Mean ± SE from 4–6 cell passages (cells from passage 2–8) or 5–7 rats in each group. *P<0.05 vs C and #P<0.05 vs BSO.
Figure 9
Figure 9
AP1 (c-fos) and D1 receptor interaction. (A) AP1 nuclear expression in HK2 cells transfected with SP3 specific siRNA or scrambled DNA. (B) D1 receptor ligand [3H]SCH23390 binding. Mean ± SE from 4–6 experiments (cells from passage 2–8) performed in triplicate. *P<0.05 vs. vehicle.
Figure 10
Figure 10
AP1 (c-fos) and SP3 interaction. (A) Nuclear expression of SP3 in the absence and presence of AP1 siRNA in HK2 cells treated with L-buthionine sulfoximine (BSO). (B) Nuclear expression of AP1 (c-fos) in the absence and presence of SP3 siRNA in BSO treated HK2 cells. Mean ± SE from 4–6 experiments (cells from passage 2–8) performed in triplicate. *P<0.05 vs. vehicle.

Comment in

References

    1. Guyton AC. Dominant role of the kidneys and accessory role of whole-body autoregulation in the pathogenesis of hypertension. American journal of hypertension. 1989;2:575–585. - PubMed
    1. Guyton AC. The surprising kidney-fluid mechanism for pressure control--its infinite gain! Hypertension. 1990;16:725–730. - PubMed
    1. Guyton AC. Blood pressure control--special role of the kidneys and body fluids. Science (New York, N.Y.) 1991;252:1813–1816. - PubMed
    1. Guyton AC. Kidneys and fluids in pressure regulation. Small volume but large pressure changes. Hypertension. 1992;19:I2–I8. - PubMed
    1. Hall JE, Guyton AC, Brands MW. Pressure-volume regulation in hypertension. Kidney international. Supplement. 1996;55:S35–S41. - PubMed

Publication types

MeSH terms