. 2015 May;35(9):1648-58.
doi: 10.1128/MCB.00134-15. Epub 2015 Mar 2.

Interaction with OGG1 is required for efficient recruitment of XRCC1 to base excision repair and maintenance of genetic stability after exposure to oxidative stress

Affiliations

Interaction with OGG1 is required for efficient recruitment of XRCC1 to base excision repair and maintenance of genetic stability after exposure to oxidative stress

Anna Campalans et al. Mol Cell Biol. 2015 May.

Abstract

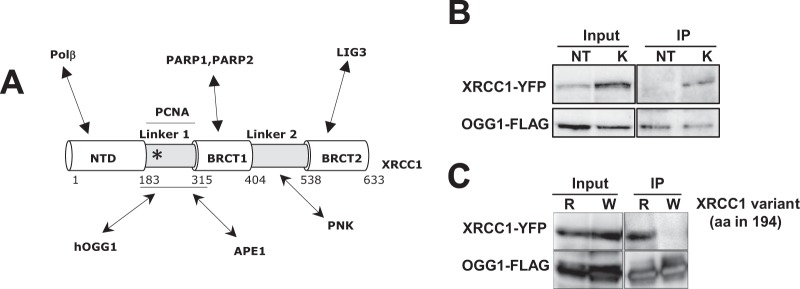
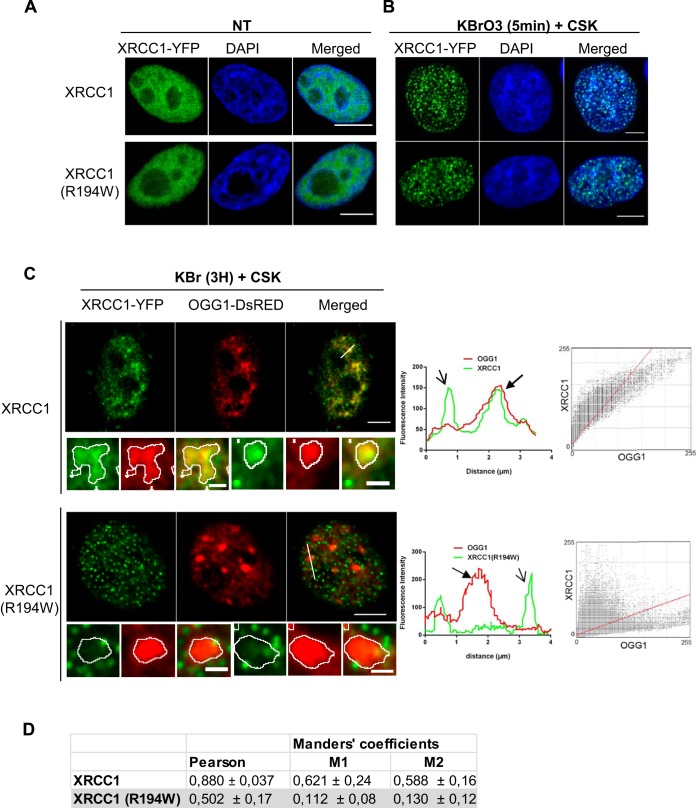
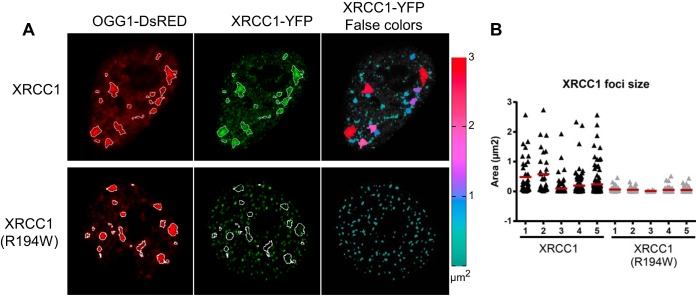
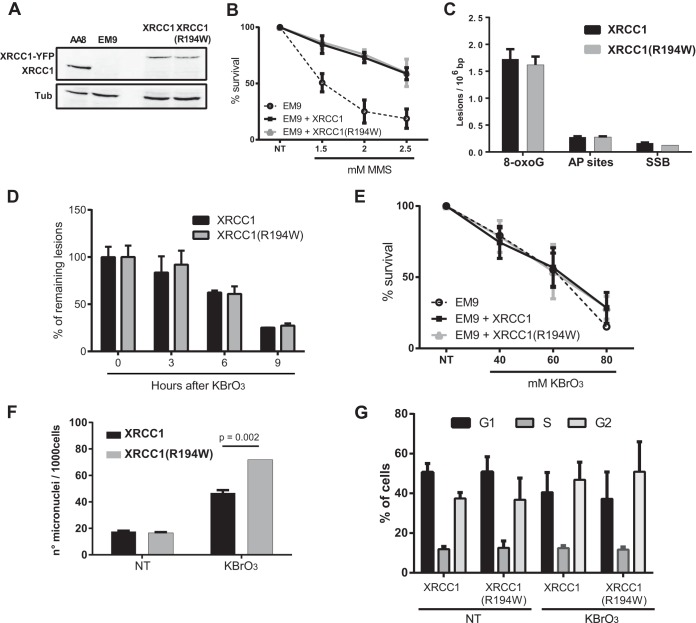
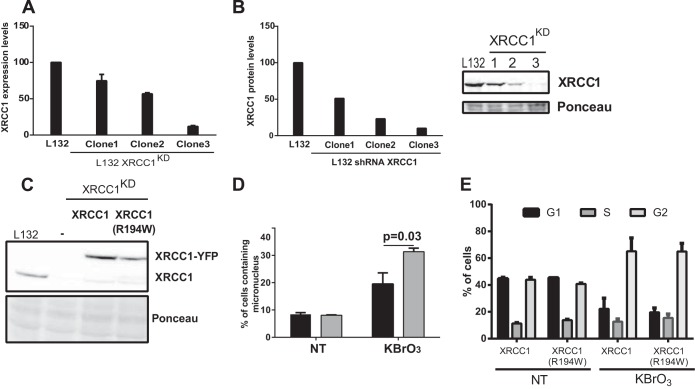
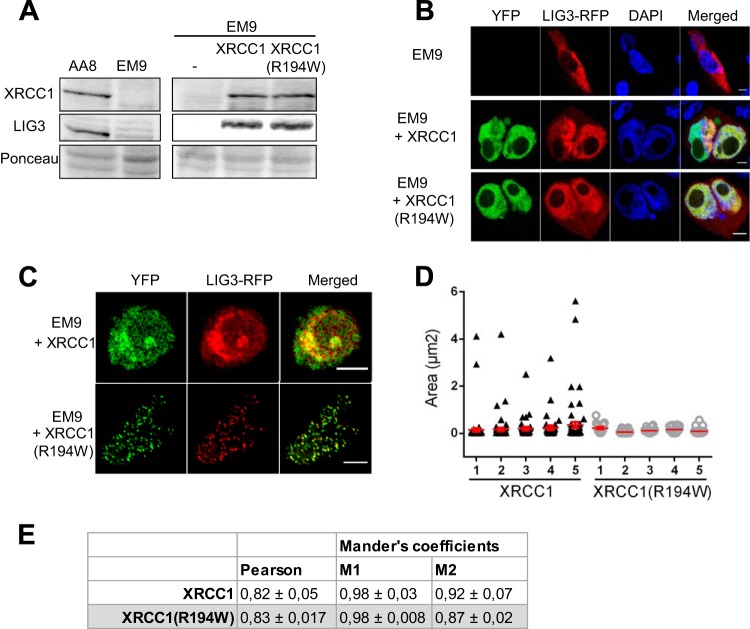
XRCC1 is an essential protein required for the maintenance of genomic stability through its implication in DNA repair. The main function of XRCC1 is associated with its role in the single-strand break (SSB) and base excision repair (BER) pathways that share several enzymatic steps. We show here that the polymorphic XRCC1 variant R194W presents a defect in its interaction with the DNA glycosylase OGG1 after oxidative stress. While proficient for single-strand break repair (SSBR), this variant does not colocalize with OGG1, reflecting a defect in its involvement in BER. Consistent with a role of XRCC1 in the coordination of the BER pathway, induction of oxidative base damage in XRCC1-deficient cells complemented with the R194W variant results in increased genetic instability as revealed by the accumulation of micronuclei. These data identify a specific molecular role for the XRCC1-OGG1 interaction in BER and provide a model for the effects of the R194W variant identified in molecular cancer epidemiology studies.


Figures

FIG 1
FIG 1
Interaction between OGG1 and XRCC1 is impaired in XRCC1(R194W). (A) Schematic representation of the different domains of XRCC1, the highly structured N-terminal domain (NTD) and BRCT1 and BRCT2 domains, separated by the two linkers. The domains involved in the interaction with different protein partners are indicated. The position of the R194W substitution is indicated by an asterisk. hOGG1, human OGG1; PNK, polynucleotide kinase. (B) HeLa cells cotransfected with plasmids expressing XRCC1-YFP and OGG1-FLAG were treated with KBrO3 (K) or not treated with KBrO3 (NT). Three hours after the treatment, protein extracts were used for immunoprecipitation with the anti-FLAG antibody. Immunoprecipitated (IP) proteins were analyzed by Western blotting with anti-FLAG and anti-GFP antibodies. The left blots show the levels of the proteins in the extract (10% of the input). (C) HeLa cells cotransfected with plasmids expressing XRCC1-YFP (R) or the variant XRCC1(R194W)-YFP (W) and OGG1-FLAG were treated and processed as described above for panel B. aa in 194, amino acid at position 194.
FIG 2
FIG 2
Colocalization between OGG1 and XRCC1 is impaired in the variant XRCC1(R194W). (A) HeLa cells were transfected with plasmids carrying genes coding for XRCC1 or the variant XRCC1(R194W) fused to the YFP (green). Twenty-four hours after transfection, cells were fixed, and DNA was stained with DAPI (blue). The cells were not treated with KBrO3 (NT). Bars, 5 μm. (B) HeLa cells expressing XRCC1-YFP were treated with KBrO3 for 30 min and allowed to recover in DMEM for 5 min. The cells were extracted with CSK buffer prior to fixation in order to remove soluble proteins. DNA was stained with DAPI (blue). Bars, 5 μm. (C) HeLa cells cotransfected with plasmids expressing OGG1-DsRED and the XRCC1-YFP or XRCC1(R194W)-YFP variant and were treated with KBrO3. Three hours after treatment, soluble proteins were extracted with CSK buffer prior to fixation. Bars, 5 μm and 2 μm (insets). The positions of the line scans used for the plot profiles are indicated in the merged images. Correlations between green and red fluorescence signals are presented in two-dimensional (2D) cytofluorograms. (D) Pearson's and Manders' correlation coefficients between XRCC1 (green) and OGG1 (red) signals were calculated as indicators of colocalization and presented as the means ± standard errors of the means (SEMs) for 10 cells.
FIG 3
FIG 3
Characterization of foci for the XRCC1 and XRCC1(R194W) variants. (A) HeLa cells were cotransfected with XRCC1-YFP (green) variants and OGG1-DsRED (red) and treated with KBrO3. Three hours after treatment, the cells were washed with CSK buffer to remove soluble proteins, fixed, and observed by using a confocal microscope. The OGG1 patches are outlined with a white line in both the OGG1 and XRCC1 images. Only the major variant of XRCC1 was detected in those regions. False colors were applied to the XRCC1-YFP image according to the size of the XRCC1 particles using the ice LUT (lookup table) ramp depicted at the right of the images. (B) Sizes of XRCC1 foci in 5 cells for each XRCC1 variant.
FIG 4
FIG 4
Cellular responses of EM9 cells complemented with either XRCC1 or the XRCC1(R194W) variant. (A) Protein extracts of AA8 (wild-type) cells and EM9 cells (XRCC1 deficient) complemented with YFP alone or with either of the two XRCC1 variants fused to the YFP were analyzed by Western blotting using anti-XRCC1 and antitubulin antibodies. (B) Cell survival after exposure to increasing concentrations of MMS. (C) Levels of induced 8-oxoG/Fpg-sensitive sites, AP sites, and SSBs measured by alkaline elution just after the KBrO3 treatment (0-h time point). Values are means plus SEMs (error bars) from three independent experiments. (D) Cell survival after exposure to increasing concentrations of KBrO3. (E) Fpg-sensitive sites were measured by alkaline elution at different times after KBrO3 treatment. The percentage of induced lesions remaining is shown on the y axis. Values are means ± SEMs from three independent experiments. (F) Micronuclei were counted 24 h after treatment with KBrO3. Values are means plus SEMs from three independent experiments, and 1,000 cells were counted in each experiment. (G) Cell cycle was evaluated in nontreated cells and 24 h after KBrO3 treatment for both complemented cells. The percentages of cells in G1, S, and G2 in a representative experiment are indicated.
FIG 5
FIG 5
Cellular responses of L132 cells complemented with either XRCC1 or the XRCC1(R194W) variant after exposure to oxidative stress. (A) L132 cells were transfected with a plasmid expressing a shRNA against XRCC1, and different clones were selected. Levels of XRCC1 mRNA were measured by qRT-PCR. (B) XRCC1 protein levels in different clones (clones 1 to 3) of L132 cells expressing an shRNA against XRCC1. (C) Western blots showing expression levels of endogenous XRCC1 and exogenous XRCC1-YFP in L132 cells. Clone 3 was selected for the following experiments. (D) Micronuclei were counted 24 h after treatment with KBrO3. Data are represented as mean plus SEM from three independent experiments, and 1,000 cells were counted. (E) Cell cycle was evaluated in nontreated (NT) cells and 24 h after KBrO3 treatment for both complemented cells. The percentages of cells in G1, S, and G2 in a representative experiment are indicated.
FIG 6
FIG 6
Recruitment of LIG3 to BER is impaired in cells expressing the XRCC1 (R194W) variant. (A) Protein extracts were prepared from XRCC1-deficient CHO (EM9) and parental (AA8) cell lines, as well as from the EM9 cells complemented with the different XRCC1-YFP variants. Protein levels for XRCC1 and LIG3 were determined by Western blotting. (B) LIG3-RFP (red) was transfected in EM9 cells or in cells complemented with XRCC1-YFP or XRCC1(R194W)-YFP (green). The cells were fixed 24 h after transfection, and DNA was stained with DAPI (blue). The cells were analyzed by confocal microscopy. (C) EM9 cells were cotransfected with XRCC1-YFP (green) variants and LIG3-RFP (red). The cells were treated with KBrO3, and 3 h after treatment, soluble proteins were removed, and the cells were fixed and observed with a confocal microscope. (D) Sizes of detergent-resistant LIG3 foci. The sizes of foci in five representative cells for each genotype are displayed. (E) Pearson's and Manders' M1 and M2 correlation coefficients between XRCC1 (green) and LIG3 (red) signals were calculated as indicators of colocalization. Results are presented as means ± SEMs for at least 10 cells. Bars, 5 μm.

References

    1. Cadet J, Delatour T, Douki T, Gasparutto D, Pouget JP, Ravanat JL, Sauvaigo S. 1999. Hydroxyl radicals and DNA base damage. Mutat Res 424:9–21. doi:10.1016/S0027-5107(99)00004-4. - DOI - PubMed
    1. Radicella JP, Dherin C, Desmaze C, Fox MS, Boiteux S. 1997. Cloning and characterization of hOGG1, a human homolog of the OGG1 gene of Saccharomyces cerevisiae. Proc Natl Acad Sci U S A 94:8010–8015. doi:10.1073/pnas.94.15.8010. - DOI - PMC - PubMed
    1. Barnes DE, Lindahl T. 2004. Repair and genetic consequences of endogenous DNA base damage in mammalian cells. Annu Rev Genet 38:445–476. doi:10.1146/annurev.genet.38.072902.092448. - DOI - PubMed
    1. Tebbs RS, Flannery ML, Meneses JJ, Hartmann A, Tucker JD, Thompson LH, Cleaver JE, Pedersen RA. 1999. Requirement for the Xrcc1 DNA base excision repair gene during early mouse development. Dev Biol 208:513–529. doi:10.1006/dbio.1999.9232. - DOI - PubMed
    1. Caldecott KW. 2003. XRCC1 and DNA strand break repair. DNA Repair (Amst) 2:955–969. doi:10.1016/S1568-7864(03)00118-6. - DOI - PubMed

Publication types

Substances