. 2015 May;13(5):944-53.
doi: 10.1158/1541-7786.MCR-14-0412. Epub 2015 Mar 2.

Aberrant LPL Expression, Driven by STAT3, Mediates Free Fatty Acid Metabolism in CLL Cells

Affiliations

Aberrant LPL Expression, Driven by STAT3, Mediates Free Fatty Acid Metabolism in CLL Cells

Uri Rozovski et al. Mol Cancer Res. 2015 May.

Abstract

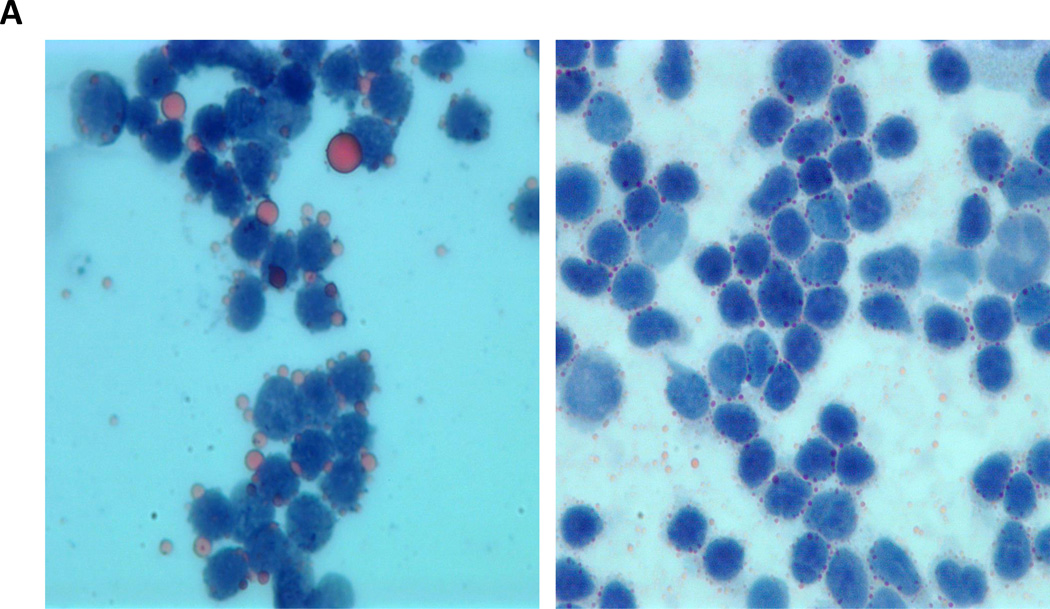
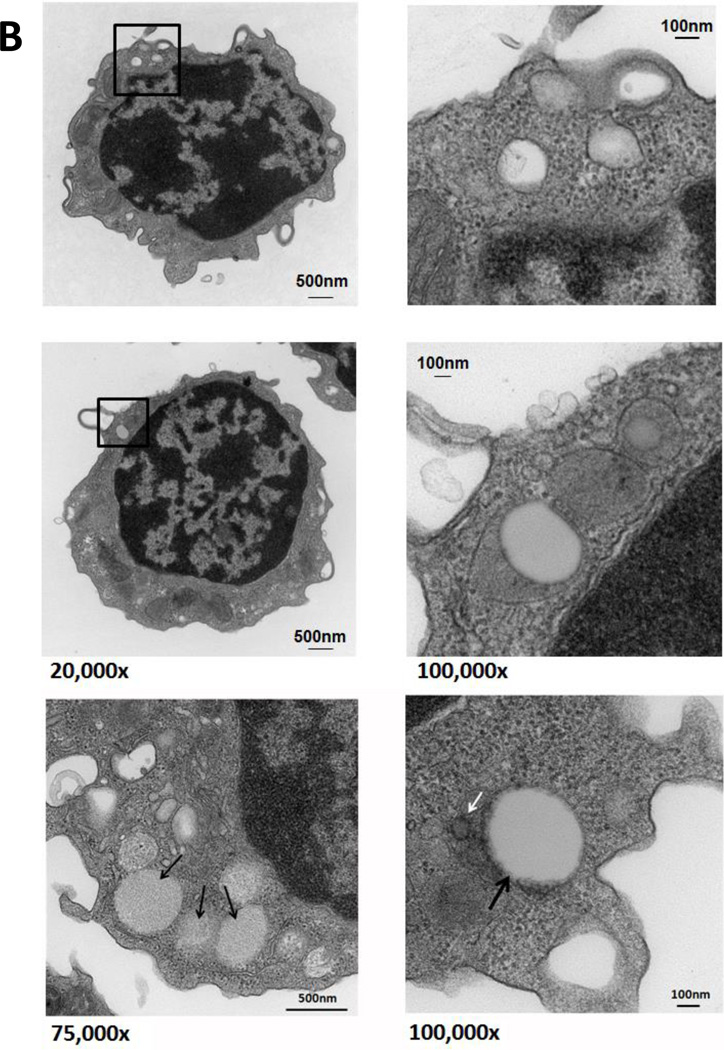
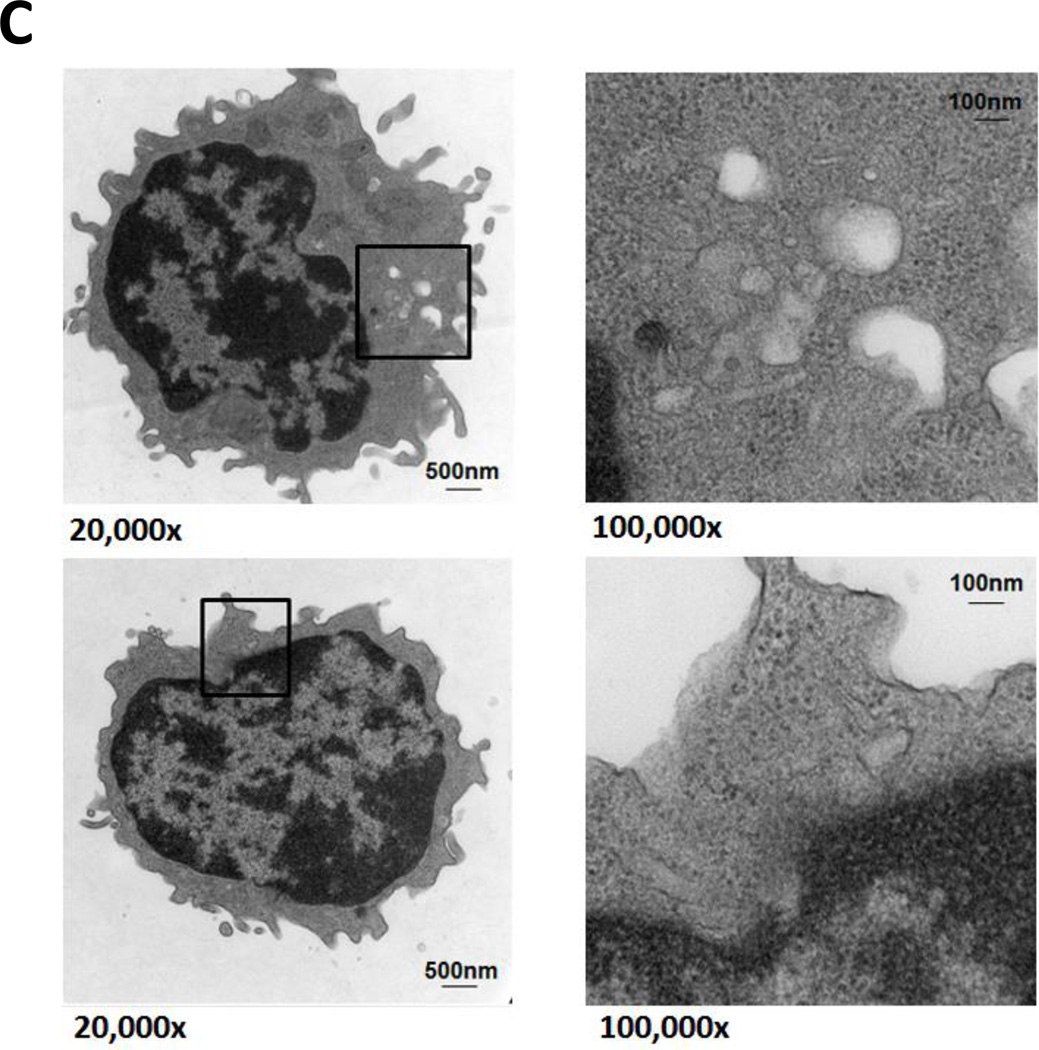
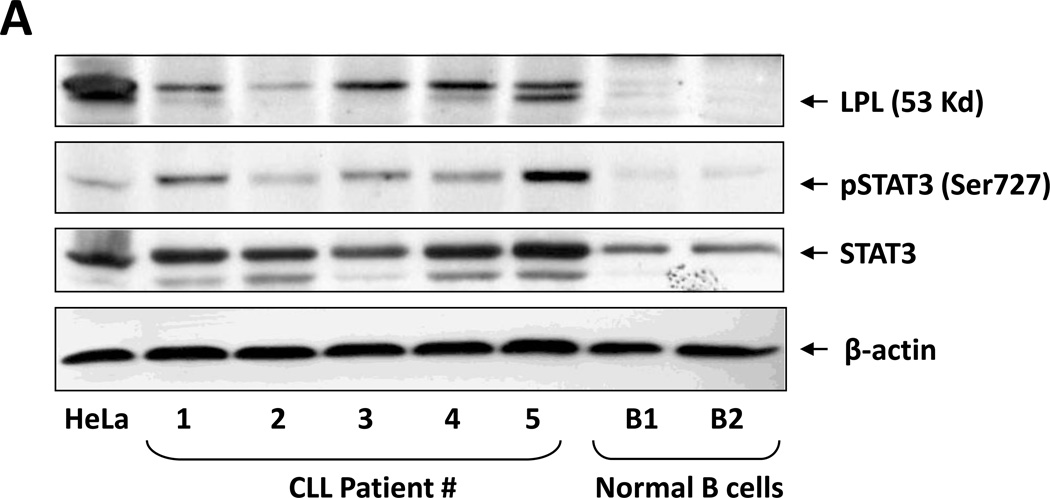
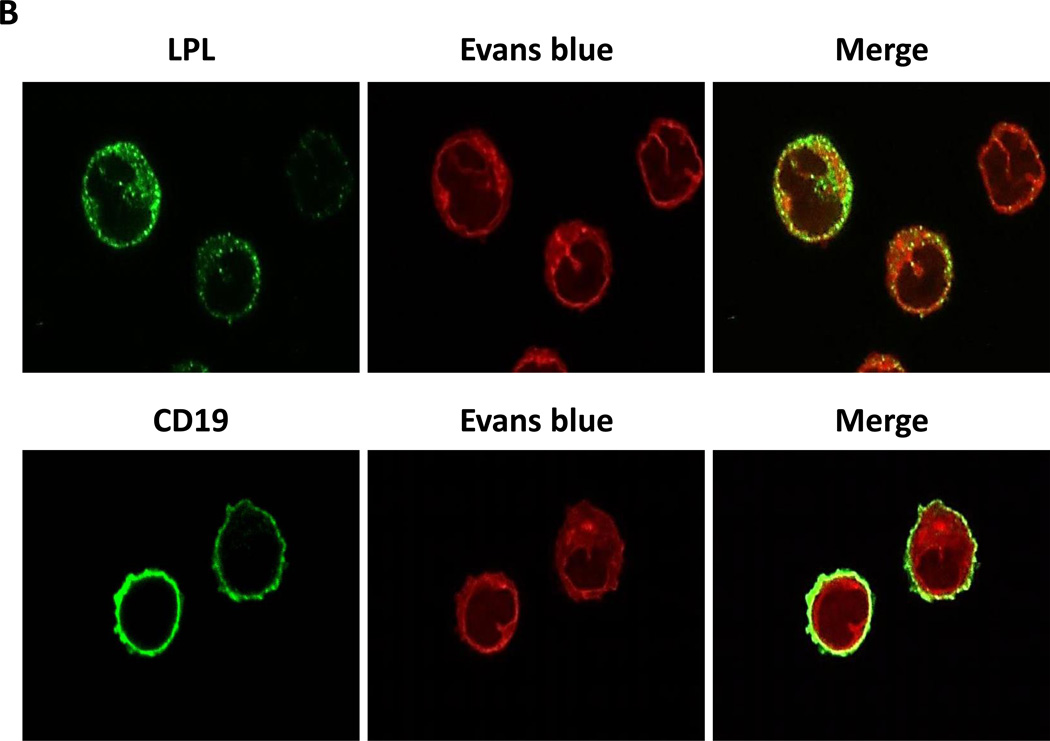
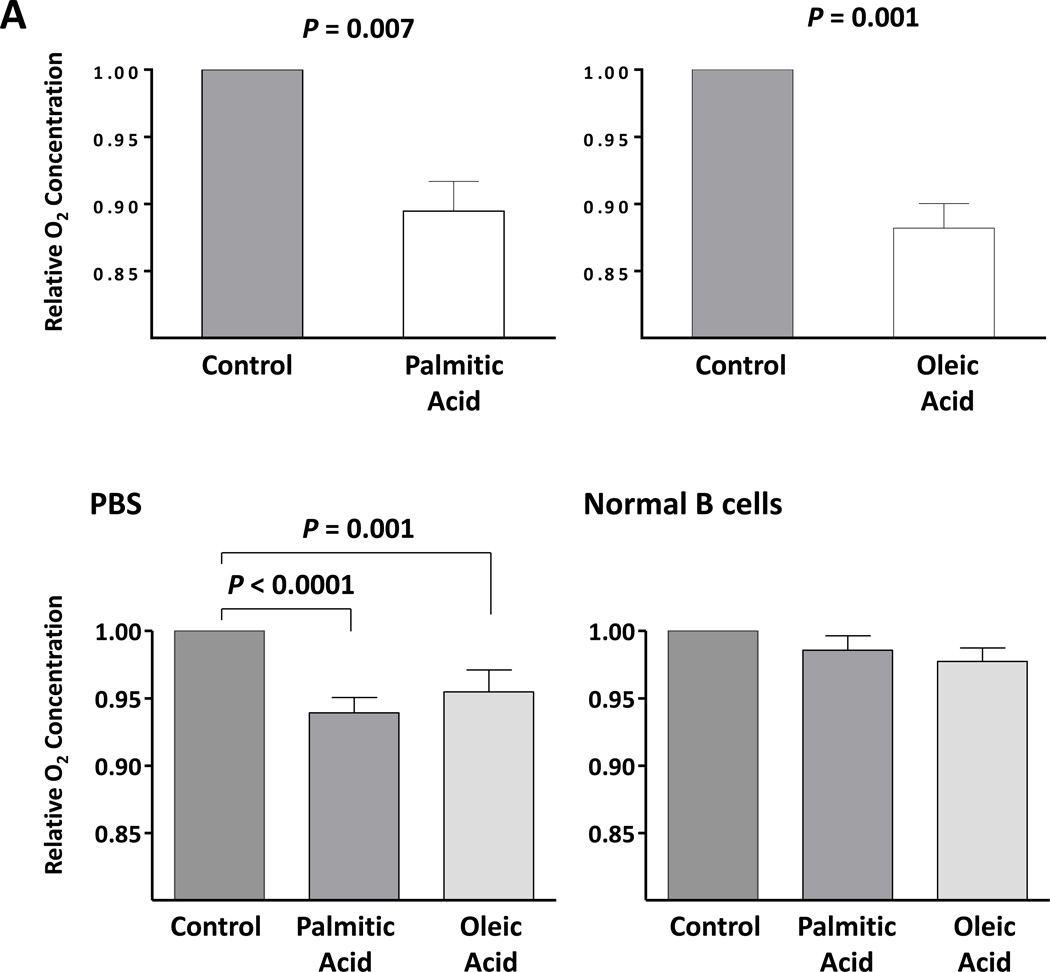
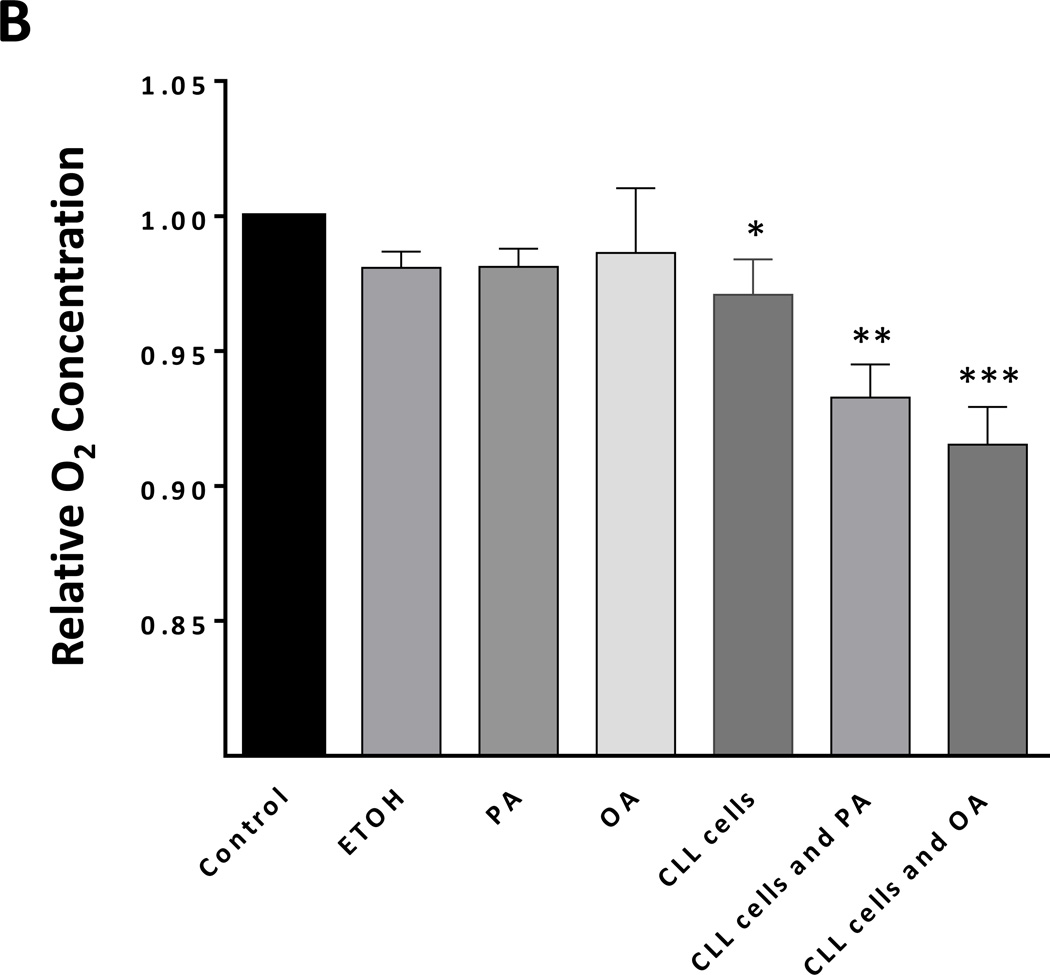
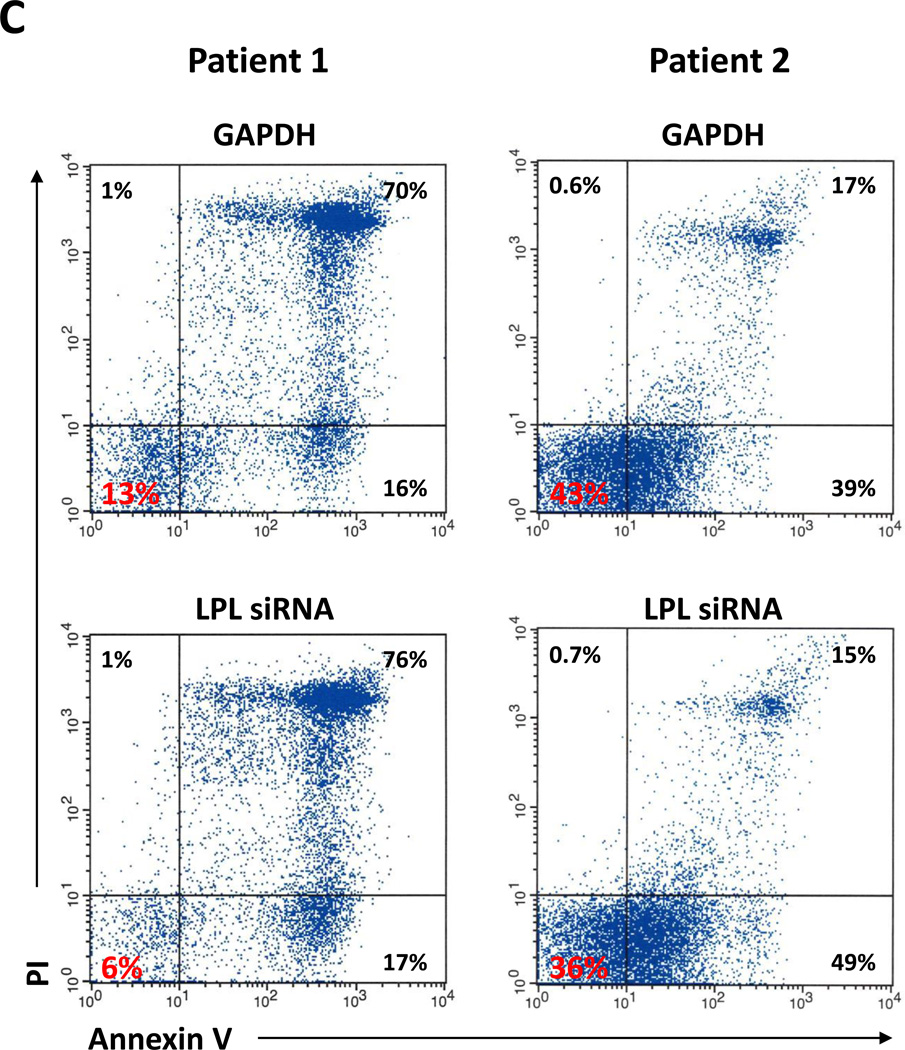
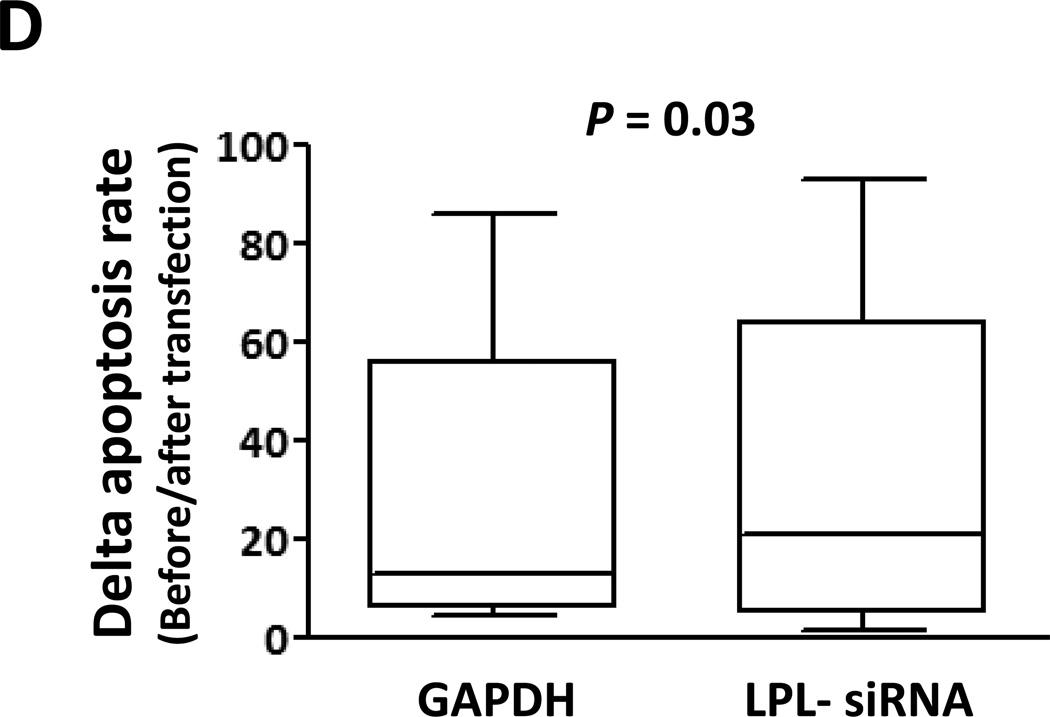
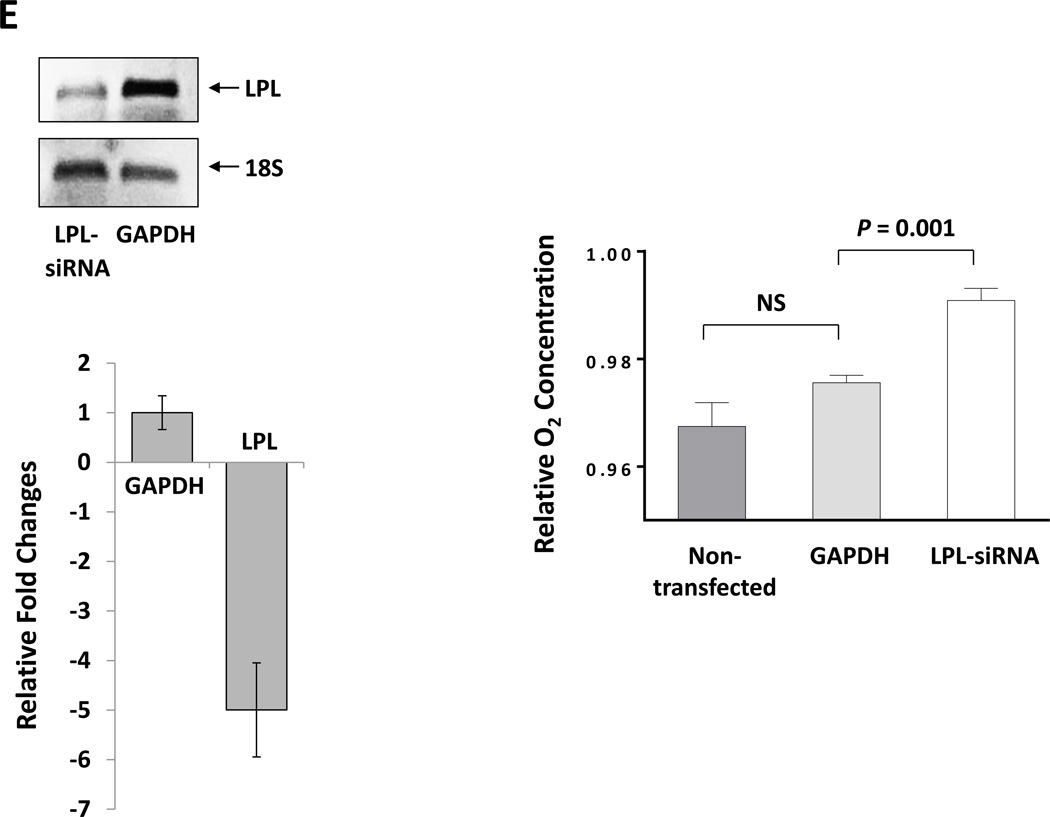
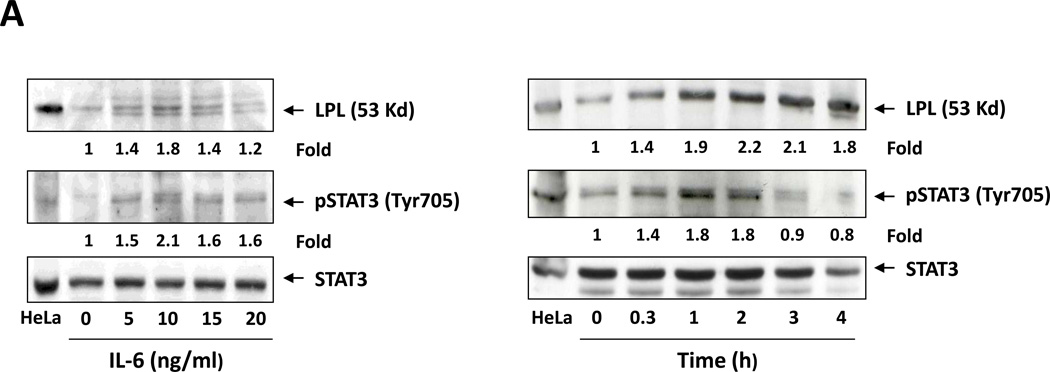
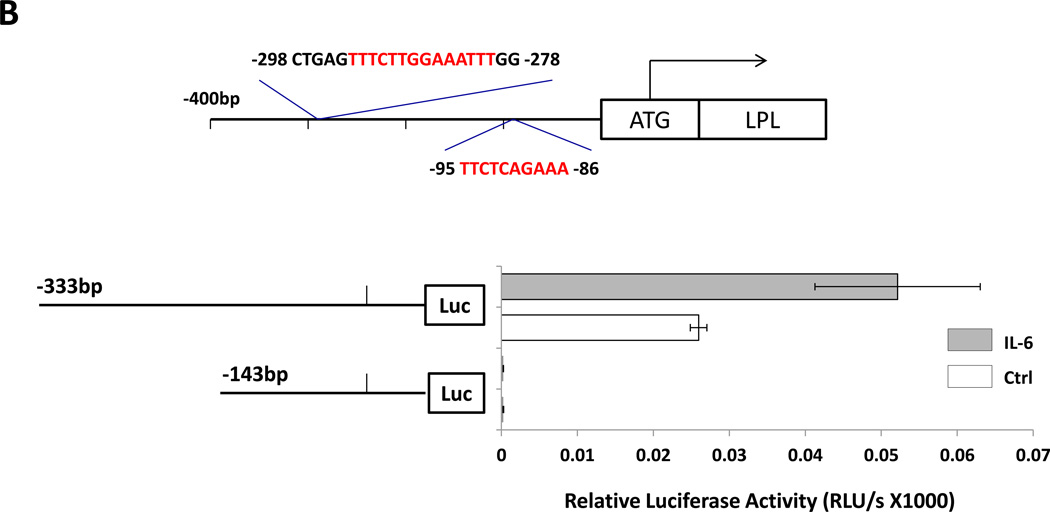
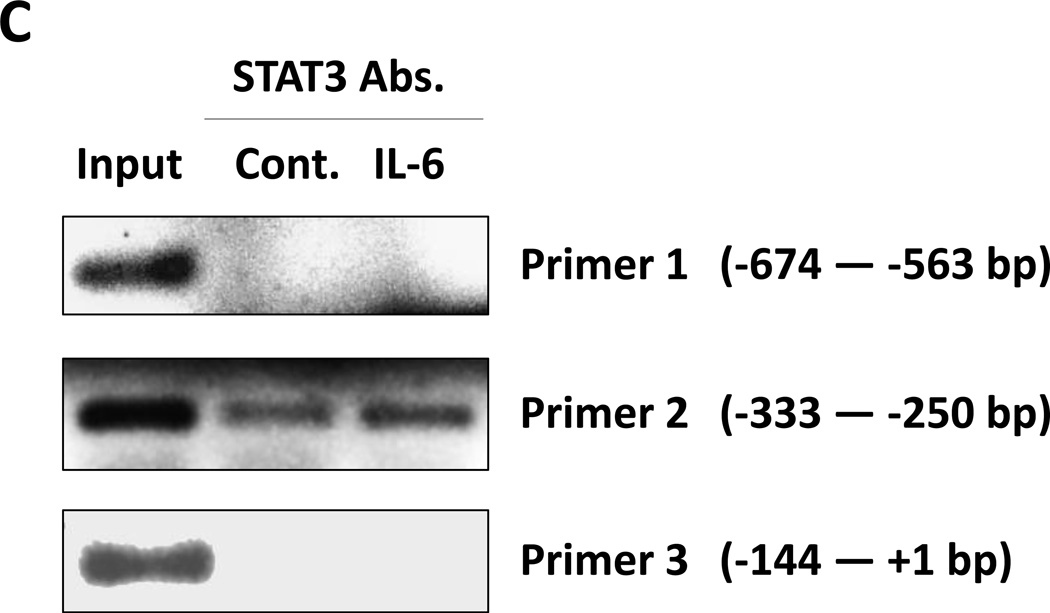
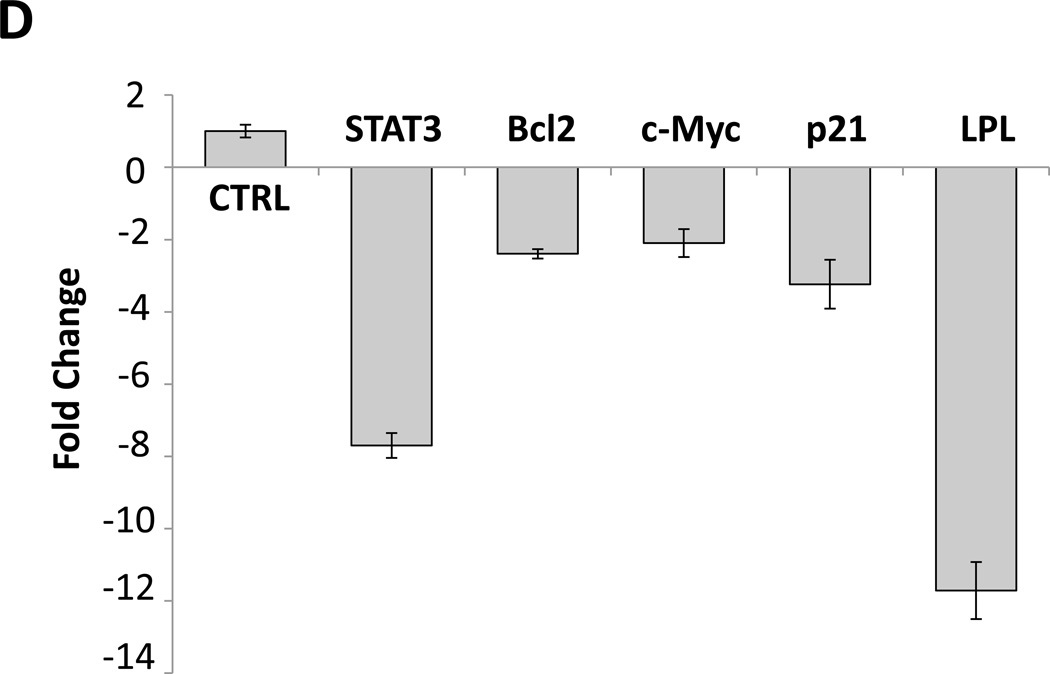
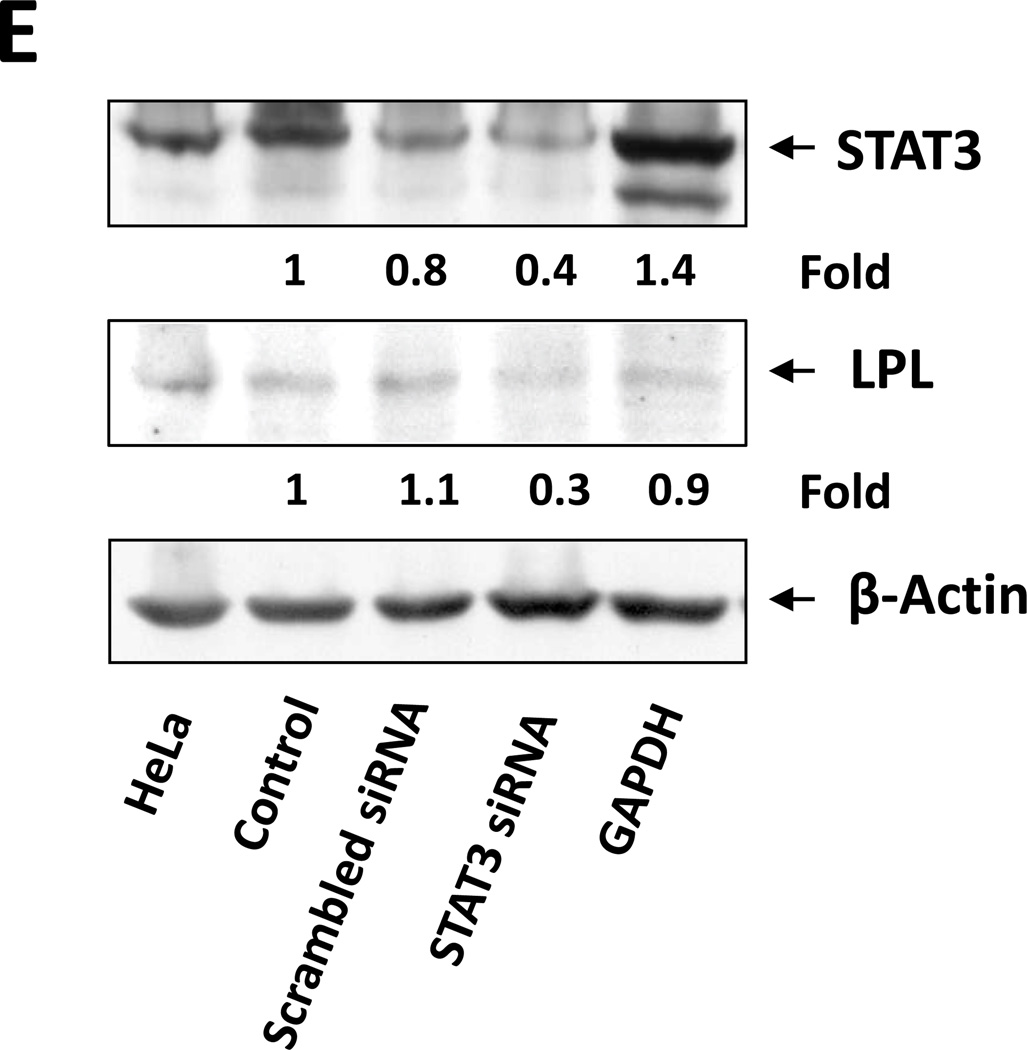
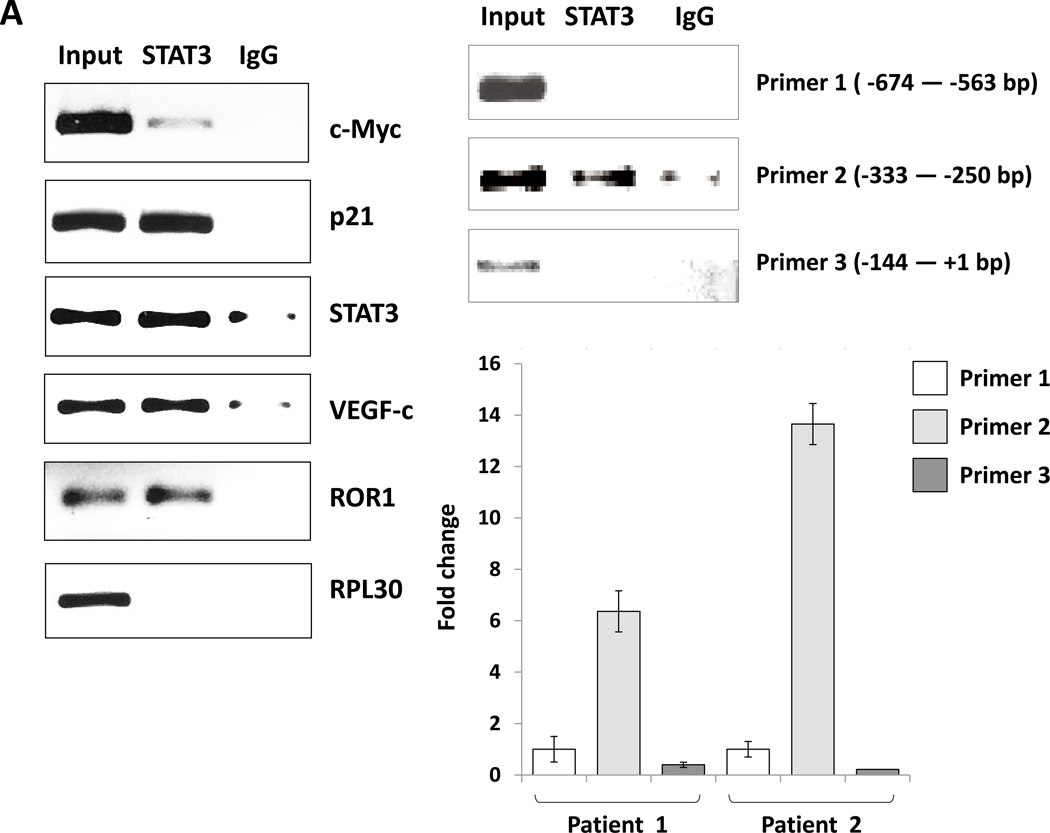
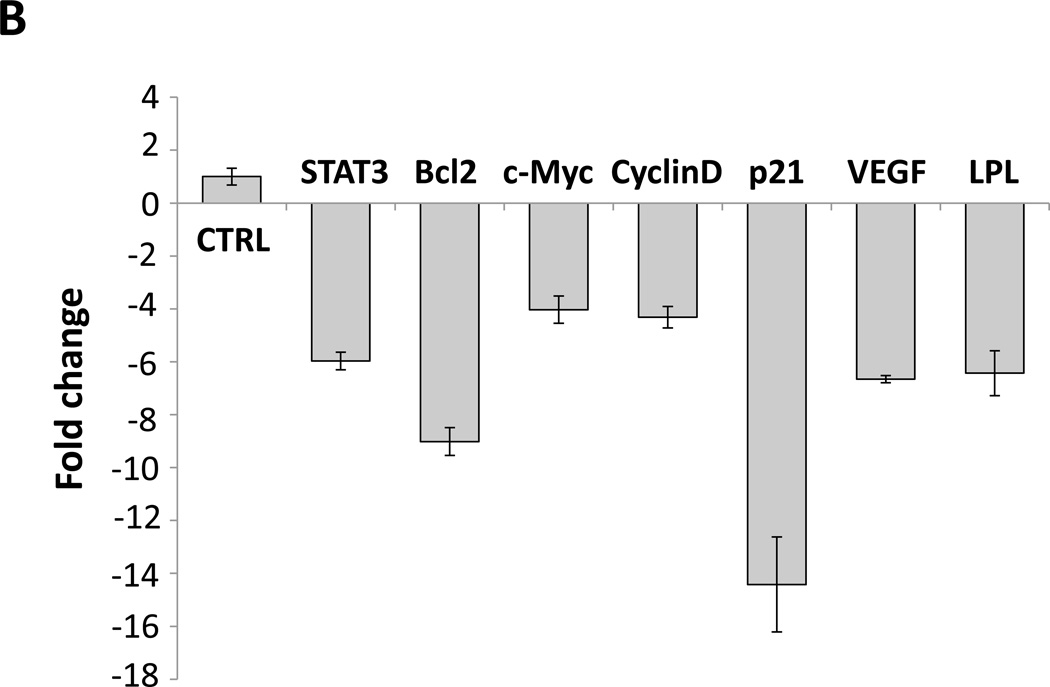
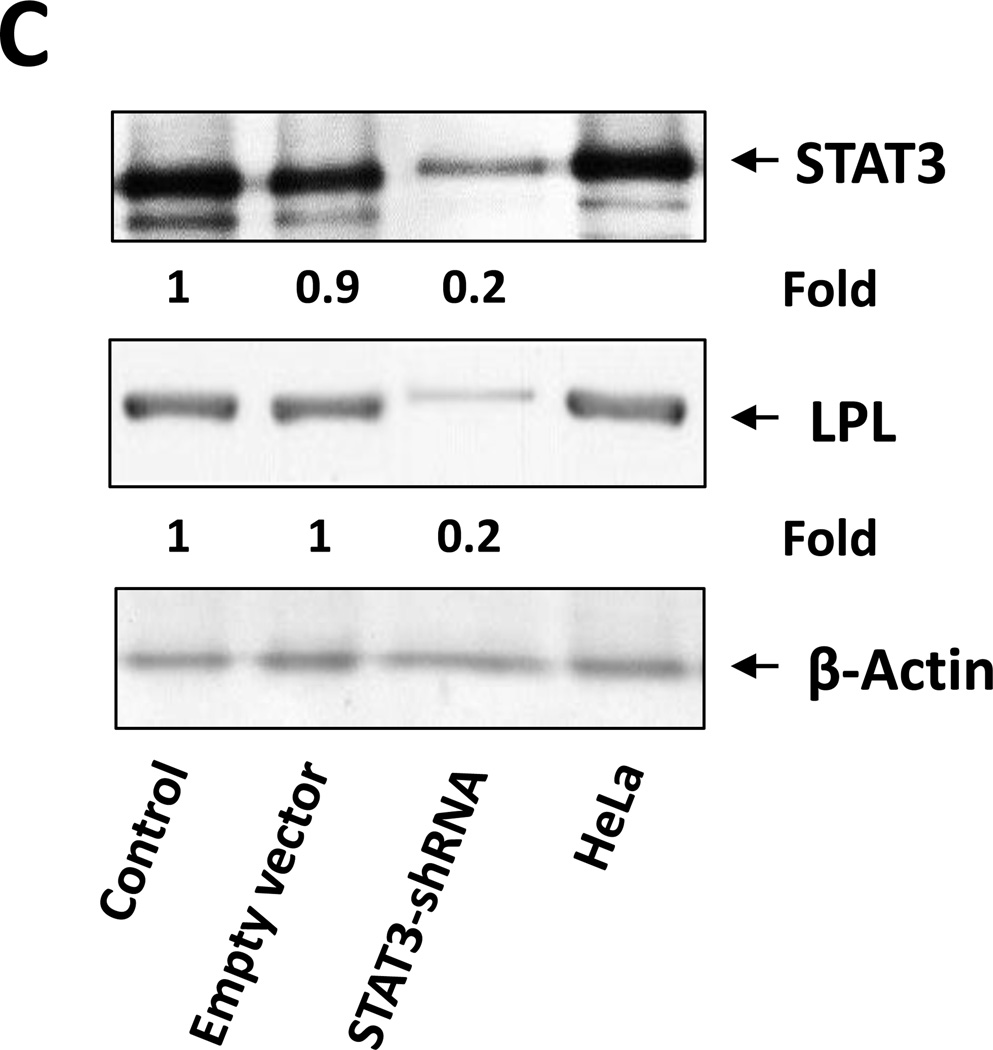
While reviewing chronic lymphocytic leukemia (CLL) bone marrow slides, we identified cytoplasmic lipid vacuoles in CLL cells but not in normal B cells. Because lipoprotein lipase (LPL), which catalyzes hydrolysis of triglycerides into free fatty acids (FFA), is aberrantly expressed in CLL, we investigated whether LPL regulates the oxidative metabolic capacity of CLL cells. We found that unlike normal B cells, CLL cells metabolize FFAs. Because STAT3 is constitutively activated in CLL cells and because we identified putative STAT3 binding sites in the LPL promoter, we sought to determine whether STAT3 drives the aberrant expression of LPL. Transfection of luciferase reporter gene constructs driven by LPL promoter fragments into MM1 cells revealed that STAT3 activates the LPL promoter. In addition, chromatin immunoprecipitation confirmed that STAT3 binds to the LPL promoter. Furthermore, transfection of CLL cells with STAT3-shRNA downregulated LPL transcripts and protein levels, confirming that STAT3 activates the LPL gene. Finally, transfection of CLL cells with LPL-siRNAs decreased the capacity of CLL cells to oxidize FFAs and reduced cell viability.

Implications: Our study suggests that CLL cells adopt their metabolism to oxidize FFA. Activated STAT3 induces LPL, which catalyzes the hydrolysis of triglycerides into FFA. Therefore, inhibition of STAT3 is likely to prevent the capacity of CLL cells to utilize FFA.


Conflict of interest statement

Conflict-of-interest disclosure

The authors declare no competing financial interests.

Figures

Figure 1
Figure 1. Lipid vacuoles are detected in bone marrow CLL cells
(A) CLL patients’ bone marrow aspirate smears stained with Oil Red O imaged using light microscopy show leukemia cells with stained inclusion bodies. (B) TEM showing numerous lucent vacuoles 100 to 500 nm in diameter (black arrows) scattered in the cytoplasm of a CLL cells. Enlarged micrographs of the areas in the boxes (left panel) are depicted in the right panel. The white arrow points to a 30-nm peroxisome adjacent the nuclear membrane. (C) TEM images of normal B cells. Unlike in CLL cells, lipid vacuoles are not seen in the cytoplasm of normal B lymphocytes. Cell regions suspected to contain vacuoles (black boxes, left panel) were enlarged and, as shown in the right panel, did not contain lipid vacuoles.
Figure 2
Figure 2. LPL is detected in CLL cells but not in normal B cells
(A) Western blot analysis of lysates from five CLL cells and two normal B cells detected LPL and pSTAT3 in CLL cells but not in normal B cells. STAT3 was detected in normal B cells but at levels lower than those in CLL cells. (B) Confocal microscopic images (×400) of freshly isolated CLL cells stained with anti-CD19 and anti-LPL antibodies for 1 hour. LPL was detected on cell surfaces and cytoplasm of CLL cells.
Figure 3
Figure 3. Palmitic acid and oleic acid increase CLL cells’ metabolism
(A) CLL cells were incubated with MEM in the presence or absence of 80 mM palmitic acid (left upper panel) or oleic acid (right upper panel upper) in sealed tissue culture flasks. In a separate experiment CLL cells were incubated with PBS in the presence or absence of FFA (left lower panel). The culture media dO2 concentration was assessed prior to and after 48 hours of incubation. All control cultures contained ethanol at the same concentration as in palmitic acid and oleic acid. To compare dO2 we used the difference in 02 before and after the incubation (in mg/l).The relative difference in dO2 before after adding FFA is depicted after the dO2 in the controls was set to 1. Similar experiments with normal B cells (right lower panel) showed no change in the culture media dO2 concentration. The mean and standard error of the mean from 3 different patients for each condition are represented by the bars. (B) dO2 concentration was measured after 48 hours incubation of PBS (control), ethanol (ETOH; at the concentration present in palmitic acid and oleic acid), palmitic acid (PA) or oleic acid (OA) with or without CLL cells. Marked reduction in dO2 after 48 hours was observed only when CLL cells were added to culture. * P = 0.02, ** P = 0.002, *** P <.0001. (C) Flow cytometry analysis of CLL cells from two patients. Depicted are analyses of CLL cells from 2 different CLL patients transfected with LPL-siRNA or with GAPDH (transfection control). The percentages of viable cells are shown in the left lower quadrant (annexin V /PI-negative) of each panel. (D) Spontaneous apoptosis rate was recorded from CLL cells of 7 CLL patients prior to and 72 hours after transfecting the cells with LPL-siRNA or with GAPDH (transfection control). Significant increase in apoptosis rate in cells transfected with LPL-siRNA was observed. The data are depicted as delta apoptosis rate before and after transfection. To assess the differences in apoptosis rates of cells transfected with LPL-siRNA and GAPDH we used the Student t-test with delta apoptosis as the dependent variable. (E) LPL knockdown abrogates oxygen consumption in the presence of palmitic acid. CLL cells were transfected by electroporation with LPL-siRNA or with FAM-labeled GAPDH or left untreated. LPL-siRNA transfection efficiency in the CLL cells ranged from 35% to 50%. Left upper panel: PCR gel electrophoresis showing reduction in the LPL transcript level after treatment with LPL-siRNA. Left lower panel: RNA expression after LPL-siRNA transfection as shown by qRT-PCR. LPL expression was five times lower in cells transfected with LPL-siRNA than in cells transfected with GAPDH. Right panel: Untreated cells or cells transfected with LPL-siRNA or with GAPDH were incubated in the presence of palmitic acid. After 48 hours, the dO2 concentration was measured. Shown are the means and standard error of the mean of three experiments using cells from three patients. The dO2 level in the culture medium of the LPL siRNA–transfected cells was significantly higher than the dO2 levels in either control. NS, not significant.
Figure 4
Figure 4. STAT3 activates the LPL promoter in MM1 cells
(A) Detection of pSTAT3 and LPL in IL-6–stimulated MM1 cells. MM1 cells were incubated with increasing concentrations of IL-6 (0 to 20 ng/mL for 2 hours (left panel), and with 10 ng/mL of IL-6 for 0 to 4 hours (right panel). Cell lysates underwent Western blot analysis with anti-tyrosine pSTAT3, anti-STAT3, and anti-LPL antibodies. HeLa cells incubated with IL-6 for 4 hours were used as positive controls in each panel. Incubation with IL-6 increased the levels of tyrosine pSTAT3 and LPL in a dose- and time-dependent manner. (B) On the basis of the presence and locations of GAS-like elements in the LPL promoter (upper panel), we transfected MM1 cells with truncated forms of the LPL promoter and the luciferase reporter gene (left lower panel). In the right lower panel, the horizontal bars show the mean ± standard error of the mean for luciferase activity levels of transfected MM1 cells incubated without or with 20 ng/mL IL-6. (C) ChIP assay. DNA obtained from chromatin fragments of MM1 cells incubated without or with IL-6, before (input) or after co-immunoprecipitation with anti-STAT3 antibodies, was analyzed using primers directed at three GAS-like elements located between +1 bp and −674 bp upstream of the LPL gene TSS. DNA co-immunoprecipitated with anti-STAT3 antibodies could be amplified by with primer 2 but not 1 or 3. The amplification of the DNA from IL-6–treated cells was stronger than that from untreated cells ((D) Transfection with STAT3 siRNA. MM1 cells were transfected with STAT3 siRNA using electroporation. Transfection efficiency, calculated by assessing the level of intracellular GFP-conjugated siRNA, was 50%. The cells were incubated with IL-6 for 2 hours, and then RNA was extracted and qRT-PCR performed to determine the levels of the STAT3-regulated genes STAT3, ROR1, c-Myc, cyclin D1, p21, and LPL. The experiment was repeated three times. The means and the standard error of the mean of mRNA levels are depicted. As shown, a 12-fold decrease in the LPL transcript level and 2- to 8-fold decreases in STAT3-regulated transcript levels compared with the control were observed. (E) CLL cells were transfected with STAT3 siRNA, scrambled siRNA, or GAPDH. Cellular protein was extracted and analyzed by Western blot analysis.
Figure 5
Figure 5. STAT3 activates the LPL promoter in CLL cells
(A) ChIP assay. CLL cell protein extract was incubated without or with anti-STAT3 antibodies, and DNA was extracted from chromatin fragments. As shown in the left panel, anti-STAT3 antibodies co-immunoprecipitated DNA of the STAT3 target genes c-Myc, p21, STAT3, VEGF-c, and ROR1 but not of the ribosomal RPL30 gene (used as negative control). As in Figure 4C, “Input” denotes DNA extracted from non-immunoprecipitated CLL cell chromatin fragments (negative control) IgG is the isotype of the anti-STAT3 antibodies. The right panel upper depicts ChIP of CLL cells. As shown, STAT3 co-immunoprecipitated DNA that was amplified with primers designed to amplify site 2 but not primers designed to amplify site 1 or site 3 of the LPL-promoter regions. The right lower panel depicts results of two separate experiments analyzed using qRT-PCR. Similar to the results depicted in the right upper panel, STAT3 co-immunoprecipitated DNA was significantly amplified with primer 2. (B) CLL cells were transfected with STAT3-shRNA or with an empty vector. Compared with cells transfected with empty vector (CTRL), the cells that were transfected with STAT3-siRNA expressed significantly lower levels of STAT3-regulated genes including LPL. (C) Western blot analysis of CLL cells transfected with STAT3 shRNA or empty vector showed that compared with an empty vector, STAT3 shRNA downregulated STAT3 and LPL protein levels by 80%.

References

    1. Chiorazzi N, Rai KR, Ferrarini M. Chronic lymphocytic leukemia. N Engl J Med. 2005;352(8):804–815. - PubMed
    1. Damle RN, Ghiotto F, Valetto A, et al. B-cell chronic lymphocytic leukemia cells express a surface membrane phenotype of activated, antigen-experienced B lymphocytes. Blood. 2002;99(11):4087–4093. - PubMed
    1. Klein U, Tu Y, Stolovitzky GA, et al. Gene expression profiling of B cell chronic lymphocytic leukemia reveals a homogeneous phenotype related to memory B cells. J Exp Med. 2001;194(11):1625–1638. - PMC - PubMed
    1. Tangye SG, Avery DT, Deenick EK, Hodgkin PD. Intrinsic differences in the proliferation of naive and memory human B cells as a mechanism for enhanced secondary immune responses. J Immunol. 2003;170(2):686–694. - PubMed
    1. Chiorazzi N. Cell proliferation and death: forgotten features of chronic lymphocytic leukemia B cells. Best Pract Res Clin Haematol. 2007;20(3):399–413. - PubMed

Publication types

MeSH terms