. 2015 Mar 2;208(5):563-79.
doi: 10.1083/jcb.201406099.

Rad51-mediated replication fork reversal is a global response to genotoxic treatments in human cells

Affiliations

Rad51-mediated replication fork reversal is a global response to genotoxic treatments in human cells

Ralph Zellweger et al. J Cell Biol. .

Abstract

Replication fork reversal protects forks from breakage after poisoning of Topoisomerase 1. We here investigated fork progression and chromosomal breakage in human cells in response to a panel of sublethal genotoxic treatments, using other topoisomerase poisons, DNA synthesis inhibitors, interstrand cross-linking inducers, and base-damaging agents. We used electron microscopy to visualize fork architecture under these conditions and analyzed the association of specific molecular features with checkpoint activation. Our data identify replication fork uncoupling and reversal as global responses to genotoxic treatments. Both events are frequent even after mild treatments that do not affect fork integrity, nor activate checkpoints. Fork reversal was found to be dependent on the central homologous recombination factor RAD51, which is consistently present at replication forks independently of their breakage, and to be antagonized by poly (ADP-ribose) polymerase/RECQ1-regulated restart. Our work establishes remodeling of uncoupled forks as a pivotal RAD51-regulated response to genotoxic stress in human cells and as a promising target to potentiate cancer chemotherapy.


Figures

Figure 1.
Figure 1.
Mild genotoxic stress induces marked fork slowing in the absence of chromosomal breakage. (A) DNA fiber spreading. Statistical analysis of IdU replicated track length in U2OS cells, comparing not treated (NT) conditions with the indicated treatments. The labeling protocol and representative fibers are included in Fig. S1. At least 100 tracks were scored per sample. Horizontal lines represent the median value, and boxes and whiskers show 10–90th percentiles. Statistical analysis t test according to Mann–Whitney, results are ns, not significant; ****, P ≤ 0.0001. All experiments have been repeated at least twice, with very similar results. (B) PFGE analysis for DNA breakage detection in untreated U2OS cells and upon 1-h treatment of the indicated doses of genotoxic treatments. 1 µM camptothecin (CPT) treatment is used as a positive control for DSB formation. See also Fig. S1 for the selection of appropriate doses for each treatment. Fig. 4 and Fig. S4 include data on DDR activation possibly associated with minor levels of DSB detected in B.
Figure 2.
Figure 2.
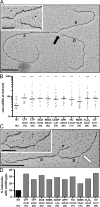
Genotoxic treatments lead to extended ssDNA regions at replication forks and ssDNA gaps on replicated duplexes. (A and C) Electron micrographs of representative replication fork from U2OS cells, after 1-h treatment with 100 nM APH (A) and 50 µM MMS (C), respectively. P indicates the parental duplex, whereas D indicates daughter duplexes. The black arrow points to an ssDNA region at the fork, whereas the white arrow indicates an ssDNA gap on a replicated duplex. The relevant portions of the molecules are magnified in the insets. Bars: (main images) 0.5 kb; (insets) 0.2 kb. (B) Graphical distribution of ssDNA length at the junction (black arrow in A) in not treated (NT) U2OS cells and upon the indicated treatments (UV pulse or 1-h treatment). Only molecules with detectable ssDNA stretches are included in the analysis. The lines show the median lengths of the ssDNA regions at the fork in the specific set of analyzed molecules. Statistical analysis t test according to Mann–Whitney results are *, P ≤ 0.1; **, P ≤ 0.01; ***, P ≤ 0.001; ****, P ≤ 0.0001. In brackets, the total number of analyzed molecules is given. (D) Frequency of replication forks with at least one ssDNA gap (white arrow in C) in untreated U2OS cells and upon the indicated treatments. In brackets, the total number of analyzed molecules is given. Similar results to those displayed in B and D were obtained in at least one independent experiment (see also Fig. S2 and Fig. 6 A).
Figure 3.
Figure 3.
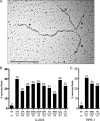
All tested sources of genotoxic stress lead to frequent replication fork reversal. (A) Electron micrograph of a representative reversed replication fork from U2OS cells treated for 1 h with 20 nM ETP. P indicates the parental duplex, D indicates daughter duplexes, and R indicates the regressed arm. Bar, 0.5 kb. (B and C) Frequency of reversed replication forks in U2OS (B) or RPE-1 cells (C) either not treated (NT) or upon the indicated treatments (UV pulse or 1-h treatment). In brackets, the total number of analyzed molecules is given. Above each column, the percentage of reversed forks is indicated. Similar results were obtained in at least one independent experiment (see also Fig. S3 and Fig. 6 A).
Figure 4.
Figure 4.
Differential ATR and ATM activation upon different genotoxic treatments, despite similar structural features of RIs. (A) Immunoblot for ATR (pCHK1) and ATM (pKAP1) activation and total DDR proteins (CHK1 and KAP1) in not treated (NT) U2OS cells and upon the indicated treatments (UV pulse or 1-h treatment). RPA32 (RPA) phosphorylation at S4/S8 indicates ATM/DNA-dependent protein kinase (DNA-PK) activation and is typically used as a DSB marker. Total RPA32 levels (and phosphorylation-associated mobility shift) are also displayed. 1 µM CPT treatment is used as positive control for full DDR activation. TFIIH is used as a loading control. (B) Native immunofluorescence staining for cells grown with 10 µM BrdU for 48 h and treated with the indicated drugs for 1 h. Red staining, γ-H2AX; green staining, BrdU (ssDNA); blue, DAPI. Bar, 15 µM. (C) Relative quantification of double-negative cells and cells positive for γ-H2AX, native BrdU staining (natBrdU), or both for the experiment in B. The data shown are from a single representative experiment out of three repeats, with n > 100. (D) Flow cytometry analysis of DNA synthesis (EdU), DNA content (DAPI), and DDR activation (γ-H2AX) in untreated U2OS cells and upon the indicated treatments. Dashed line indicates threshold for EdU incorporation and γ-H2AX positivity, respectively. See also Fig. S4 and Tables 1 and 2.
Figure 5.
Figure 5.
RECQ1 and PARP activity control replication fork progression and accumulation/restart of reversed forks upon different types of genotoxic stress. (A) Statistical analysis of IdU track length measurements, according to the labeling protocol in Fig. S1, in U2OS cells stably transduced (shRNA) for Luciferase (shLuc) or RECQ1 (shRECQ1) depletion. 200 nM MMC and 500 µM HU were optionally added concomitantly with the second label (IdU). The PARP inhibitor olaparib (Ola; 10 µM) was optionally added 2 h before CldU labeling and maintained during labeling. At least 100 tracks were scored for each dataset. Horizontal lines represent the median value, and boxes and whiskers indicate the 10–90th percentiles. t test according to Mann–Whitney; ns, not significant; ****, P < 0.0001. Similar results were obtained in at least one independent experiment. (B) Frequency of reversed forks detected by EM in U2OS cells stably transfected (shRNA) for Luciferase or RECQ1 depletion. The cells were optionally treated for 1 h with 200 nM MMC or 500 µM HU, after an optional 2-h pretreatment with olaparib. Reversed fork restart was assessed by measuring the frequency of reversed forks 3 h after drug removal (release [Rel.]). In brackets, the total number of analyzed molecules is given. Above each column, the percentage of reversed forks is indicated. Similar results were obtained in at least one independent experiment. RECQ1 levels after shRNA-mediated depletion were detected by immunoblotting. TFIIH was used as a loading control. NT, not treated.
Figure 6.
Figure 6.
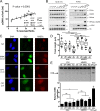
RAD51 is present at forks upon mild genotoxic stress and modulates fork progression and integrity. (A) Linear regression analysis shows strict direct correlation (P < 0.0001) between accumulation of ssDNA at the fork (median values of ssDNA regions at the junction) and frequency of fork reversal. Results from two independent experiments are displayed for untreated U2OS cells and for each genotoxic treatment. (B) HEK293T cells were EdU-labeled as indicated in Fig. S5 C and treated with sublethal doses of genotoxic drugs (0.5 mM HU, 200 nM MMC, or 25 nM CPT). Proteins and relative posttranslational modifications associated with replication forks were isolated by iPOND procedure and detected with the indicated antibodies. The thymidine (Thy; 10 µM) chase experiment is used to discriminate proteins associated with chromatin behind replicating forks. In the control (Ctrl) experiment, the click reaction is performed using DMSO instead of biotin azide. 1 µM CPT treatment is used as positive control to induce high replication stress and DSBs. (C) Immunofluorescence staining for U2OS cells grown on coverslips and treated with the indicated drugs for 1 h. Red staining, RAD51; green staining, EdU; blue, DAPI. Bar, 15 µM. (D) DNA fiber spreading. Statistical analysis of IdU replicated track length in U2OS cells, comparing not treated (NT) conditions with the indicated treatments. U2OS cells were transfected with siRNA against luciferase (siLuc) or RAD51 (siRAD51) 24 h before CldU or IdU labeling. At least 100 tracks were scored per sample. Horizontal lines represent the median value, and boxes and whiskers indicate 10–90th percentiles. Statistical analysis: one-way ANOVA; ns, not significant; ***, P ≤ 0.001. (E) PFGE analysis for DNA breakage detection in untreated U2OS cells and upon 1-h treatment with indicated doses of genotoxic treatments. U2OS cells were transfected with siRNA against luciferase or RAD51 24 h before treatments. 1 µM camptothecin (CPT) treatment is used as a positive control for DSB formation. The graph shows quantitative DSB induction from three independent experiments and includes average value and standard deviations (error bars). Statistical analysis: two-way ANOVA; ns, not significant; *, P ≤ 0.05.
Figure 7.
Figure 7.
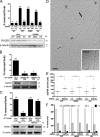
RAD51 is required to convert uncoupled forks into reversed forks in response to different genotoxic treatments. (A–C) Frequency of reversed replication forks detected by EM in U2OS cells. In A, U2OS cells were transfected with Luciferase siRNA (siLuc) or RAD51siRNA (siRAD51) 72 h before DNA extraction from untreated cells or cells treated with 25 nM CPT, 200 nM MMC, or 500 nM HU for 1 h. In B, U2OS cells were transfected with Luciferase or RAD51 siRNA 24 h before treatment with 25 nM CPT for 1 h. In C, U2OS cells containing an empty vector, and U2OS cells expressing exogenous RAD51 were transfected with Luciferase or RAD51 siRNA (against 3′ UTR region of RAD51) 24 h before treatment with 25 nM CPT for 1 h. In brackets, the total number of analyzed molecules is given. Above each column, the percentage of reversed forks is indicated. Similar results were obtained in at least one independent experiment. RAD51 levels after siRNA-mediated depletion were detected by immunoblotting. β-Tubulin is used as a loading control. EV, empty vector. (D) Electron micrograph of a representative replication fork with an extended ssDNA region at the junction (black arrow, magnified in the inset) upon RAD51 depletion and treatment with 25 nM CPT for 1 h. Bars: (main image) 0.5 kb; (inset) 0.2 kb. P indicates the parental duplex, and D indicates daughter duplexes. (E) Graphical distribution of ssDNA length at the junction (black arrow in C) in U2OS cells transfected with Luciferase siRNA and RAD51 siRNA and treated with 25 nM CPT, 200 nM MMC, and 500 nM HU for 1 h. The lines show the median length of the ssDNA region at the fork in the specific set of analyzed molecules. Statistical analysis t test according to Mann–Whitney, results are **, P ≤ 0.01; ***, P ≤ 0.001. Similar results were obtained in at least one independent experiment. (F) Frequency of replication forks with ssDNA gaps (Fig. 2 C and Fig. S2) in U2OS cells transfected with Luciferase or RAD51 siRNA 48 h before treatment with 25 nM CPT, 200 nM MMC, or 500 nM HU for 1 h. Similar results were obtained in at least one independent experiment. NT, not treated.
Figure 8.
Figure 8.
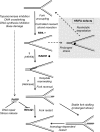
Schematic model for replication fork reversal and restart upon different types of replication stress. Template damage, DNA synthesis inhibition, or torsional stress rapidly impair symmetric elongation of nascent strands and induce replication fork uncoupling, leading to extended ssDNA regions at the fork. Controlled nascent strand resection may participate in ssDNA exposure. As characterized during DSB processing and repair, when ssDNA regions reach a critical size, the recombinase RAD51 partially replaces RPA at uncoupled forks, possibly assisted by cofactors belonging to the homologous recombination (HR) and Fanconi anemia (FA) pathways. RAD51-mediated template reannealing primes replication fork reversal, probably in concert with yet-unidentified specialized enzymatic activities, assisting template repair and limiting nucleolytic degradation of nascent strands upon prolonged stalling. PARP activation at discontinuous nascent strands and/or regressed arms stabilizes the forks in the reversed state, by transiently inhibiting the specific restart activity of RECQ1 helicase until the damage is repaired or the stress is released. RAD51 loading on regressed arms may further protect forks after reversal and promote alternative homology-mediated pathways of fork restart upon prolonged stalling.

References

    1. Adelman C.A., Lolo R.L., Birkbak N.J., Murina O., Matsuzaki K., Horejsi Z., Parmar K., Borel V., Skehel J.M., Stamp G., et al. . 2013. HELQ promotes RAD51 paralogue-dependent repair to avert germ cell loss and tumorigenesis. Nature. 502:381–384 10.1038/nature12565 - DOI - PMC - PubMed
    1. Alabert C., Bukowski-Wills J.C., Lee S.B., Kustatscher G., Nakamura K., de Lima Alves F., Menard P., Mejlvang J., Rappsilber J., and Groth A.. 2014. Nascent chromatin capture proteomics determines chromatin dynamics during DNA replication and identifies unknown fork components. Nat. Cell Biol. 16:281–293 10.1038/ncb2918 - DOI - PMC - PubMed
    1. Arlt M.F., Wilson T.E., and Glover T.W.. 2012. Replication stress and mechanisms of CNV formation. Curr. Opin. Genet. Dev. 22:204–210 10.1016/j.gde.2012.01.009 - DOI - PMC - PubMed
    1. Ball H.L., Myers J.S., and Cortez D.. 2005. ATRIP binding to replication protein A-single-stranded DNA promotes ATR-ATRIP localization but is dispensable for Chk1 phosphorylation. Mol. Biol. Cell. 16:2372–2381 10.1091/mbc.E04-11-1006 - DOI - PMC - PubMed
    1. Bermejo R., Capra T., Jossen R., Colosio A., Frattini C., Carotenuto W., Cocito A., Doksani Y., Klein H., Gómez-González B., et al. . 2011. The replication checkpoint protects fork stability by releasing transcribed genes from nuclear pores. Cell. 146:233–246 10.1016/j.cell.2011.06.033 - DOI - PMC - PubMed

Publication types