. 2015 Mar 2;208(5):597-612.
doi: 10.1083/jcb.201406020.

GSK3- and PRMT-1-dependent modifications of desmoplakin control desmoplakin-cytoskeleton dynamics

Affiliations

GSK3- and PRMT-1-dependent modifications of desmoplakin control desmoplakin-cytoskeleton dynamics

Lauren V Albrecht et al. J Cell Biol. .

Abstract

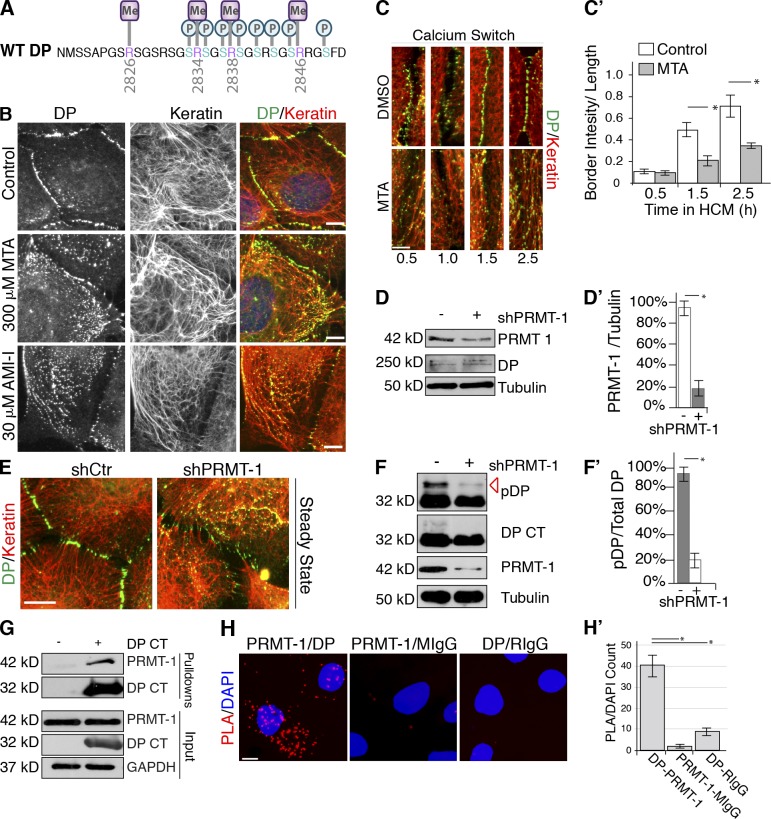
Intermediate filament (IF) attachment to intercellular junctions is required for skin and heart integrity, but how the strength and dynamics of this attachment are modulated during normal and pathological remodeling is poorly understood. We show that glycogen synthase kinase 3 (GSK3) and protein arginine methyltransferase 1 (PRMT-1) cooperate to orchestrate a series of posttranslational modifications on the IF-anchoring protein desmoplakin (DP) that play an essential role in coordinating cytoskeletal dynamics and cellular adhesion. Front-end electron transfer dissociation mass spectrometry analyses of DP revealed six novel serine phosphorylation sites dependent on GSK3 signaling and four novel arginine methylation sites including R2834, the mutation of which has been associated with arrhythmogenic cardiomyopathy (AC). Inhibition of GSK3 or PRMT-1 or overexpression of the AC-associated mutant R2834H enhanced DP-IF associations and delayed junction assembly. R2834H blocked the GSK3 phosphorylation cascade and reduced DP-GSK3 interactions in cultured keratinocytes and in the hearts of transgenic R2834H DP mice. Interference with this regulatory machinery may contribute to skin and heart diseases.


Figures

Figure 1.
Figure 1.
GSK3 signaling promotes desmosome assembly. (A) Schematic diagram of GSK3 consensus sites (bold) in DP. (B) NaCl- and LiCl-treated SCC9 cells stained with DP (NW6), assessed by immunofluorescence. Bars, 10 µm. (C) NaCl- and LiCl-treated SCC9 cells stained with DP (NW6) and keratin (K8), assessed by confocal immunofluorescence. (C′) Pearson’s correlation coefficients were calculated for DP and keratin. *, P < 0.001. Error bars indicate SEM. (D) LiCl-, Kenpaullone-, and siCtr- or siGSK3-treated SCC9s, assessed by immunofluorescence. (E and E′) NaCl- or LiCl-treated SCC9s transfected with control or caGSK3, assessed by immunofluorescence. DP fluorescence intensity was measured, normalized to background, and plotted. (F) caGSK3 was transfected into SCC9s and assessed by immunoblotting. (G) LiCl or NaCl SCC9s, fixed at 0, 1.0, and 2.5 h after being switched into high calcium media, were assessed by immunofluorescence. (G′) DP fluorescence intensity along cell borders was quantified (>200 cell borders) from three independent experiments. *, P < 0.001. Error bars indicate SEM. (H) Monolayers of SCC9 cells stably expressing WT DP-GFP (Godsel et al., 2005) were subjected to scratch wounding, treated with either 40 mM NaCl or LiCl, and imaged. Shown are stills of Videos 1 and 2 at 0 and 80 min. White arrows mark forming borders. (H′) Stills of LiCl treatment in WT DP-GFP cells from Video 3. Green circles denote DP particles appearing and being retained in the cytoplasm in a filamentous alignment. Time points indicate the minutes lapsed from initiation of cell–cell contact. Bars, 10 µm. (H″) Recruitment of DP-GFP to SCC9 cell–cell borders occurs in three temporally overlapping phases (Godsel et al., 2005) in control cells, whereas LiCl treatment decreases DP border intensity. Fluorescent intensities over time were calculated for representative borders from Videos 1 and 2 and correspond to borders shown in H. Results are representative of data obtained from >30 videos for each condition.
Figure 2.
Figure 2.
GSK3 is recruited to DP to modulate DP–IF complexes. (A) Endogenous DP associates with HA-GSK3 in HA immunoprecipitations in HEK 293 cells, assessed by immunoblotting. (B) SCC9 cells were fixed, and DP and GSK3 associations were analyzed by PLA analysis using anti-DP (NW6) and anti-GSK3 antibodies. Direct interactions (red) and nuclei (DAPI, blue). Bars, 10 µm. (B′) PLA fluorescent spots are counted and divided by the total number of nuclei in an image. Data were obtained from antibody pairs for >500 cells per experiment for three independent experiments. *, P < 0.001. Error bars indicate SEM. (C and C′) Phospho-DP in LiCl- or NaCl-treated SCC9s, assessed by immunoblotting. Full-length endogenous DP has two known isoforms, DPI (310 kD) and DPII (250 kD) that are generated by alternative splicing. Both of these contain S2849 and are recognized by the phospho-DP antibody. Densitometry quantification of three independent experiments. Error bars indicate SEM. (D) DP phosphorylation in siCtr or siGSK3-treated cells, assessed by immunoblotting. (E and E′) Phospho-DP in control or caGSK3 transfected cells, and lysates were assessed by immunoblotting. Densitometry quantification of three independent experiments. *, P < 0.001. Error bars indicate SEM. (F) S-tag affinity pull-down of HA-GSK3 and DP S-tag (DP CT) HEK 293 cells, assessed by immunoblotting. (G) NaCl-, LiCl-, or Ly-294,002 (GSK3 activator)–treated DP S-tag (DP CT) expressing cell lysates, assessed by immunoblotting. DP S-tag (DP CT) is present as a doublet where the lower band (32 kD) contains phosphorylation of S2849, whereas the higher band (red arrow, 36 kD) contains both phosphorylation of S2849 and downstream GSK3-phosphorylated sites (see cartoon in Fig. 3 A). (G′) Densitometry quantification of G from three independent experiments. *, P < 0.001. Error bars indicate SEM. (H) NaCl- or LiCl-treated DP S-tag (DP CT) cells were transfected with control or caGSK3, assessed by immunoblotting. Long exposure and short exposure of DP CT blot shown to visualize upper phospho-states of DP (36 kD). (H′) Densitometry quantification of phospho-DP divided by total DP from three independent experiments. Error bars indicate SEM.
Figure 3.
Figure 3.
GSK3 promotes phosphorylation cascades of the DP CT tail. (A) GSK3 cascade 1 (solid arrows) and 2 (dotted arrows) in WT, S2849G (red), and R2834H (*) DP. (B) NaCl- or LiCl-treated WT DP S-tag (DP CT) cell lysates were assessed by phos-tag immunoblot analyses (red arrow, 36 kD). (C and C′) Phosphorylation of DP S-tag (DP CT) point mutations, S2845A and T2853A, assessed by immunoblotting. Red arrows mark GSK3 phosphorylation of DP. Densitometry quantification of three independent experiments. *, P < 0.001. Error bars indicate SEM. (D and D′) NaCl-, LiCl-, DMSO-, or Ly-294,002–treated WT, S2845A, or T2853A DP S-tag (DP CT) lysates, assessed by immunoblotting. Densitometry quantification of three independent experiments. *, P < 0.001. Error bars indicate SEM. (E and E′) DMSO-, KT 5720-, Gö 6976-, or LiCl-treated DP S-tag (DP CT) lysates, assessed by immunoblotting (red arrow, 36 kD). Densitometry quantification of three independent experiments. Error bars indicate SEM. (F) DP S-tag (DP CT) expressing HEK 293 cells were treated with kinase inhibitors targeting CKI, CKII, MNKI, atypical PKC, and DYRK kinases, assessed by immunoblotting. (G) Control, 40 mM LiCl-, and PMA-treated SCC9s, assessed by immunofluorescence. Bars, 10 µm. (H and H′) GSK3 interactions with S2849G and WT DP S-tag (DP CT) in HEK 293 cells were examined after S-tag pull-down analyses where RIPA lysates (input) and pull-down products were analyzed by immunoblotting and quantified by densitometry. *, P < 0.03. Error bars indicate SEM.
Figure 4.
Figure 4.
AC point mutant (R2834H) in C-tail alters DP border localization. (A) Colocalization of WT and R2834H DP-GFP SCC9 stable cell lines with keratin, assessed by immunofluorescence. Bars, 10 µm. (A′) Pearson’s correlation coefficients were calculated for DP and keratin where R2834H exhibits increased colocalization ∼2.5-fold compared with WT. *, P < 0.001. Error bars indicate SEM. (B) R2834H DP weakens intercellular adhesion compared with WT DP, assessed by dispase assay. Confluent cell monolayers were lifted with dispase enzyme and subjected to mechanical stress. (B′) Quantification of the number of total particles in each well between each condition was compared (t test; *, P < 0.001 and P < 0.005, respectively) from three independent experiments in which each condition was tested in triplicate. Error bars indicate SEM. (C) FRAP for WT (32% recovery after 11 min) and R2834H (29% recovery after 11 min) DP-GFP in stable lines. The bleach point is indicated as time 0. Images were taken at regular intervals (0.5–10 s) to monitor recovery. Representative series of FRAP regions depicted here. Bars, 1 µm. (C′) FRAP quantification. The means of the relative fluorescence intensities are plotted as functions of time for WT and R2834H DP-GFP from 0–11 min (n = 5 FRAP regions imaged of each condition from three independent experiments). (D and D′) WT and R2834H DP cells, fixed at 0, 0.5, and 2.5 h after being incubated in high calcium media, assessed by immunofluorescence. Bars, 10 µm. *, P < 0.001. Error bars indicate SEM. (E) Monolayers of SCC9 cells stably expressing WT, R2834H, or S2849G DP-GFP were subjected to scratch wounding and imaged. Shown are still frames from Videos 4–6. White arrows mark the forming borders. Red arrow in the R2834H DP image denotes filamentous alignment of DP, further highlighted in Video 5. Bars, 10 µm. (E′) Quantification of fluorescence intensities of DP-GFP expressing cell borders imaged under the same conditions. Fluorescent intensities over time were calculated for representative borders from Videos 4–6 and correspond to borders shown in E. Results are representative of data obtained from >30 videos for each condition. (F and F′) Phosphorylation (red arrow) of R2834H and WT DP S-tag (DP CT), assessed by immunoblotting. Densitometry quantification of three independent experiments. *, P < 0.001. Error bars indicate SEM. (G) WT, S2849G, and R2834H DP S-tag (DP CT) were compared by analyzing band shifts (red arrow denotes 36 kD), assessed by phos-tag gel immunoblotting.
Figure 5.
Figure 5.
Arginine methylation contributes to the regulatory roles of the DP C-tail. (A) Cartoon of DP arginine methylation (purple) and phosphosites (blue) identified. (B) DMSO-, MTA-, or AMI-1–treated SCC9s, assessed by immunofluorescence. (C) DMSO- or MTA-treated SCC9s, fixed at 0, 0.5, and 2.5 h in high calcium media, were assessed by immunofluorescence. (C′) Mean fluorescence intensity of DP at cell borders was calculated. *, P < 0.001. Error bars SEM. (D and D′) shCtr and shPRMT-1–treated SCC9s. PRMT expression was assessed by immunoblotting. Densitometry quantification of three independent experiments. *, P < 0.001. Error bars indicate SEM. (E) shCtr and shPRMT-1–transfected SCC9s stained with DP (NW6) and keratin antibodies, assessed by immunofluorescence. (F and F′) Phosphorylation (red arrow) of WT DP S-tag (DP CT) expressing cells transfected with shCtr or shPRMT-1 was assessed by immunoblotting. Densitometry quantification of three independent experiments. *, P < 0.001. Error bars indicate SEM. (G) S-tag pull-down confirms that PRMT-1 associates with WT DP S-tag (DP CT), assessed by immunoblotting. (H) SCC9s incubated with primary antibody pairs DP (1G4)-PRMT-1, DP-RIgG, or PRMT-1-MIgG antibodies, assessed by PLA. Nuclei stained with DAPI (blue). Bars, 10 µm. (H′) Quantification of PLA signal divided by number of nuclei performed from three independent experiments. *, P < 0.03. Error bars indicate SEM.
Figure 6.
Figure 6.
AC mutation alters DP phosphorylation by GSK3. (A) GSK3 interactions with R2834H and WT DP S-tag (DP CT) in HEK 293 cells were examined following S-tag pulldown analyses where RIPA lysates (input) and pull-down products were analyzed by immunoblotting. (A′) Densitometry quantification of GSK3 interactions with WT and R2834H DP S-tag (DP CT). *, P < 0.03. Error bars indicate SEM. (B) PLA of WT, R2834H, or S2849G DP-GFP cells incubated with primary antibody pairs of GFP-GSK3. Nuclei were stained with DAPI (blue). (B′) PLA fluorescence intensity divided by number of nuclei was performed for each cell line using primary antibody pairs of GFP-GSK3 and with controls GSK3-RIgG or GFP-MIgG. Data quantification was analyzed from three separate experiments (>500 nuclei per experiment). *, P < 0.05. Error bars indicate SEM. (C) Control or caGSK3-transfected and LiCl- or Ly-294,002 (GSK3 Act.)–treated DP-GFP cell lines, assessed by immunofluorescence. Bars, 10 µm. (D and D′) R2834H DP S-tag (DP CT) cells were treated with NaCl or LiCl or transfected with caGSK3, assessed by immunoblotting. Densitometry quantification of three independent experiments. *, P < 0.001. Error bars indicate SEM.
Figure 7.
Figure 7.
GSK3 phosphorylation of DP altered in R2834H DP mice. (A) Transgenic mouse hearts were lysed in urea sample buffer and phosphorylation of WT and R2834H DP-Flag were analyzed by immunoblotting using DP phospho-specific and GSK3 substrate phospho-specific antibodies. Total levels of DP expression were assessed using anti-DP (NW6) and Flag. Tubulin was used as a loading control. (A′) Densitometry quantification indicates that although total levels of DP expression are similar, phosphorylation of R2834H DP was dramatically decreased compared with WT DP using both the DP-specific phospho-antibody and a GSK3 substrate-specific phospho-antibody. The data shown are from a single representative experiment out of three repeats (n = 3). Error bars represent SEM. *, P < 0.001. (B) R2834H DP-trangenic mice demonstrate altered cytoplasmic localization of DP and disruption of cell–cell contacts in cardiac tissues, assessed by confocal immunofluorescence. WT and R2834H DP cardiac sections were stained with anti-Flag and anti-desmin antibodies. (C) PLA analyses were performed with WT and R2834H DP cardiac sections incubated with primary antibody pairs DP (NW6)-GSK3, DP (NW6)-MIgG, or GSK3-RIgG. Colocalization allows for hybridization, ligation, and amplification of oligonucleotide adducts fused to secondary antibodies, ultimately producing a fluorescent spot (red) in situ. Blue DAPI staining marks nuclei. Bars, 10 µm. (C′) For the quantification of PLA, PLA spots were counted and divided by total number of nuclei in a frame. Quantification shows a statistically significant enhancement of signal for the DP-GSK3 antibody pairing in WT hearts compared with R2834H transgenic mouse hearts. *, P < 0.03; **, P < 0.001; from >500 cells counted from four independent experiments. Error bars indicate SEM.

References

    1. Agullo-Pascual E., Cerrone M., and Delmar M.. 2014. Arrhythmogenic cardiomyopathy and Brugada syndrome: diseases of the connexome. FEBS Lett. 588:1322–1330 10.1016/j.febslet.2014.02.008 - DOI - PMC - PubMed
    1. Angst B.D., Nilles L.A., and Green K.J.. 1990. Desmoplakin II expression is not restricted to stratified epithelia. J. Cell Sci. 97:247–257. - PubMed
    1. Asimaki A., and Saffitz J.E.. 2014. Remodeling of cell-cell junctions in arrhythmogenic cardiomyopathy. Cell Commun. Adhes. 21:13–23 10.3109/15419061.2013.876016 - DOI - PMC - PubMed
    1. Bass-Zubek A.E., Hobbs R.P., Amargo E.V., Garcia N.J., Hsieh S.N., Chen X., Wahl J.K. III, Denning M.F., and Green K.J.. 2008. Plakophilin 2: a critical scaffold for PKCα that regulates intercellular junction assembly. J. Cell Biol. 181:605–613 10.1083/jcb.200712133 - DOI - PMC - PubMed
    1. Beausoleil S.A., Jedrychowski M., Schwartz D., Elias J.E., Villén J., Li J., Cohn M.A., Cantley L.C., and Gygi S.P.. 2004. Large-scale characterization of HeLa cell nuclear phosphoproteins. Proc. Natl. Acad. Sci. USA. 101:12130–12135 10.1073/pnas.0404720101 - DOI - PMC - PubMed

Publication types

MeSH terms