. 2015 Mar 17;112(11):3439-44.
doi: 10.1073/pnas.1418652112. Epub 2015 Mar 2.

Evidence for recent, population-specific evolution of the human mutation rate

Affiliations

Evidence for recent, population-specific evolution of the human mutation rate

Kelley Harris. Proc Natl Acad Sci U S A. .

Abstract

As humans dispersed out of Africa they adapted to new environmental challenges, including changes in exposure to mutagenic solar radiation. Humans in temperate latitudes have acquired light skin that is relatively transparent to UV light, and some evidence suggests that their DNA damage response pathways have also experienced local adaptation. This raises the possibility that different populations have experienced different selective pressures affecting genome integrity. Here, I present evidence that the rate of a particular mutation type has recently increased in the European population, rising in frequency by 50% during the 40,000-80,000 y since Europeans began diverging from Asians. A comparison of SNPs private to Africa, Asia, and Europe in the 1000 Genomes data reveals that private European variation is enriched for the transition 5'-TCC-3' → 5'-TTC-3'. Although it is not clear whether UV played a causal role in changing the European mutational spectrum, 5'-TCC-3' → 5'-TTC-3' is known to be the most common somatic mutation present in melanoma skin cancers, as well as the mutation most frequently induced in vitro by UV. Regardless of its causality, this change indicates that DNA replication fidelity has not remained stable even since the origin of modern humans and might have changed numerous times during our recent evolutionary history.

Keywords: UV damage; genetic variation; human evolution; molecular clock; mutation rate.


Conflict of interest statement

The author declares no conflict of interest.

Figures
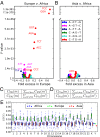
Fig. 1.
Fig. 1.
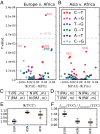
Overrepresentation of 5′-TCC-3′5′-TTC-3′ within Europe. (A and B) The x coordinate of each point in gives the fold frequency difference (fPE(m)fPAf(m))/fPAf(m) [respectively (fPAs(m)fPAf(m))/fPAf(m)], and the y coordinate gives the Pearson’s χ2 P value of its significance. Outlier points are labeled with the ancestral state of the mutant nucleotide flanked by two neighboring bases, and the color of the point specifies the ancestral and derived alleles of the mutant site. (C and D) The χ2 contingency tables used to compute the respective P values in A and B. (E) The distribution of f(TCC) across bins of 1,000 consecutive population-private SNPs. Only chromosome-wide frequencies are shown for chromosome Y because of its low SNP count.
Fig. 2.
Fig. 2.
Variation of f(TCC) within and between populations. This plot shows the distribution of f(TCC) within each 1000 Genomes population (i.e., the proportion of all derived variants from PA, PE, and PAf present in a particular genome that are TCCT mutations). There is a clear division between the low f(TCC) values of African and Asian genomes and the high f(TCC) values of European genomes. The slightly admixed African Americans and more strongly admixed Latin American populations have intermediate f(TCC) values reflecting partial European ancestry.
Fig. 3.
Fig. 3.
Differences in transcriptional strand bias. Each point in A and B represents a mutation type with an A or C ancestral allele. The x coordinate of each point in A is the PAf strand bias minus the PE strand bias; similarly, the x coordinates in B describe the PAf strand bias minus the PAs strand bias. The y coordinate of each point is the χ2 P value of the strand bias difference. The P values in A and B were computed from contingency tables C and D, respectively, using a χ2 test. At the P=0.01 significance level (gray dashed line), only TCCT has a significant strand bias difference between Europe and Africa, whereas no mutation type significantly differs in strand bias between Asia and Africa. E shows the variance of strand bias in each population across 100 bootstrap replicates. Similarly, F shows the distribution across bootstrap replicates of the ratio between genic f(TCC) and intergenic f(TCC).

References

    1. Cann RL, Stoneking M, Wilson AC. Mitochondrial DNA and human evolution. Nature. 1987;325(6099):31–36. - PubMed
    1. Loomis WF. Skin-pigment regulation of vitamin-D biosynthesis in man. Science. 1967;157(3788):501–506. - PubMed
    1. Jablonski NG, Chaplin G. The evolution of human skin coloration. J Hum Evol. 2000;39(1):57–106. - PubMed
    1. Jablonski NG, Chaplin G. Colloquium paper: Human skin pigmentation as an adaptation to UV radiation. Proc Natl Acad Sci USA. 2010;107(Suppl 2):8962–8968. - PMC - PubMed
    1. Pritchard JK, Pickrell JK, Coop G. The genetics of human adaptation: Hard sweeps, soft sweeps, and polygenic adaptation. Curr Biol. 2010;20(4):R208–R215. - PMC - PubMed

Publication types

LinkOut - more resources