. 2015 Mar 31;112(13):3931-6.
doi: 10.1073/pnas.1422385112. Epub 2015 Mar 2.

Anthropogenic warming has increased drought risk in California

Affiliations

Anthropogenic warming has increased drought risk in California

Noah S Diffenbaugh et al. Proc Natl Acad Sci U S A. .

Abstract

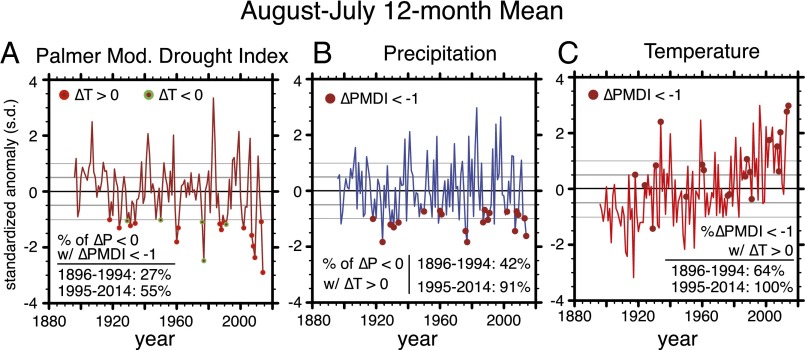
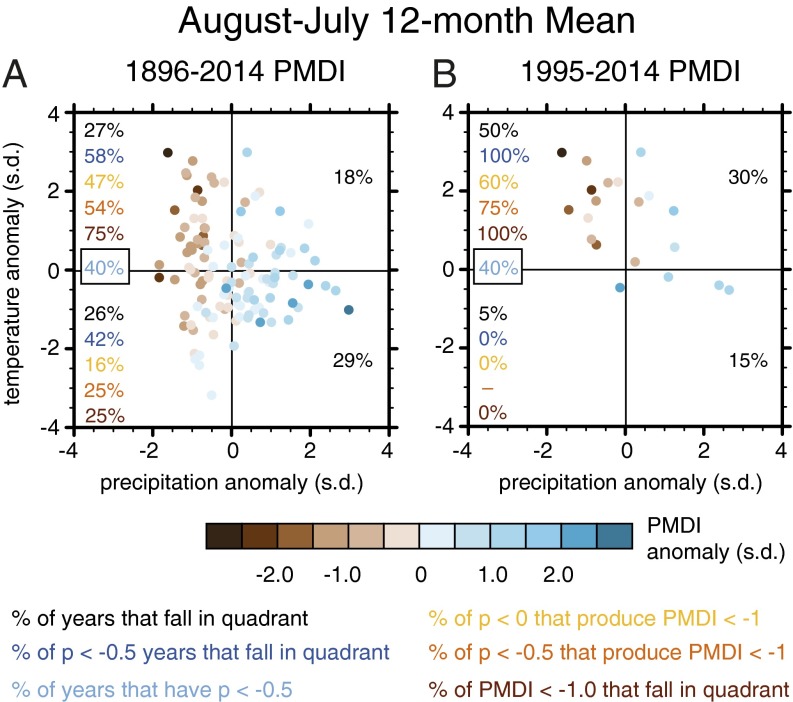
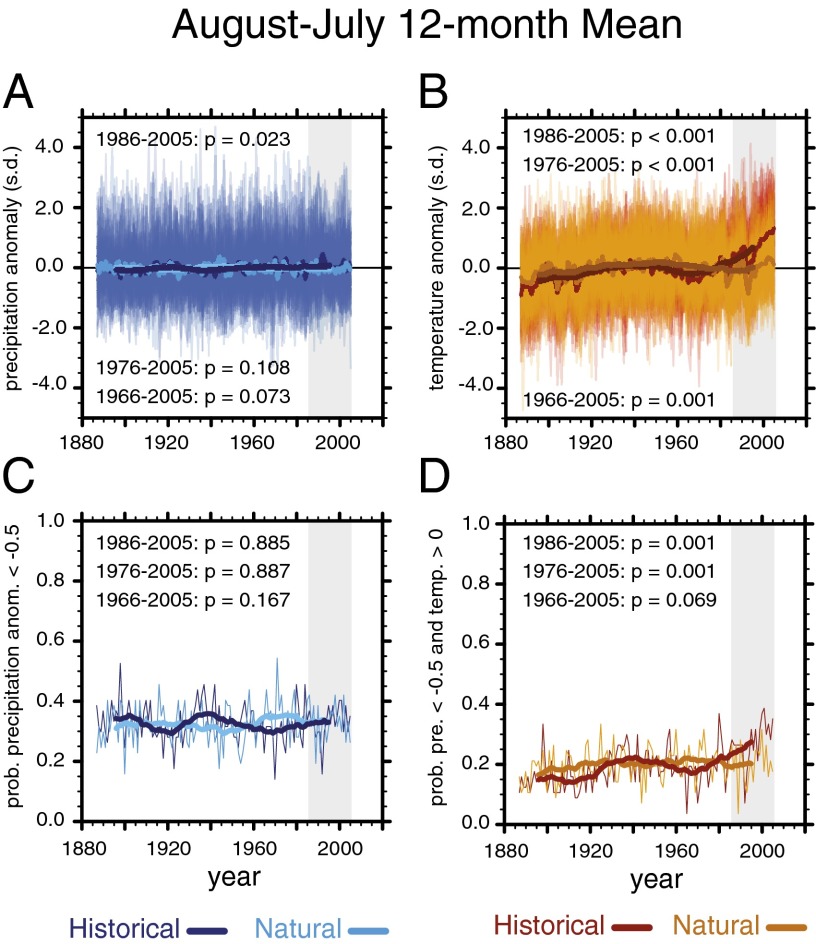
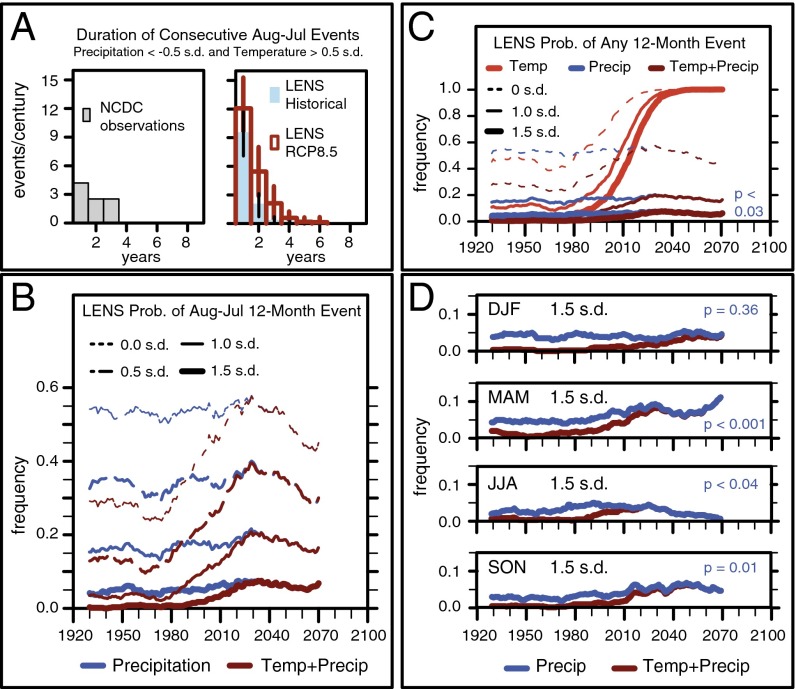
California is currently in the midst of a record-setting drought. The drought began in 2012 and now includes the lowest calendar-year and 12-mo precipitation, the highest annual temperature, and the most extreme drought indicators on record. The extremely warm and dry conditions have led to acute water shortages, groundwater overdraft, critically low streamflow, and enhanced wildfire risk. Analyzing historical climate observations from California, we find that precipitation deficits in California were more than twice as likely to yield drought years if they occurred when conditions were warm. We find that although there has not been a substantial change in the probability of either negative or moderately negative precipitation anomalies in recent decades, the occurrence of drought years has been greater in the past two decades than in the preceding century. In addition, the probability that precipitation deficits co-occur with warm conditions and the probability that precipitation deficits produce drought have both increased. Climate model experiments with and without anthropogenic forcings reveal that human activities have increased the probability that dry precipitation years are also warm. Further, a large ensemble of climate model realizations reveals that additional global warming over the next few decades is very likely to create ∼ 100% probability that any annual-scale dry period is also extremely warm. We therefore conclude that anthropogenic warming is increasing the probability of co-occurring warm-dry conditions like those that have created the acute human and ecosystem impacts associated with the "exceptional" 2012-2014 drought in California.

Keywords: CMIP5; climate change detection; climate extremes; drought; event attribution.


Conflict of interest statement

The authors declare no conflict of interest.

Figures

Fig. 1.
Fig. 1.
Historical time series of drought (A), precipitation (B), and temperature (C) in California. Values are calculated for the August–July 12-mo mean in each year of the observed record, beginning in August 1895. In each year, the standardized anomaly is expressed as the magnitude of the anomaly from the long-term annual mean, divided by the SD of the detrended historical annual anomaly time series. The PMDI is used as the primary drought indicator, although the other Palmer indicators exhibit similar historical time series (Figs. S1 and S2). Circles show the years in which the PMDI exhibited a negative anomaly exceeding –1.0 SDs, which are referred to as 1-SD drought years in the text.
Fig. 2.
Fig. 2.
Historical occurrence of drought, precipitation, and temperature in California. Standardized anomalies are shown for each August–July 12-mo period in the historical record (calculated as in Fig. 1). Anomalies are shown for the full historical record (A) and for the most recent two decades (B). Percentage values show the percentage of years meeting different precipitation and drought criteria that fall in each quadrant of the temperature–precipitation space. The respective criteria are identified by different colors of text.
Fig. 3.
Fig. 3.
Influence of anthropogenic forcing on the probability of warm–dry years in California. Temperature and precipitation values are calculated for the August–July 12-mo mean in each year of the CMIP5 Historical and Natural forcing experiments (Materials and Methods). The Top panels (A and B) show the time series of ensemble–mean standardized temperature and precipitation anomalies. The Bottom panels (C and D) show the unconditional probability (across the ensemble) that the annual precipitation anomaly is less than –0.5 SDs, and the conditional probability that both the annual precipitation anomaly is less than –0.5 SDs and the temperature anomaly is greater than 0. The bold curves show the 20-y running mean of each annual time series. The CMIP5 Historical and Natural forcing experiments were run until the year 2005. P values are shown for the difference between the Historical and Natural experiments for the most recent 20-y (1986–2005; gray band), 30-y (1976–2005), and 40-y (1966–2005) periods of the CMIP5 protocol. P values are calculated using the block bootstrap resampling approach of ref. (Materials and Methods).
Fig. 4.
Fig. 4.
Projected changes in the probability of co-occurring warm–dry conditions in the 21st century. (A) Histogram of the frequency of occurrence of consecutive August–July 12-mo periods in which the 12-mo precipitation anomaly is less than –0.5 SDs and the 12-mo temperature anomaly is at least 0.5 SDs, in historical observations and the LENS large ensemble experiment. (B) The probability that a negative 12-mo precipitation anomaly and a positive 12-mo temperature anomaly equal to or exceeding a given magnitude occur in the same August–July 12-mo period, for varying severity of anomalies. (C) The probability that a negative precipitation anomaly and a positive temperature anomaly equal to or exceeding a given magnitude occur in the same 12-mo period, for all possible 12-mo periods (using a 12-mo running mean; see Materials and Methods), for varying severity of anomalies. (D) The unconditional probability of a –1.5 SD seasonal precipitation anomaly (blue curve) and the conditional probability that a –1.5 SD seasonal precipitation anomaly occurs in conjunction with a 1.5 SD seasonal temperature anomaly (red curve), for each of the four 3-mo seasons. Time series show the 20-y running mean of each annual time series. P values are shown for the difference in occurrence of –1.5 SD precipitation anomalies between the Historical period (1920–2005) and the RCP8.5 period (2006–2080).

Comment in

References

    1. US Census Bureau State and County QuickFacts. 2014 Available at quickfacts.census.gov/qfd/states/06000.html.
    1. US Bureau of Economic Analysis Bureau of Economic Analysis Interactive Data. 2014 Available at www.bea.gov/
    1. US Department of Agriculture CALIFORNIA Agricultural Statistics 2012 Crop Year. 2013 Available at www.nass.usda.gov/Statistics_by_State/California/Publications/California....
    1. Myers N, Mittermeier RA, Mittermeier CG, da Fonseca GAB, Kent J. Biodiversity hotspots for conservation priorities. Nature. 2000;403(6772):853–858. - PubMed
    1. Hanak E, et al. Managing California’s Water: From Conflict to Reconciliation. Public Policy Institute of California; San Francisco: 2011.

Publication types

LinkOut - more resources