. 2015 Mar 17;112(11):E1363-72.
doi: 10.1073/pnas.1419845112. Epub 2015 Mar 2.

Activation of TRPM3 by a potent synthetic ligand reveals a role in peptide release

Affiliations

Activation of TRPM3 by a potent synthetic ligand reveals a role in peptide release

Katharina Held et al. Proc Natl Acad Sci U S A. .

Abstract

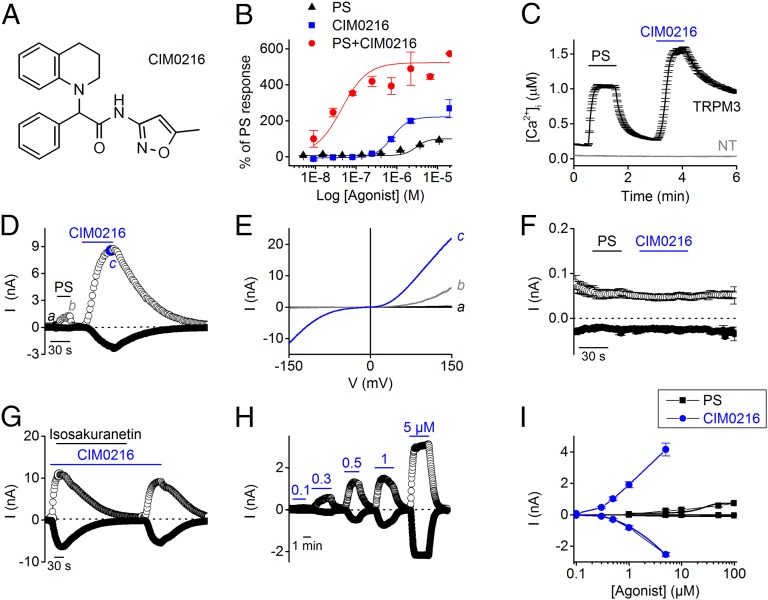
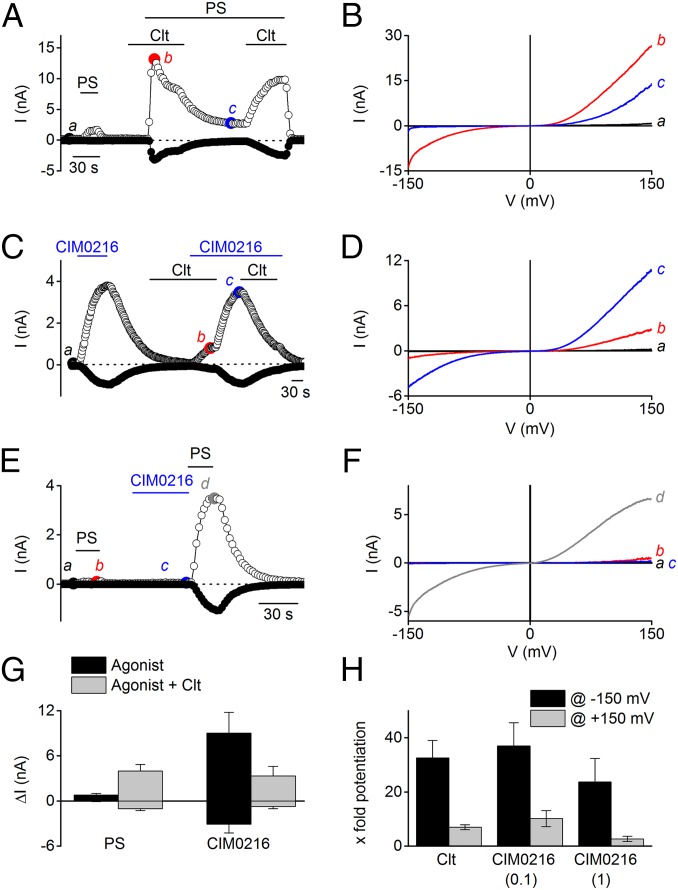
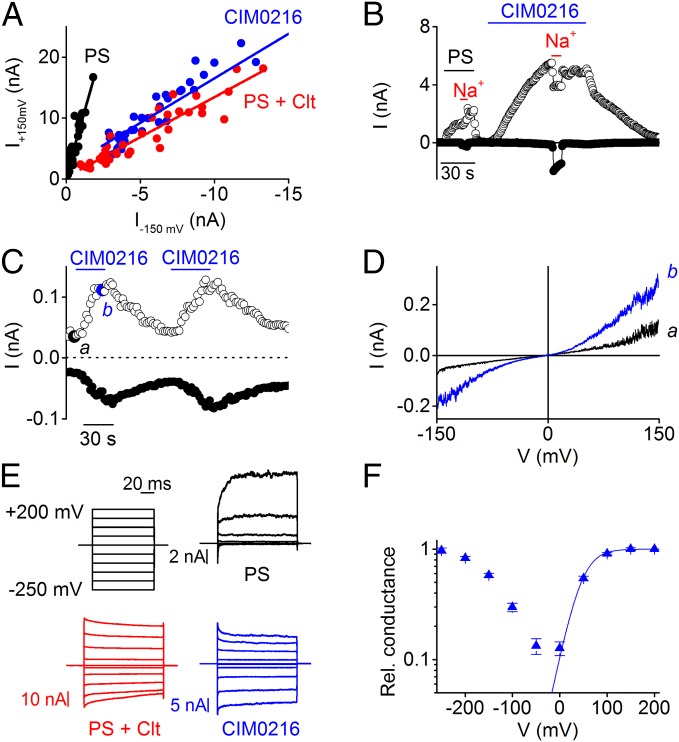
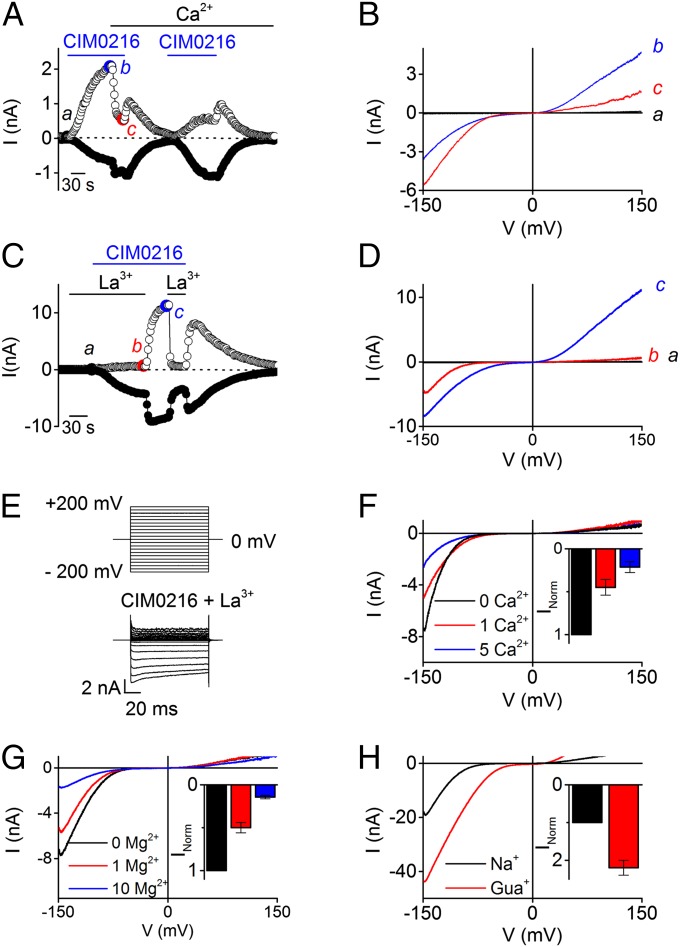
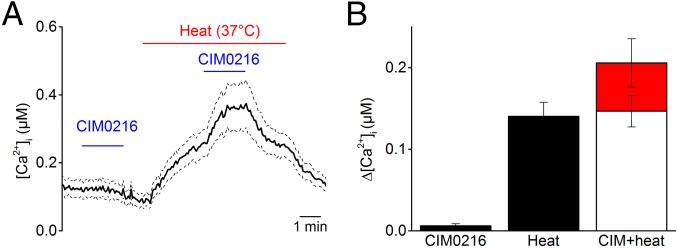
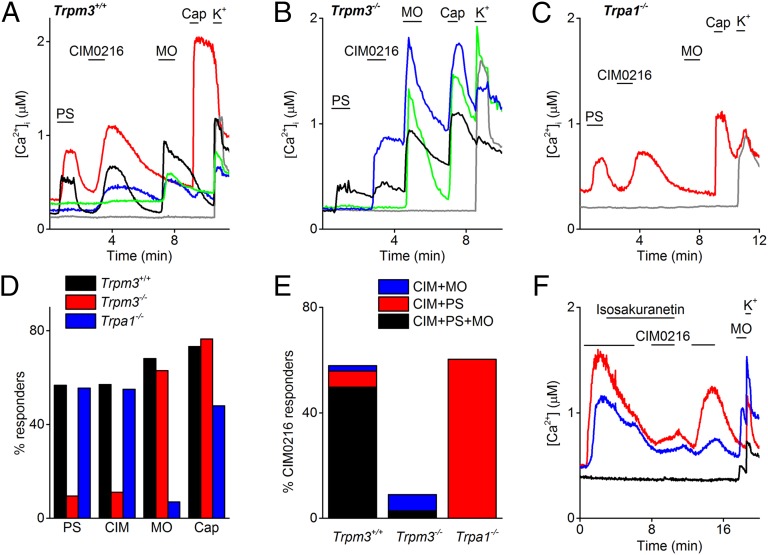
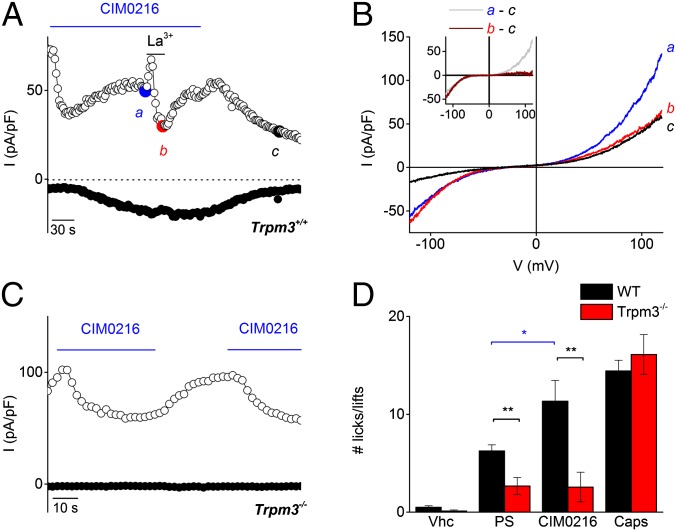
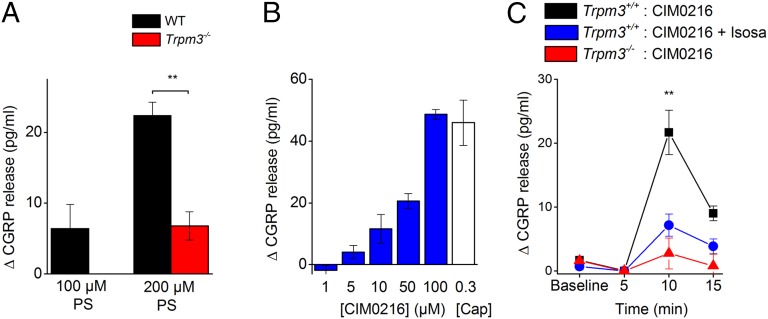
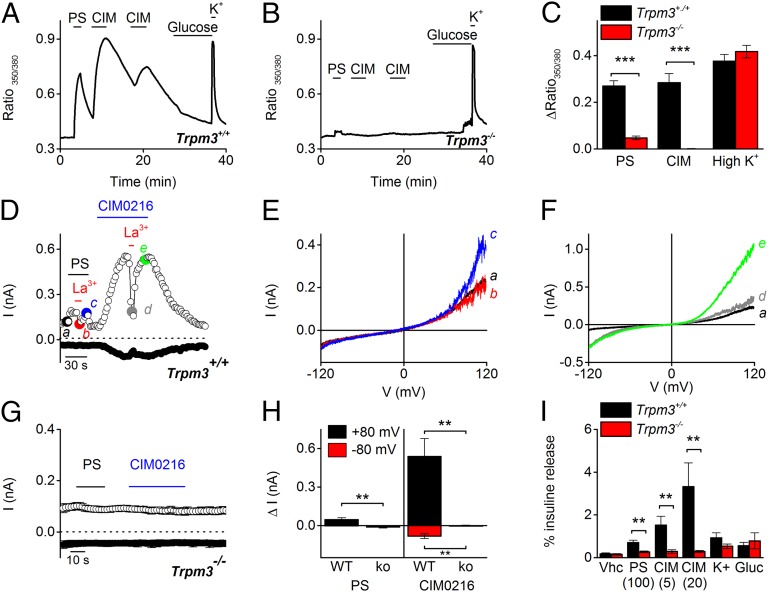
Transient receptor potential (TRP) cation channel subfamily M member 3 (TRPM3), a member of the TRP channel superfamily, was recently identified as a nociceptor channel in the somatosensory system, where it is involved in the detection of noxious heat; however, owing to the lack of potent and selective agonists, little is known about other potential physiological consequences of the opening of TRPM3. Here we identify and characterize a synthetic TRPM3 activator, CIM0216, whose potency and apparent affinity greatly exceeds that of the canonical TRPM3 agonist, pregnenolone sulfate (PS). In particular, a single application of CIM0216 causes opening of both the central calcium-conducting pore and the alternative cation permeation pathway in a membrane-delimited manner. CIM0216 evoked robust calcium influx in TRPM3-expressing somatosensory neurons, and intradermal injection of the compound induced a TRPM3-dependent nocifensive behavior. Moreover, CIM0216 elicited the release of the peptides calcitonin gene-related peptide (CGRP) from sensory nerve terminals and insulin from isolated pancreatic islets in a TRPM3-dependent manner. These experiments identify CIM0216 as a powerful tool for use in investigating the physiological roles of TRPM3, and indicate that TRPM3 activation in sensory nerve endings can contribute to neurogenic inflammation.

Keywords: TRP channel; TRPM3; nociceptor; peptide release.


Conflict of interest statement

The authors declare no conflict of interest.

Figures

Fig. 1.
Fig. 1.
CIM0216 activates TRPM3 in HEK-TRPM3 cells. (A) Chemical structure of CIM0216. (B) [Ca2+]I was monitored using Fluo-4 AM in HEK-TRPM3 cells before and after the addition of different concentrations of PS (black), CIM0216 (blue), and PS plus CIM0216 (red). Responses were measured as peak increases in fluorescence minus basal, expressed relative to a maximum PS response, and are given as mean ± SEM. n = 2. (C) Time course of Ca2+ imaging measurements in HEK293 cells stably expressing TRPM3 (HEK-TRPM3 cells) and nontransfected (NT) HEK293 cells during application of PS (40 µM) and CIM0216 (1 µM). (D) Time course at ±80 mV of a whole-cell patch-clamp recording on HEK-TRPM3 cells treated with PS (40 µM) and CIM0216 (1 µM), (E) I–V traces corresponding to the time points indicated in D. (F) Time course at ±80 mV of a whole-cell patch-clamp recording showing the application of PS and CIM0216 on nontransfected HEK293 cells. Mean ± SEM values are shown; n = 5. (G) Time course at ±80 mV of whole-cell patch-clamp measurement on HEK-TRPM3 cells presenting the block of CIM0216-induced currents by isosakuranetin (5 µM). (H) Time course at ±80 mV of a patch-clamp recording in whole-cell configuration showing CIM0216 dose-dependent activation of TRPM3 currents in HEK-TRPM3 cells. (I) Dose–response curves of CIM0216 (blue) and PS (black) in HEK-TRPM3. n = 5. Unless indicated otherwise, standard compound concentrations were 40 µM for PS and 1 µM for CIM0216.
Fig. 2.
Fig. 2.
CIM0216s modulation of PS-induced TRPM3 currents shows high similarity to the Clt-induced effects. (A) Time course at ±80 mV of a whole-cell patch-clamp recording showing the effect of Clt (10 µM) on PS (40 µM)-induced HEK-TRPM3 cells. (B) I–V relationship corresponding to the time points indicated in A. (C) Time course at ±80 mV of a whole-cell patch- clamp recording showing the effect of Clt (10 µM) on CIM0216 (1 µM) stimulation in HEK-TRPM3–expressing cells. (D) I–V relationship corresponding to the time points indicated in C. (E) Time course at ±80 mV of whole-cell patch-clamp measurement on HEK-TRPM3 cells after stimulation by PS (40 µM) and CIM0216 (0.1 µM) plus PS (40 µM). (F) I–V relationship corresponding to the time points indicated in E. (G) Mean current increase at +80 mV and −80 mV in HEK-TRPM3 cells after stimulation by PS (40 µM) and CIM0216 (1 µM) in the absence (black bar) and presence (gray bar) of Clt (10 µM). n = 5. (H) Relative potentiation of the PS-induced currents after incubation by Clt (10 µM) and CIM0216 (0.1 and 1 µM) of the inward (−150 mV; black bars) and outward (+150 mV; gray bars) currents. n = 4.
Fig. 3.
Fig. 3.
CIM0216-induced TRPM3 currents show high similarity to PS + Clt-induced TRPM3 currents. (A) Rectification pattern of PS, PS + Clt, and CIM0216-induced TRPM3 currents in HEK-TRPM3 cells, derived by plotting the currents at +150 mV against the currents at −150 mV. (B) Time course at ±80 mV of a whole-cell patch-clamp recording on HEK-TRPM3 cells. At the indicated time points, all Na+ was replaced by NMDG+. (C) Time course at ±80 mV of a patch- clamp recording performed in the inside-out configuration on HEK-TRPM3 cells during application of CIM0216 (1 μM). (D) I–V traces corresponding to indicated time points in C. (E) Current traces obtained with a step protocol in HEK-TRPM3 cells after stimulation by PS (black; 40 µM), PS (40 µM) + Clt (10 µM; red), and CIM0216 (1 µM; blue). (F) G–V plot for CIM0216. The fit was obtained with a Boltzmann function (n = 6).
Fig. 4.
Fig. 4.
Desensitization and permeation properties of the alternative ion permeation pathway. (A) Time course at ±80 mV of a whole-cell patch-clamp recording on HEK-TRPM3 cells during application of CIM0216 (1 µM). At the indicated time points, the extracellular bath concentration was replaced by a solution containing 1 mM [Ca2+]ex. (B) I–V relationship at the time points indicated in A. (C) Time course of a whole-cell patch-clamp recording on HEK-TRPM3 cells at ±150 mV showing CIM0216-induced currents in the presence and absence of the pore blocker La3+. (D) I–V traces corresponding to the indicated time points in C. (E) Current traces obtained with an indicated step protocol from +200 to −200 mV in +20-mV steps under the condition of costimulation with CIM0216 and La3+. (F and G) I–V traces obtained during simultaneous application of CIM0216 and La3+ in the presence of different concentrations of Ca2+ (F) or Mg2+ (G). (Insets) Mean current normalized to the maximum Na+ current in the absence of Ca2+ (F) or Mg2+ (G). n ≥5. (H) I–V traces obtained during simultaneous application of CIM0216 and La3+ in the presence of Na+ and guanidinium (Gua+). Unless indicated otherwise, standard compound concentrations were 40 µM for PS, 100 µM for La3+, and 1 µM for CIM0216.
Fig. 5.
Fig. 5.
Synergistic effects of heat and CIM0216 on TRPM3. (A) Typical examples of the intracellular calcium increase induced by low doses of CIM0216 (0.1 µM) applied at room temperature (22 °C) and 37 °C in HEK-TRPM3 cells. (B) Bar diagram showing average Ca2+ increases in response to CIM0216 (0.1 µM), heat stimulus (37 °C), and CIM0216 (0.1 µM) at 37 °C. The open bar illustrates the calculated summation of CIM0216 and heat response. The red bar shows the measured value of combined application of heat and CIM0216, illustrating the supra-additive effect of heat on CIM0216 stimulation. n > 42 cells from at least three independent measurements. Data are presented as mean ± SEM.
Fig. 6.
Fig. 6.
Reduced CIM0216 responses in TRPM3-deficient sensory neurons. (AC) Representative traces showing typical patterns of intracellular Ca2+ in DRG and TGN from control animals Trpm3+/+ (A), Trpm3−/− (B), and Trpa1−/− (C) mice in response to PS (20 µM), CIM0216 (1 µM), MO (100 µM), capsaicin (Cap; 1 µM), and K+ (50 mM). (D) Percentage of sensory neurons derived from TRPM3+/+, TRPM3−/−, and TRPA1−/− mice responding to stimulation by PS (20 µM), CIM0216 (1 µM), MO (100 µM), and capsaicin (1 µM). (E) Percentage of sensory neurons responding to CIM0216 in preparations from TRPM3+/+, TRPM3−/−, and TRPA1−/− mice. Different colors correspond to the different subtypes of CIM0216 responders based on PS and MO sensitivity. (F) Representative traces showing typical response patterns of intracellular Ca2+ in DRG and TGN from control animals in response to CIM0216 (1 µM), MO, and high K+. At the indicated time bar, the TRPM3 blocker isosakuranetin (5 µM) was added.
Fig. 7.
Fig. 7.
Neuronal and nocifensive responses to CIM0216. (A) Amplitude of currents at ±80 mV of a patch-clamp recording in whole-cell configuration during application of CIM0216 (1 µM) and La3+ (100 µM) in a TRPM3+/+ TGN. (B) I–V relationship of the CIM0216-induced current at time points as indicated in A. (Inset) CIM0216-induced current increase in the presence and absence of La3+, obtained as the difference between two traces in B. (C) Amplitude of currents at ±80 mV of a patch-clamp recording in whole-cell configuration during application of CIM0216 (1 µM) in a TRPM3−/− TGN. (D) Total number of behavioral responses (paw licks and lifts within 2 min) in response to intraplantar injection of vehicle (vhc; 0.5% DMSO), PS (15 nmol/paw), CIM0216 (2.5 nmol/paw), or capsaicin (Caps; 0.5 nmol/paw) in WT mice (black bars) and TRPM3−/− mice (red bars). n = 9 animals for each genotype. Data are presented as mean ± SEM. The black line represents the unpaired t test; the blue bar, the paired t test. *P < 0.05; **P < 0.01.
Fig. 8.
Fig. 8.
TRPM3 agonists release CGRP from skin nerve terminals. (A) PS increased the outflow of CGRP from skin preparations in a concentration-dependent manner. No significant increase of CGRP release was detected in TRPM3−/− tissue. Asterisks refer to P < 0.01 between genotypes (n = 10 vs. 7, ANOVA and LSD statistical tests). (B) CGRP release from WT skin during a 5-min incubation with CIM0216 at different concentrations (1, 5, 10, 50, and 100 µM) and capsaicin (0.3 µM) for comparison. (C) CGRP release during consecutive 5-min periods (5 min baseline, next 5 min, etc.). CIM0216 (50 µM) was applied during the period tagged 5–10 min to hind paw skin derived from WT mice (black; n = 7) and Trpm3-deficient mice (red; n = 4). In the presence of the TRPM3 blocker isosakuranetin (5 µM), no significant CIM0216-induced CGRP release was observed in WT skin (blue). n = 7; same animals as above. *P < 0.01 between the WT groups, ANOVA and Fisher’s least significant differences test.
Fig. 9.
Fig. 9.
CIM0216 induces TRPM3-dependent calcium and current increases and enhances insulin release from pancreatic islets. (A and B) Effect of CIM0216 on intracellular [Ca2+] in islets derived from WT mice (A) and Trpm3−/− mice (B). The islets were bathed in a solution containing 3 mM glucose. PS (40 µM)-, CIM0216 (1 µM)-, 10 mM glucose-, and high-K+ (50 mM)-containing solutions were added at the indicated time points. (C) Average increase in fluorescence ratio (F350/F380) after stimulation with PS (40 µM), CIM0216 (1 µM), and 50 mM K+ in islets from WT and Trpm3−/− mice. n = 9 from three mice; ***P < 0.001, unpaired t test. (D) Amplitude of currents at ±80 mV of a patch-clamp recording in whole-cell configuration during application of PS (40 µM), CIM0216 (1 µM), and La3+ (100 µM) in a Trpm3+/+ isolated pancreatic islet cell. (E and F) I–V relationship of the PS-induced (E) and CIM0216-induced (F) currents at time points as indicated in D. (G) Mean currents at ±80 mV of a patch-clamp recording in whole-cell configuration during application of PS (40 µM) and CIM0216 (1 µM) in Trpm3−/− isolated pancreatic islet cells (n = 5). (H) Mean current increases at ±80 mV of a patch-clamp recording in whole-cell configuration during application of PS (40 µM) or CIM0216 (1 µM) on Trpm3+/+ and Trpm3−/− pancreatic islet cells (n ≥ 5). (I) Insulin release after a 15-min incubation with vehicle (vhc, DMSO), PS (100 µM), CIM0216 (5 µM and 20 µM), high K+ (50 mM), and glucose (Gluc; 20 mM) in WT mice (black bars) and TRPM3−/− mice (red bars). n = 4 from four independent measurements; **P < 0.01, unpaired t test.

References

    1. Voets T, Talavera K, Owsianik G, Nilius B. Sensing with TRP channels. Nat Chem Biol. 2005;1(2):85–92. - PubMed
    1. Montell C, et al. A unified nomenclature for the superfamily of TRP cation channels. Mol Cell. 2002;9(2):229–231. - PubMed
    1. Vriens J, et al. TRPM3 is a nociceptor channel involved in the detection of noxious heat. Neuron. 2011;70(3):482–494. - PubMed
    1. Wagner TF, et al. Transient receptor potential M3 channels are ionotropic steroid receptors in pancreatic beta cells. Nat Cell Biol. 2008;10(12):1421–1430. - PubMed
    1. Vriens J, et al. Opening of an alternative ion permeation pathway in a nociceptor TRP channel. Nat Chem Biol. 2014;10(3):188–195. - PubMed

Publication types

MeSH terms