. 2015 Mar 3;12(3):e1001792.
doi: 10.1371/journal.pmed.1001792. eCollection 2015 Mar.

Association between traffic-related air pollution in schools and cognitive development in primary school children: a prospective cohort study

Affiliations

Association between traffic-related air pollution in schools and cognitive development in primary school children: a prospective cohort study

Jordi Sunyer et al. PLoS Med. .

Abstract

Background: Air pollution is a suspected developmental neurotoxicant. Many schools are located in close proximity to busy roads, and traffic air pollution peaks when children are at school. We aimed to assess whether exposure of children in primary school to traffic-related air pollutants is associated with impaired cognitive development.

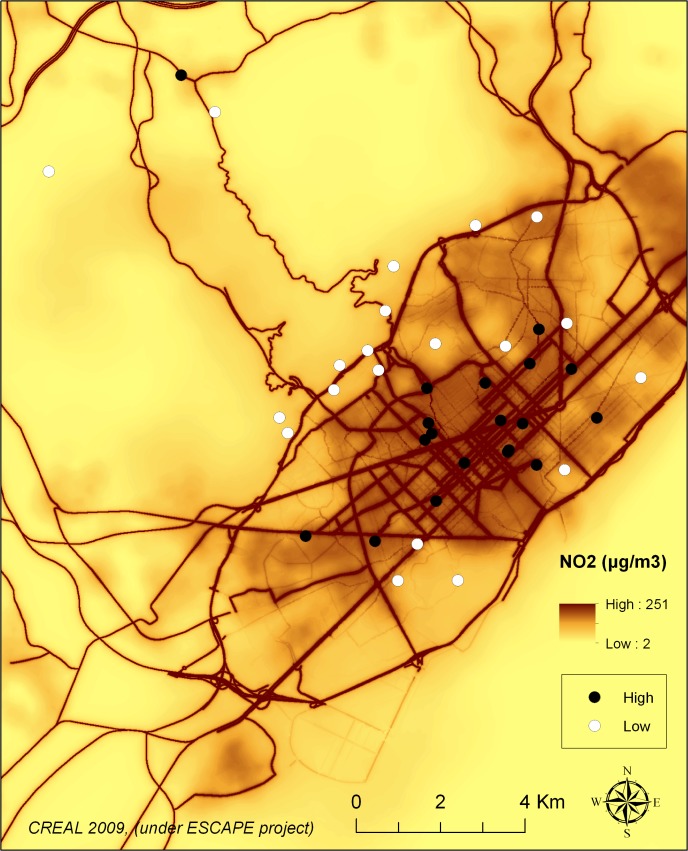
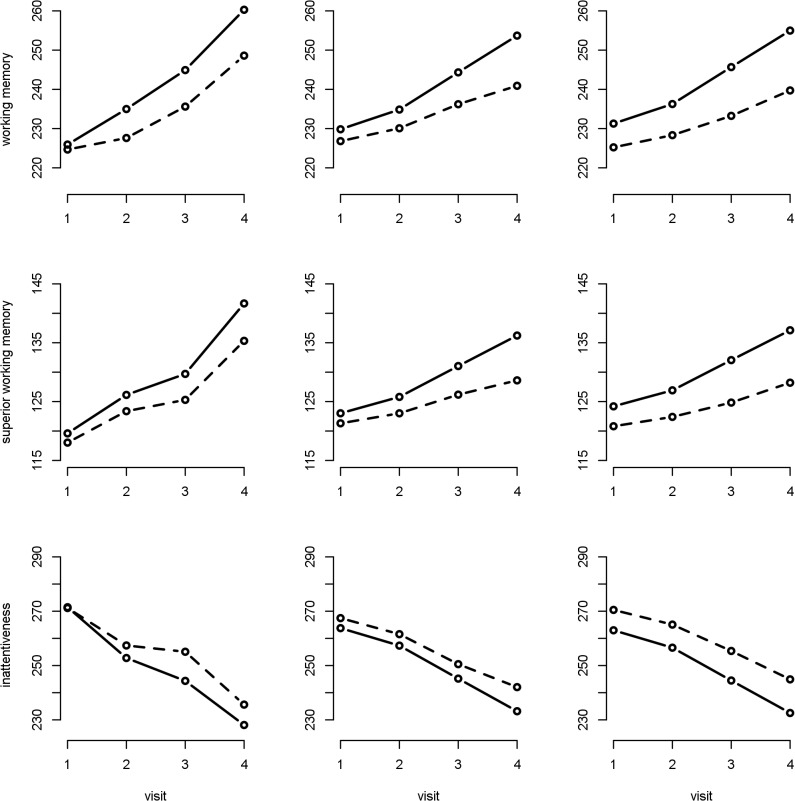
Methods and findings: We conducted a prospective study of children (n = 2,715, aged 7 to 10 y) from 39 schools in Barcelona (Catalonia, Spain) exposed to high and low traffic-related air pollution, paired by school socioeconomic index; children were tested four times (i.e., to assess the 12-mo developmental trajectories) via computerized tests (n = 10,112). Chronic traffic air pollution (elemental carbon [EC], nitrogen dioxide [NO2], and ultrafine particle number [UFP; 10-700 nm]) was measured twice during 1-wk campaigns both in the courtyard (outdoor) and inside the classroom (indoor) simultaneously in each school pair. Cognitive development was assessed with the n-back and the attentional network tests, in particular, working memory (two-back detectability), superior working memory (three-back detectability), and inattentiveness (hit reaction time standard error). Linear mixed effects models were adjusted for age, sex, maternal education, socioeconomic status, and air pollution exposure at home. Children from highly polluted schools had a smaller growth in cognitive development than children from the paired lowly polluted schools, both in crude and adjusted models (e.g., 7.4% [95% CI 5.6%-8.8%] versus 11.5% [95% CI 8.9%-12.5%] improvement in working memory, p = 0.0024). Cogently, children attending schools with higher levels of EC, NO2, and UFP both indoors and outdoors experienced substantially smaller growth in all the cognitive measurements; for example, a change from the first to the fourth quartile in indoor EC reduced the gain in working memory by 13.0% (95% CI 4.2%-23.1%). Residual confounding for social class could not be discarded completely; however, the associations remained in stratified analyses (e.g., for type of school or high-/low-polluted area) and after additional adjustments (e.g., for commuting, educational quality, or smoking at home), contradicting a potential residual confounding explanation.

Conclusions: Children attending schools with higher traffic-related air pollution had a smaller improvement in cognitive development.


Conflict of interest statement

The authors have declared that no competing interests exist.

Figures

Fig 1
Fig 1. Map of Barcelona and the schools by high or low air pollution by design.
Black dots indicate the locations of schools with high air pollution, and white dots indicate the locations of schools with low air pollution, based on NO2 levels.
Fig 2
Fig 2. Working memory development by high- or low-traffic-air-pollution school.
Dashed line = high traffic air pollution; continuous line = low traffic air pollution; gray shading indicates 95% CIs. Adjusted for age, sex, maternal education, residential neighborhood socioeconomic status, and air pollution exposure at home; school and individual as nested random effects in 2,715 children and 10,112 tests from 39 schools.
Fig 3
Fig 3. Crude and adjusted cognitive development by high- or low-air-pollution school.
Dashed line = high air pollution; continuous line = low air pollution. The first column depicts the crude values, the second the crude trajectories from a model that included individual and school as random effects, and the third a model adjusted for age, sex, maternal education, residential neighborhood socioeconomic status, and air pollution exposure at home; school and individual as nested random effects in 2,715 children and 10,112 tests from 39 schools.
Fig 4
Fig 4. Working memory development and long-term exposure to traffic-related air pollutants.
Each dot depicts a school, with size proportional to the number of children. The cognitive development per school was estimated in a model with school and individual as random effects. The slope of the red line depicts the change in cognitive development as a function of the air pollutants, adjusted for age, sex, maternal education, residential neighborhood socioeconomic status, and air pollution exposure at home; school and individual as nested random effects in 2,715 children and 10,112 tests from 39 schools. Gray shading indicates 95% CIs. out, outdoors (courtyard); in, indoors (classroom).
Fig 5
Fig 5. Superior working memory and long-term exposure to traffic-related air pollutants.
Each dot depicts a school, with size proportional to the number of children. The cognitive development per school was estimated in a model with school and individual as random effects. The slope of the red line depicts the change in cognitive development as a function of the air pollutants, adjusted for age, sex, maternal education, residential neighborhood socioeconomic status, and air pollution exposure at home; school and individual as nested random effects in 2,715 children and 10,112 tests from 39 schools. Gray shading indicates 95% CI. out, outdoors (courtyard); in, indoors (classroom).
Fig 6
Fig 6. Inattentiveness development and long-term exposure to traffic-related air pollutants.
Each dot depicts a school, with size proportional to the number of children. The cognitive development per school was estimated in a model with school and individual as random effects. The slope of the red line depicts the change in cognitive development as a function of the air pollutants, adjusted for age, sex, maternal education, residential neighborhood socioeconomic status, and air pollution exposure at home; school and individual as nested random effects in 2,715 children and 10,112 tests from 39 schools. Gray shading indicates 95% CI. out, outdoors (courtyard); in, indoors (classroom).

References

    1. Grandjean Ph, Landrigan Ph J (2014) Neurobehavioural effects of developmental toxicity. Lancet Neurol 13: 330–338. 10.1016/S1474-4422(13)70278-3 - DOI - PMC - PubMed
    1. Gerlofs-Nijland ME, van Berlo D, Cassee FR, Schins RP, Wang K, et al. (2010) Effect of prolonged exposure to diesel engine exhaust on proinflammatory markers in different regions of the rat brain. Part Fibre Toxicol 7: 12 10.1186/1743-8977-7-12 - DOI - PMC - PubMed
    1. Bos I, De Boever P, Int Panis L, Sarre S, Meeusen R (2012) Negative effects of ultrafine particle exposure during forced exercise on the expression of Brain-Derived Neurotrophic Factor in the hippocampus of rats. Neuroscience 223: 131–139. 10.1016/j.neuroscience.2012.07.057 - DOI - PubMed
    1. Yokota S, Takashima H, Ohta R, Saito Y, Miyahara T, et al. (2011) Nasal instillation of nanoparticle-rich diesel exhaust particles slightly affects emotional behavior and learning capability in rats. J Toxicol Sci 36: 267–276. - PubMed
    1. Fonken LK, Xu X, Weil ZM, Chen G, Sun Q, et al. (2011) Air pollution impairs cognition, provokes depressive-like behaviors and alters hippocampal cytokine expression and morphology. Mol Psychiatry 16: 987–995. 10.1038/mp.2011.76 - DOI - PMC - PubMed

Publication types

MeSH terms