. 2015 Mar 3;13(3):e1002082.
doi: 10.1371/journal.pbio.1002082. eCollection 2015 Mar.

Estimating the life course of influenza A(H3N2) antibody responses from cross-sectional data

Affiliations

Estimating the life course of influenza A(H3N2) antibody responses from cross-sectional data

Adam J Kucharski et al. PLoS Biol. .

Abstract

The immunity of a host population against specific influenza A strains can influence a number of important biological processes, from the emergence of new virus strains to the effectiveness of vaccination programmes. However, the development of an individual's long-lived antibody response to influenza A over the course of a lifetime remains poorly understood. Accurately describing this immunological process requires a fundamental understanding of how the mechanisms of boosting and cross-reactivity respond to repeated infections. Establishing the contribution of such mechanisms to antibody titres remains challenging because the aggregate effect of immune responses over a lifetime are rarely observed directly. To uncover the aggregate effect of multiple influenza infections, we developed a mechanistic model capturing both past infections and subsequent antibody responses. We estimated parameters of the model using cross-sectional antibody titres to nine different strains spanning 40 years of circulation of influenza A(H3N2) in southern China. We found that "antigenic seniority" and quickly decaying cross-reactivity were important components of the immune response, suggesting that the order in which individuals were infected with influenza strains shaped observed neutralisation titres to a particular virus. We also obtained estimates of the frequency and age distribution of influenza infection, which indicate that although infections became less frequent as individuals progressed through childhood and young adulthood, they occurred at similar rates for individuals above age 30 y. By establishing what are likely to be important mechanisms driving epochal trends in population immunity, we also identified key directions for future studies. In particular, our results highlight the need for longitudinal samples that are tested against multiple historical strains. This could lead to a better understanding of how, over the course of a lifetime, fast, transient antibody dynamics combine with the longer-term immune responses considered here.


Conflict of interest statement

The authors have declared that no competing interests exist.

Figures

Fig 1
Fig 1. Schematic of mechanisms that shape observed titres in the model.
(A) Simple boosting. In the absence of cross-reactivity and antigenic seniority, if an individual had been infected with a particular strain, they exhibited a fixed response to that strain equal to μ. This was controlled by a single parameter in the model. In the figure, strains are sorted by date of isolation, with serological samples taken in present day. Strains the host has been infected with are shown in red; coloured bars show the magnitude of observed log titre as a result of past infection with each strain. (B) Boosting of prior responses via antigenic seniority. Infections boosted observed titres to earlier infecting strains by a certain scaling factor, controlled by the parameter τ1. The magnitude of titre to a particular strain therefore depends on the number of infections that occurred after infection with that strain. (C) Suppression of new responses via antigenic seniority. The response to each strain was reduced as a result of immunity generated by previous infections. This reduction was controlled by the parameter τ2. The titre to a particular strain therefore depended on the number of infections that occurred before that strain circulated. (D) Cross-reactivity. In the absence of antigenic seniority, the observed titre to a test strain depended on the response as a result of infection with that strain, plus cross-reactive responses from infection with other strains. These cross-reactive responses decreased with the distance (measured in years) between each infection and the test strain. Strains that circulated further from the test strain in time contributed less to the observed response.
Fig 2
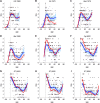
Fig 2. Estimated titres by strain and participant age.
Black points show observed titre against that strain for each participant. Grey points show model estimates. Red line is spline fitted to the data; blue line shows spline fitted to the model estimates, with the 95% confidence interval given by the shaded region. (A–I) Results for each of the nine test strains. Parameters in the model are taken from the maximum a posteriori probability estimates. HK, Hong Kong; ST, Shantou.
Fig 3
Fig 3. Characteristic patterns from different immune mechanisms.
(A) Model titres for participant aged 64 y. Parameters in the model are taken from the maximum a posteriori probability estimate. Circles give observed titres; bars give predicted titres and are coloured by the contribution to immunity from each strain the individual was infected with (infections are indicated by strains in red on the x-axis). Clusters for which there are test strains are shown in bold. Here, predicted titres are predominantly the result of boosting, with little contribution from cross-reactivity. (B) Model titres for participant aged 12 y. Predicted titres for later strains were the sum of contributions from boosting with the test strain and cross-reactivity from related ones. (C) Model titres for participant aged 36 y. With each strain encountered, antigenic seniority reduced boosting to subsequent infections: the coloured bars generated by the infecting strain decrease in size as the number of infections increases.
Fig 4
Fig 4. Frequency of influenza infection.
(A) Number of infections per decade at risk. For each participant, this is calculated by dividing the estimated total number of infections by whichever value is smaller: participant age or 41 (total years between appearance of A(H3N2) in 1968 and test in 2009). Points give median of the posterior distribution; vertical lines show 95% credible interval. (B) Distribution of time between sequential infections, conditional on having at least two infections, across all participants and strains.
Fig 5
Fig 5. Schematic of mechanisms that shape observed titres.
Our model suggests that the expected magnitude of titres that result from a sequence of infections depends on three of the four mechanisms described in Fig. 1: simple boosting, suppression of subsequent responses as a result of antigenic seniority, and cross-reaction. The contribution from infecting strains to observed titres is influenced by simple boosting and suppression via antigenic seniority (A). These contributions, as well as cross-reaction between similar strains, influence final observed titres (B). For illustrative purposes, strains here appear in 3-y-long epochs, and have circulated over a 40-y period. Strains the host has been infected with are shown in red; coloured bars show the magnitude of observed log titre as a result of past infection with each strain.

References

    1. Ferguson NM, Galvani AP, Bush RM (2003) Ecological and immunological determinants of influenza evolution. Nature 422: 428–433. - PubMed
    1. Bedford T, Rambaut A, Pascual M (2012) Canalization of the evolutionary trajectory of the human influenza virus. BMC Biol 10: 38 10.1186/1741-7007-10-38 - DOI - PMC - PubMed
    1. Gagnon A, Miller MS, Hallman SA, Bourbeau R, Herring DA, et al. (2013) Age specific mortality during the 1918 influenza pandemic: unravelling the mystery of high young adult mortality. PLoS ONE 8: e69586 10.1371/journal.pone.0069586 - DOI - PMC - PubMed
    1. Ma J, Dushoff J, Earn DJD (2011) Age-specific mortality risk from pandemic influenza. J Theor Biol 288: 29–34. 10.1016/j.jtbi.2011.08.003 - DOI - PubMed
    1. Miller E, Hoschler K, Hardelid P, Stanford E, Andrews N, et al. (2010) Incidence of 2009 pandemic influenza A H1N1 infection in England: a cross-sectional serological study. Lancet 375: 1100–1108. 10.1016/S0140-6736(09)62126-7 - DOI - PubMed

Publication types

MeSH terms

Substances