Gene Signatures of 1,25-Dihydroxyvitamin D3 Exposure in Normal and Transformed Mammary Cells
- PMID: 25736056
- PMCID: PMC6607438
- DOI: 10.1002/jcb.25129
Gene Signatures of 1,25-Dihydroxyvitamin D3 Exposure in Normal and Transformed Mammary Cells
Abstract
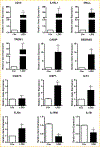
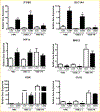
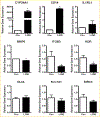
To elucidate potential mediators of vitamin D receptor (VDR) action in breast cancer, we profiled the genomic effects of its ligand 1,25-dihydroxyvitamin D3 (1,25D) in cells derived from normal mammary tissue and breast cancer. In non-transformed hTERT-HME cells, 483 1,25D responsive entities in 42 pathways were identified, whereas in MCF7 breast cancer cells, 249 1,25D responsive entities in 31 pathways were identified. Only 21 annotated genes were commonly altered by 1,25D in both MCF7 and hTERT-HME cells. Gene set enrichment analysis highlighted eight pathways (including senescence/autophagy, TGFβ signaling, endochondral ossification, and adipogenesis) commonly altered by 1,25D in hTERT-HME and MCF7 cells. Regulation of a subset of immune (CD14, IL1RL1, MALL, CAMP, SEMA6D, TREM1, CSF1, IL33, TLR4) and metabolic (ITGB3, SLC1A1, G6PD, GLUL, HIF1A, KDR, BIRC3) genes by 1,25D was confirmed in hTERT-HME cells and similar changes were observed in another comparable non-transformed mammary cell line (HME cells). The effects of 1,25D on these genes were retained in HME cells expressing SV40 large T antigen but were selectively abrogated in HME cells expressing SV40 + RAS and in MCF7 cells. Integration of the datasets from hTERT-HME and MCF7 cells with publically available RNA-SEQ data from 1,25D treated SKBR3 breast cancer cells enabled identification of an 11-gene signature representative of 1,25D exposure in all three breast-derived cell lines. Four of these 11 genes (CYP24A1, CLMN, EFTUD1, and SERPINB1) were also identified as 1,25D responsive in human breast tumor explants, suggesting that this gene signature may prove useful as a biomarker of vitamin D exposure in breast tissue.
Keywords: BREAST CANCER; GENOMIC PROFILING; GROWTH INHIBITION; MAMMARY EPITHELIAL CELLS; MICROARRAY; VITAMIN D RECEPTOR.
© 2015 Wiley Periodicals, Inc.
Figures


Similar articles
-
Comparative regulation of gene expression by 1,25-dihydroxyvitamin D3 in cells derived from normal mammary tissue and breast cancer.J Steroid Biochem Mol Biol. 2015 Apr;148:96-102. doi: 10.1016/j.jsbmb.2014.09.014. Epub 2014 Sep 18. J Steroid Biochem Mol Biol. 2015. PMID: 25239595 Free PMC article. Review.
-
Identification of vitamin D3 target genes in human breast cancer tissue.J Steroid Biochem Mol Biol. 2016 Nov;164:90-97. doi: 10.1016/j.jsbmb.2015.10.012. Epub 2015 Oct 17. J Steroid Biochem Mol Biol. 2016. PMID: 26485663
-
1,25-Dihydroxyvitamin D induces the glutamate transporter SLC1A1 and alters glutamate handling in non-transformed mammary cells.Mol Cell Endocrinol. 2016 Mar 15;424:34-41. doi: 10.1016/j.mce.2016.01.011. Epub 2016 Jan 14. Mol Cell Endocrinol. 2016. PMID: 26774511 Free PMC article.
-
1,25-Dihydroxyvitamin D Regulation of Glutamine Synthetase and Glutamine Metabolism in Human Mammary Epithelial Cells.Endocrinology. 2017 Dec 1;158(12):4174-4188. doi: 10.1210/en.2017-00238. Endocrinology. 2017. PMID: 29029014 Free PMC article.
-
Modeling vitamin D actions in triple negative/basal-like breast cancer.J Steroid Biochem Mol Biol. 2014 Oct;144 Pt A:65-73. doi: 10.1016/j.jsbmb.2013.10.022. Epub 2013 Nov 14. J Steroid Biochem Mol Biol. 2014. PMID: 24239860 Free PMC article. Review.
Cited by
-
Prediagnostic 25-Hydroxyvitamin D Concentrations in Relation to Tumor Molecular Alterations and Risk of Breast Cancer Recurrence.Cancer Epidemiol Biomarkers Prev. 2020 Jun;29(6):1253-1263. doi: 10.1158/1055-9965.EPI-19-1217. Epub 2020 Apr 1. Cancer Epidemiol Biomarkers Prev. 2020. PMID: 32238406 Free PMC article.
-
Vitamin D-regulated Gene Expression Profiles: Species-specificity and Cell-specific Effects on Metabolism and Immunity.Endocrinology. 2021 Feb 1;162(2):bqaa218. doi: 10.1210/endocr/bqaa218. Endocrinology. 2021. PMID: 33249469 Free PMC article.
-
Vitamin D: Metabolism, Molecular Mechanism of Action, and Pleiotropic Effects.Physiol Rev. 2016 Jan;96(1):365-408. doi: 10.1152/physrev.00014.2015. Physiol Rev. 2016. PMID: 26681795 Free PMC article. Review.
-
Vitamin K2 enhances the tumor suppressive effects of 1,25(OH)2D3 in triple negative breast cancer cells.J Steroid Biochem Mol Biol. 2023 Jul;231:106307. doi: 10.1016/j.jsbmb.2023.106307. Epub 2023 Apr 6. J Steroid Biochem Mol Biol. 2023. PMID: 37030416 Free PMC article.
-
Activation of pro-survival metabolic networks by 1,25(OH)2D3 does not hamper the sensitivity of breast cancer cells to chemotherapeutics.Cancer Metab. 2018 Aug 30;6:11. doi: 10.1186/s40170-018-0183-6. eCollection 2018. Cancer Metab. 2018. PMID: 30181873 Free PMC article.
References
-
- Aoyama K, Suh SW, Hamby AM, Liu J, Chan WY, Chen Y, Swanson RA. 2006. Neuronal glutathione deficiency and age-dependent neurodegeneration in the EAAC1 deficient mouse. Nat Neurosci 9:119–126. - PubMed
-
- Beaudin SG, Robilotto S, Welsh J. 2014. Comparative regulation of gene expression by 1,25-dihydroxyvitamin D in cells derived from normal mammary tissue and breast cancer. J Steroid Biochem Mol Biol Sep 18. pii: S0960–0760(14) 00213–1 Sep 18. pii: S0960–0760(14) 00213–1. doi: 10.1016/j.jsbmb.2014.09.014. [Epub ahead of print]. - DOI - PMC - PubMed
-
- Bensaad K, Harris AL. 2014. Hypoxia and metabolism in cancer. Adv Exp Med Biol 772:1–39. - PubMed
-
- Berger U, Wilson P, McClelland RA, Colston K, Haussler MR, Pike JW, Coombes RC. 1987. Immunocytochemical detection of 1,25-dihydroxyvita-min D3 receptor in breast cancer. Cancer Res 47:6793–6799. - PubMed
-
- Buras RR, Schumaker LM, Davoodi F, Brenner RV, Shabahang M, Nauta RJ, Evans SR. 1994. Vitamin D receptors in breast cancer cells. Breast Cancer Res Treat 31:191–202. - PubMed
Publication types
MeSH terms
Substances
Grants and funding
LinkOut - more resources
Full Text Sources
Other Literature Sources
Medical
Molecular Biology Databases
Research Materials
Miscellaneous

