. 2015 Mar 3;6(2):e02356.
doi: 10.1128/mBio.02356-14.

Glycan engagement dictates hydrocephalus induction by serotype 1 reovirus

Affiliations

Glycan engagement dictates hydrocephalus induction by serotype 1 reovirus

Jennifer Stencel-Baerenwald et al. mBio. .

Abstract

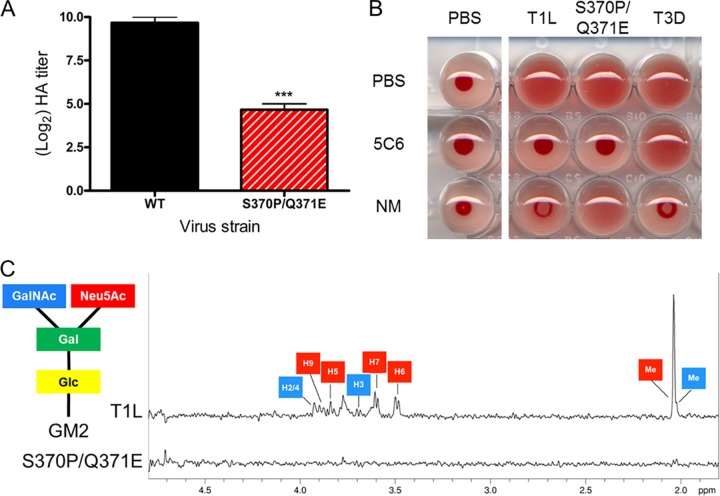
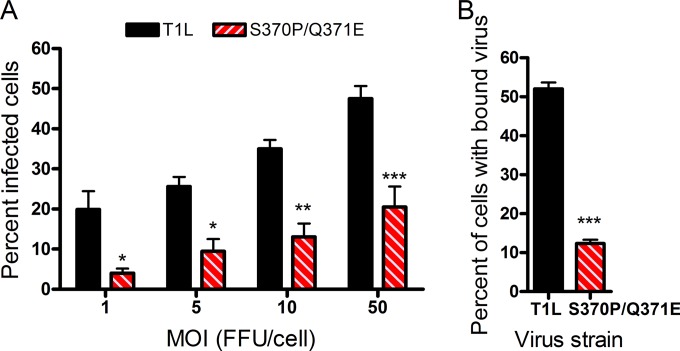
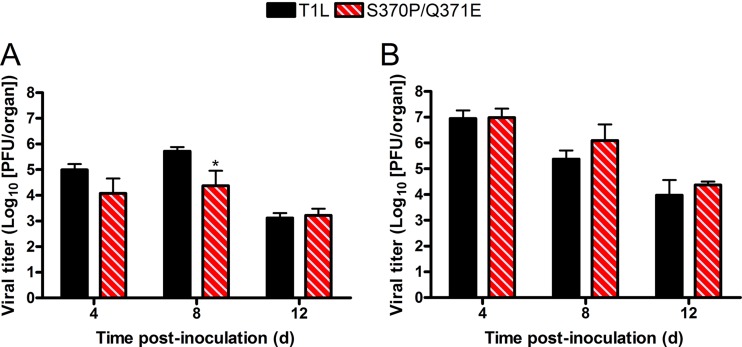
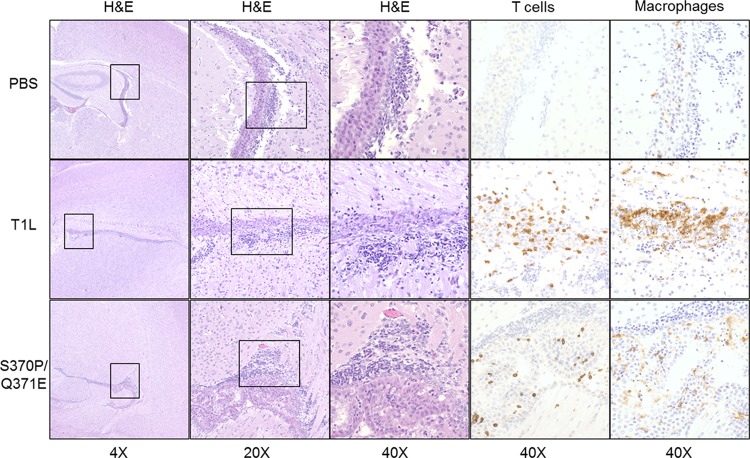
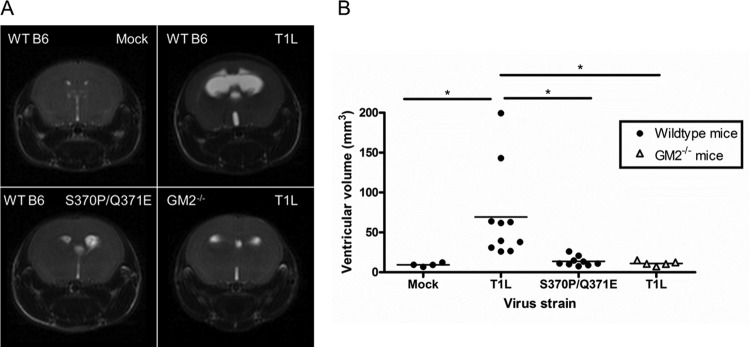
Receptors expressed on the host cell surface adhere viruses to target cells and serve as determinants of viral tropism. Several viruses bind cell surface glycans to facilitate entry, but the contribution of specific glycan moieties to viral disease is incompletely understood. Reovirus provides a tractable experimental model for studies of viral neuropathogenesis. In newborn mice, serotype 1 (T1) reovirus causes hydrocephalus, whereas serotype 3 (T3) reovirus causes encephalitis. T1 and T3 reoviruses engage distinct glycans, suggesting that glycan-binding capacity contributes to these differences in pathogenesis. Using structure-guided mutagenesis, we engineered a mutant T1 reovirus incapable of binding the T1 reovirus-specific glycan receptor, GM2. The mutant virus induced substantially less hydrocephalus than wild-type virus, an effect phenocopied by wild-type virus infection of GM2-deficient mice. In comparison to wild-type virus, yields of mutant virus were diminished in cultured ependymal cells, the cell type that lines the brain ventricles. These findings suggest that GM2 engagement targets reovirus to ependymal cells in mice and illuminate the function of glycan engagement in reovirus serotype-dependent disease.

Importance: Receptor utilization strongly influences viral disease, often dictating host range and target cell selection. Different reovirus serotypes bind to different glycans, but a precise function for these molecules in pathogenesis is unknown. We used type 1 (T1) reovirus deficient in binding the GM2 glycan and mice lacking GM2 to pinpoint a role for glycan engagement in hydrocephalus caused by T1 reovirus. This work indicates that engagement of a specific glycan can lead to infection of specific cells in the host and consequent disease at that site. Since reovirus is being developed as a vaccine vector and oncolytic agent, understanding reovirus-glycan interactions may allow manipulation of reovirus glycan-binding properties for therapeutic applications.


Figures

FIG 1
FIG 1
Glycan binding properties of wild-type and σ1 mutant viruses. (A) Purified virions of the strains shown (1011 particles/well) were serially diluted 1:2 in PBS in 96-well U-bottom plates. Human erythrocytes at a concentration of 1% (vol/vol) in PBS were added to virus-containing wells and incubated at 4°C for 3 h. Results are expressed as log2 (HA titer) for three independent experiments. ***, P < 0.001, as determined by one-way ANOVA followed by Bonferroni’s multiple comparison test. (B) Human erythrocytes were washed with PBS, resuspended at a concentration of 1% (vol/vol), and treated with PBS (vehicle control) or 200 mU of A. ureafaciens neuraminidase (NM) at room temperature for 1 h prior to adsorption with 4 HA units of the virus strains shown in 96-well U-bottom plates. Viruses were pretreated with either PBS or T1L σ1 conformation-specific MAb 5C6. Erythrocytes were incubated with virions at 4°C for 3 h. PBS was used as a virus-free control. The data shown are representative of three independent experiments. (C) Wild-type (T1L) and S370P/Q371E σ1 proteins at a final concentration of 16.8 µM each were incubated with the GM2 glycan at a final concentration of 2 mM. Resonances that can be unambiguously assigned to individual protons are labeled and color coded according to the sugar moieties within the GM2 glycan: glucose (Glc), yellow; galactose (Gal), green; neuraminic acid (Neu5Ac), red; and N-acetylgalactosamine (GalNAc), blue.
FIG 2
FIG 2
Infectivity and binding of T1L and the S370P/Q371E mutant in MEFs. (A) MEFs were adsorbed with either T1L or the S370P/Q371E mutant at the MOIs shown (in focus-forming units [FFU]/cell as determined by titration on L cells) at room temperature for 1 h. Cells were washed twice with PBS, and fresh medium was added. After incubation at 37°C for 20 h, cells were fixed, and reovirus antigen was detected by indirect immunofluorescence. The percentage of infected cells in three fields of view per well was determined. Results are expressed as the percent infected cells from the combined means of three independent experiments, each performed in triplicate wells. Error bars represent standard errors of the means. *, P < 0.05, **, P < 0.01, and ***, P < 0.001, as determined by two-way ANOVA followed by Bonferroni’s multiple comparison test. (B) MEFs were adsorbed with the virus strains shown at an MOI of 5 × 10⁴ particles per cell at 4°C for 1 h. Cells were washed twice with PBS and stained with Alexa-647-labeled reovirus antiserum. The percentage of cells with bound virus was quantified using flow cytometry. Results are from a representative experiment of three independent experiments, each performed in triplicate. Error bars represent standard deviations. ***, P < 0.001, as determined by two-tailed Student’s t test.
FIG 3
FIG 3
Viral titers in the brain following intracranial inoculation with either T1L or the S370P/Q371E mutant. Newborn mice were inoculated intracranially with either 102 (A) or 108 (B) PFU of either T1L or the S370P/Q371E mutant. At days 4, 8, and 12 postinoculation, mice were euthanized, and brains were excised and homogenized. Viral titers in brain homogenates were determined by plaque assay. Results are expressed as mean viral titers for 4 to 11 mice per virus per time point. Error bars represent standard errors of the means. *, P < 0.05, as determined by two-way ANOVA followed by Bonferroni’s multiple-comparison test.
FIG 4
FIG 4
Brain histology 4 days following intracranial inoculation with either T1L or the S370P/Q371E mutant. Newborn mice were inoculated intracranially with 108 PFU of T1L or the S370P/Q371E mutant. Four days postinoculation, mice were euthanized, and brains were excised, fixed, and paraffin embedded. Brain sections were stained with H&E to examine tissue pathology (top). In the section from the T1L-infected brain, arrowheads indicate areas of ependymal cell denuding. Arrows point to sloughed cells in the ventricles, which may contribute to hydrocephalus. In the section from the S370P/Q371E-infected brain, arrows indicate regions of apoptotic neurons and glia with mild hemorrhage. Samples were stained with polyclonal reovirus antiserum to detect viral antigen (bottom). Viral antigen is dispersed in the T1L-infected brain but more localized to the inoculation site in the S370P/Q371E-infected brain.
FIG 5
FIG 5
Brain histology 12 days following intracranial inoculation with either T1L or the S370P/Q371E mutant. Newborn mice were inoculated intracranially with PBS or 108 PFU of either T1L or the S370P/Q371E mutant. Twelve days postinoculation, mice were euthanized, and brains were excised, fixed, and paraffin embedded. Coronal brain sections were stained with H&E to examine tissue pathology and anti-CD3 and anti-F4/80 to mark T cells and macrophages, respectively. Boxes indicate portions of the lateral ventricles that are enlarged in the images on the right.
FIG 6
FIG 6
T1 reovirus glycan-binding capacity influences hydrocephalus induction. Wild-type C57BL/6 and GM2−/− mice were inoculated intracranially with PBS or 108 PFU of either T1L or the S370P/Q371E mutant. T2-weighted magnetic resonance images were obtained 21 days postinoculation. (A) Coronal images from representative wild-type mice inoculated with PBS (top left), wild-type mice inoculated with T1L (top right), wild-type mice inoculated with the S370P/Q371E mutant (bottom left), and GM2−/− mice inoculated with T1L (bottom right) are shown. Cerebrospinal fluid appears white, allowing ventricular volume to be quantified. The images shown were obtained from mice with the median ventricular volume for each virus and mouse strain (n = 4 to 10 mice per group). (B) Ventricular volume of reovirus-infected mice. Each symbol represents the ventricular volume from a single mouse. Mean ventricular volume is indicated by a horizontal bar. *, P < 0.05, as quantified by one-way ANOVA followed by Bonferroni’s correction for multiple tests.
FIG 7
FIG 7
Infectivity and binding of T1L and the S370P/Q371E mutant in ependymoma cells. (A) BXD-1425EPN cells were adsorbed with either T1L or the S370P/Q371E mutant at the MOIs shown (in FFU/cell as determined by titration on L cells) at room temperature for 1 h. Cells were washed twice with PBS, and fresh medium was added. After incubation at 37°C for 20 h, cells were fixed, and reovirus antigen was detected by indirect immunofluorescence. The percentage of infected cells in three fields of view per well was determined. Results are expressed as the percent infected cells from a representative experiment of two independent experiments, each performed using triplicate wells. Error bars represent standard deviations. *, P < 0.05, **, P < 0.01, and ***, P < 0.001, as determined by two-way ANOVA followed by Bonferroni’s multiple comparison test. (B) BXD-1425EPN cells were adsorbed with the virus strains shown at an MOI of 5 × 10⁴ particles per cell at 4°C for 1 h. Cells were washed twice with PBS and stained with Alexa-488-labeled reovirus antiserum. The percentage of cells with bound virus was quantified using flow cytometry. Results are from a representative experiment of two independent experiments, each performed in triplicate. Error bars represent standard deviations. ***, P < 0.001, as determined by two-tailed Student’s t test. (C) T1L and the S370P/Q371E mutant at an MOI of 1 FFU/cell were incubated with the GM2 glycan at a final concentration of 2 mM for 1 h prior to adsorption to BXD-1425EPN cells at room temperature for 1 h. Cells were incubated with PBS or A. ureafaciens neuraminidase for 1 h prior to viral adsorption. Following adsorption, cells were washed twice with PBS, and fresh medium was added. After incubation at 37°C for 20 h, cells were fixed, and reovirus antigen was detected by indirect immunofluorescence. The percentage of infected cells in three fields of view per well was determined. Results are expressed as the percent infected cells from the combined means of three independent experiments, each performed using duplicate wells. Error bars represent standard errors of the means. *, P < 0.05, and **, P < 0.01, as determined by two-way ANOVA followed by Bonferroni’s multiple comparison test.

References

    1. Barton ES, Connolly JL, Forrest JC, Chappell JD, Dermody TS. 2001. Utilization of sialic acid as a coreceptor enhances reovirus attachment by multistep adhesion strengthening. J Biol Chem 276:2200–2211. doi:10.1074/jbc.M004680200. - DOI - PubMed
    1. Chappell JD, Duong JL, Wright BW, Dermody TS. 2000. Identification of carbohydrate-binding domains in the attachment proteins of type 1 and type 3 reoviruses. J Virol 74:8472–8479. doi:10.1128/JVI.74.18.8472-8479.2000. - DOI - PMC - PubMed
    1. Chappell JD, Gunn VL, Wetzel JD, Baer GS, Dermody TS. 1997. Mutations in type 3 reovirus that determine binding to sialic acid are contained in the fibrous tail domain of viral attachment protein σ1. J Virol 71:1834–1841. - PMC - PubMed
    1. Tsai B, Gilbert JM, Stehle T, Lencer W, Benjamin TL, Rapoport TA. 2003. Gangliosides are receptors for murine polyoma virus and SV40. EMBO J 22:4346–4355. doi:10.1093/emboj/cdg439. - DOI - PMC - PubMed
    1. Rogers GN, Paulson JC, Daniels RS, Skehel JJ, Wilson IA, Wiley DC. 1983. Single amino acid substitutions in influenza haemagglutinin change receptor binding specificity. Nature 304:76–78. doi:10.1038/304076a0. - DOI - PubMed

Publication types