Comparative Study
. 2015 Mar 3;6(2):e00037.
doi: 10.1128/mBio.00037-15.

Analysis of the upper respiratory tract microbiotas as the source of the lung and gastric microbiotas in healthy individuals

Affiliations
Comparative Study

Analysis of the upper respiratory tract microbiotas as the source of the lung and gastric microbiotas in healthy individuals

Christine M Bassis et al. mBio. .

Abstract

No studies have examined the relationships between bacterial communities along sites of the upper aerodigestive tract of an individual subject. Our objective was to perform an intrasubject and intersite analysis to determine the contributions of two upper mucosal sites (mouth and nose) as source communities for the bacterial microbiome of lower sites (lungs and stomach). Oral wash, bronchoalveolar lavage (BAL) fluid, nasal swab, and gastric aspirate samples were collected from 28 healthy subjects. Extensive analysis of controls and serial intrasubject BAL fluid samples demonstrated that sampling of the lungs by bronchoscopy was not confounded by oral microbiome contamination. By quantitative PCR, the oral cavity and stomach contained the highest bacterial signal levels and the nasal cavity and lungs contained much lower levels. Pyrosequencing of 16S rRNA gene amplicon libraries generated from these samples showed that the oral and gastric compartments had the greatest species richness, which was significantly greater in both than the richness measured in the lungs and nasal cavity. The bacterial communities of the lungs were significantly different from those of the mouth, nose, and stomach, while the greatest similarity was between the oral and gastric communities. However, the bacterial communities of healthy lungs shared significant membership with the mouth, but not the nose, and marked subject-subject variation was noted. In summary, microbial immigration from the oral cavity appears to be the significant source of the lung microbiome during health, but unlike the stomach, the lungs exhibit evidence of selective elimination of Prevotella bacteria derived from the upper airways.

Importance: We have demonstrated that the bacterial communities of the healthy lung overlapped those found in the mouth but were found at lower concentrations, with lower membership and a different community composition. The nasal microbiome, which was distinct from the oral microbiome, appeared to contribute little to the composition of the lung microbiome in healthy subjects. Our studies of the nasal, oral, lung, and stomach microbiomes within an individual illustrate the microbiological continuity of the aerodigestive tract in healthy adults and provide culture-independent microbiological support for the concept that microaspiration is common in healthy individuals.


Figures

FIG 1
FIG 1
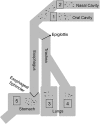
The aerodigestive tract. Schematic of the flow relationship between the oral and nasal cavities and the lungs and stomach. The numbers indicate the five sites sampled in this study.
FIG 2
FIG 2
(A) Intrasubject similarity indices (θYC distance [1 − θYC]) between the bacterial communities of the first return BAL fluid (BAL1) and oral wash samples, compared to the second return BAL fluid (BAL2) and oral wash samples from that same subject. Distances were based on a 3% OTU definition with subsampling of 700 sequences/sample. There was no statistically significant difference in the oral-BAL fluid sample comparison of the first and second return BAL fluid samples in terms of bacterial community composition. (B) 16S rRNA gene qPCR of DNA prepared from the samples in this study, as well as bronchoscope rinse saline and prebronchoscope saline. The number of copies of bacterial 16S rRNA genes per 5 ml of sample (saline, scope, BAL, oral, and gastric) or per (nasal) swab was measured by qPCR as described in Materials and Methods. Sample groups were compared by ANOVA and Tukey’s multiple-comparison test. Data are the mean ± the standard error of the mean. *, P < 0.05 compared to saline only; other significant comparisons are shown in the graph; nd, not done (because the swab was of a different sample type). (C) Bacterial species richness of each site, as determined by calculating the number of OTUs (97% identity) per sample after subsampling of all samples to the same depth of 700 reads. Sample groups were compared by ANOVA and Tukey’s multiple-comparison test.
FIG 3
FIG 3
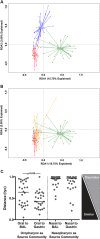
(A, B) Graphic representation of the results of an RDA of the bacterial samples isolated from each of the four sites to determine whether a significant amount of the variation can be explained by differences in sample location. (A) Comparison of nasal, oral, and lung samples in RDA1 versus RDA2. (B) Comparison of nasal, oral, and gastric samples on RDA1 versus RDA2. (C) Indices of intrasubject similarity (θYC distance [1 − θYC]) between the bacterial communities of the two source sites (mouth and nose) and two target sites (lungs and stomach) of that subject. As shown, shorter θYC distances correspond to greater similarities between the bacterial communities of the samples indicated. Distances were based on a 3% OTU definition with subsampling of 700 sequences/sample.
FIG 4
FIG 4
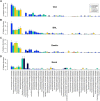
Rank abundance plots for each of the sampling locations based on the top 50 OTUs from the overall order (greatest to smallest) taken from all of the samples combined. The bars depict the mean ± the standard error of the mean. Bars are colored according to their phyla. The family, genus, and OTU identification of the bacterial community members are displayed along the x axis of panel D.
FIG 5
FIG 5
Paired analysis of Prevotella abundance distribution in the oral wash of an individual and the abundance of that same OTU in the gastric aspirate (A) and BAL fluid (B) of the same individual. Prevotella OTUs were determined as described in Materials and Methods, and all of the samples from all of the sites were subsampled to 700 reads. For this analysis, any OTU below the limit of detection was assigned an abundance of 0.07%. The solid line indicates a 1:1 ratio of abundance in the oral wash compared to the gastric aspirate (A) or BAL fluid (B), and the dotted lines are 2:1 and 1:2 ratios. Six Prevotella OTUs were detected in the analysis, and the abundance of each OTU in each of the 28 subjects is displayed on the graphs (168 data points/graph). The oral-BAL fluid sample and oral-gastric sample data sets were significantly different from each other (P = 0.003). The mean ratio within the oral-gastric sample data set was 1.18:1, while the mean ratio within the oral-BAL fluid sample data set was 2.04:1. Other abundance comparisons: 11.4% of the observations in the oral-BAL fluid sample data set were at a ratio of 64:1 or greater, and 31.0% were at 8:1 or higher, while only 2.4% of the observations in the oral-gastric sample data set were 64:1 or greater and only 14.3% were 8:1 or greater.

References

    1. Dickson RP, Erb-Downward JR, Huffnagle GB. 2013. The role of the bacterial microbiome in lung disease. Expert Rev Respir Med 7:245–257. doi:10.1586/ers.13.24. - DOI - PMC - PubMed
    1. Dickson RP, Erb-Downward JR, Huffnagle GB. 2014. Towards an ecology of the lung: new conceptual models of pulmonary microbiology and pneumonia pathogenesis. Lancet Respir. Med. 2:238–246. doi:10.1016/S2213-2600(14)70028-1. - DOI - PMC - PubMed
    1. Hilty M, Burke C, Pedro H, Cardenas P, Bush A, Bossley C, Davies J, Ervine A, Poulter L, Pachter L, Moffatt MF, Cookson WO. 2010. Disordered microbial communities in asthmatic airways. PLoS One 5:e8578. doi:10.1371/journal.pone.0008578. - DOI - PMC - PubMed
    1. Huang YJ, Lynch SV. 2011. The emerging relationship between the airway microbiota and chronic respiratory disease: clinical implications. Expert Rev Respir Med 5:809-821. doi:10.1586/ers.11.76. - DOI - PMC - PubMed
    1. Human Microbiome Project Consortium 2012. Structure, function and diversity of the healthy human microbiome. Nature 486:207–214. doi:10.1038/nature11234. - DOI - PMC - PubMed

Publication types

LinkOut - more resources