

The anti-fibrotic effects of mesenchymal stem cells on irradiated lungs via stimulating endogenous secretion of HGF and PGE2
- PMID: 25736907
- PMCID: PMC4348621
- DOI: 10.1038/srep08713
The anti-fibrotic effects of mesenchymal stem cells on irradiated lungs via stimulating endogenous secretion of HGF and PGE2
Abstract
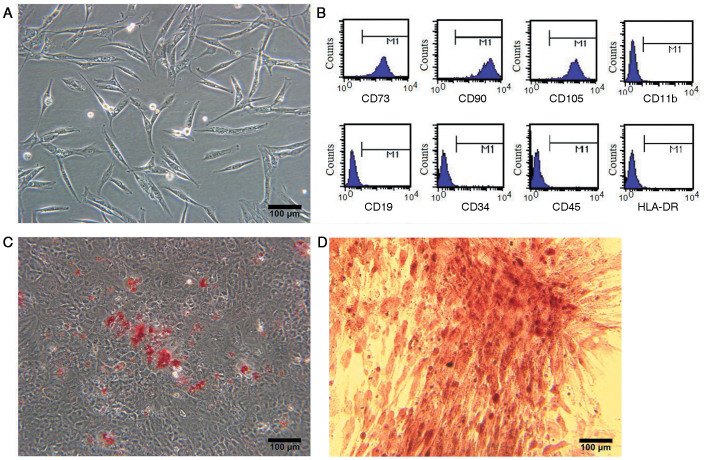
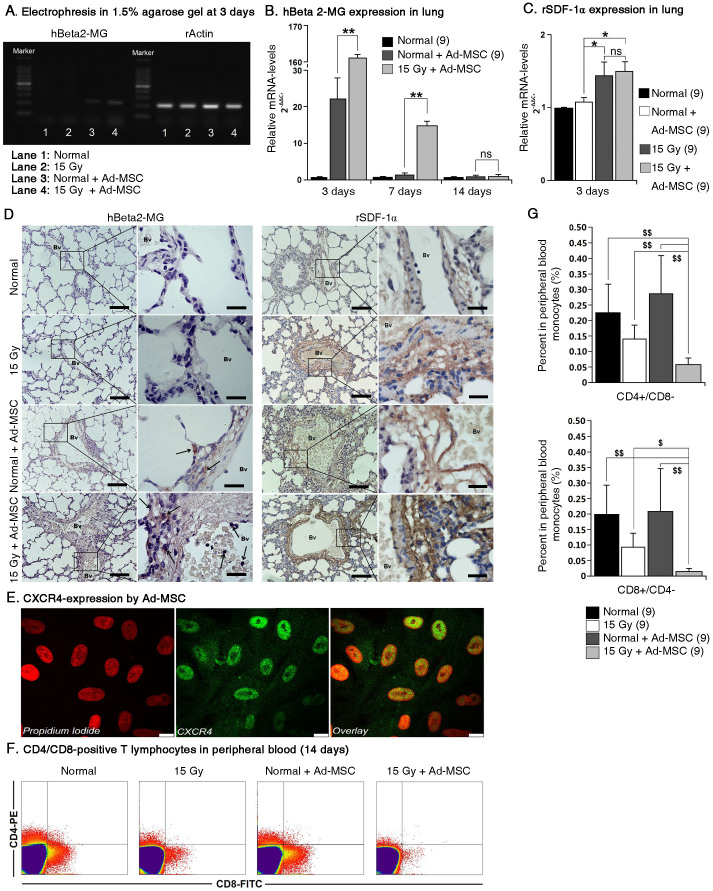
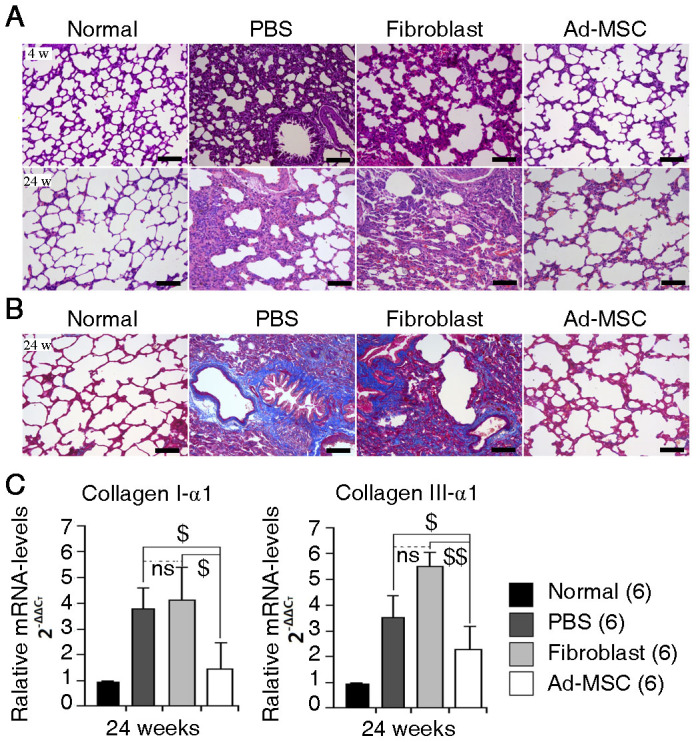
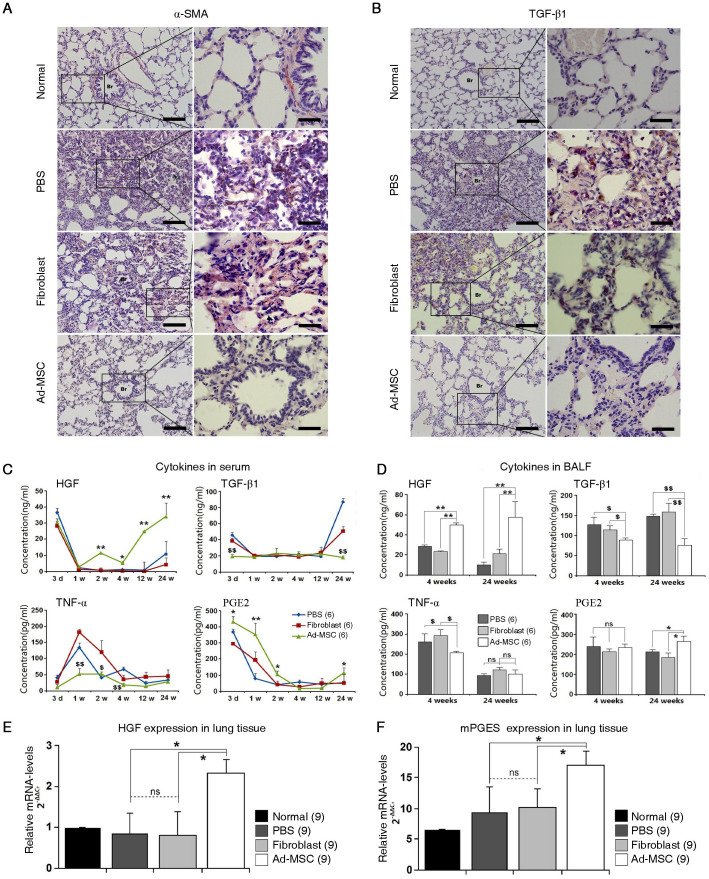
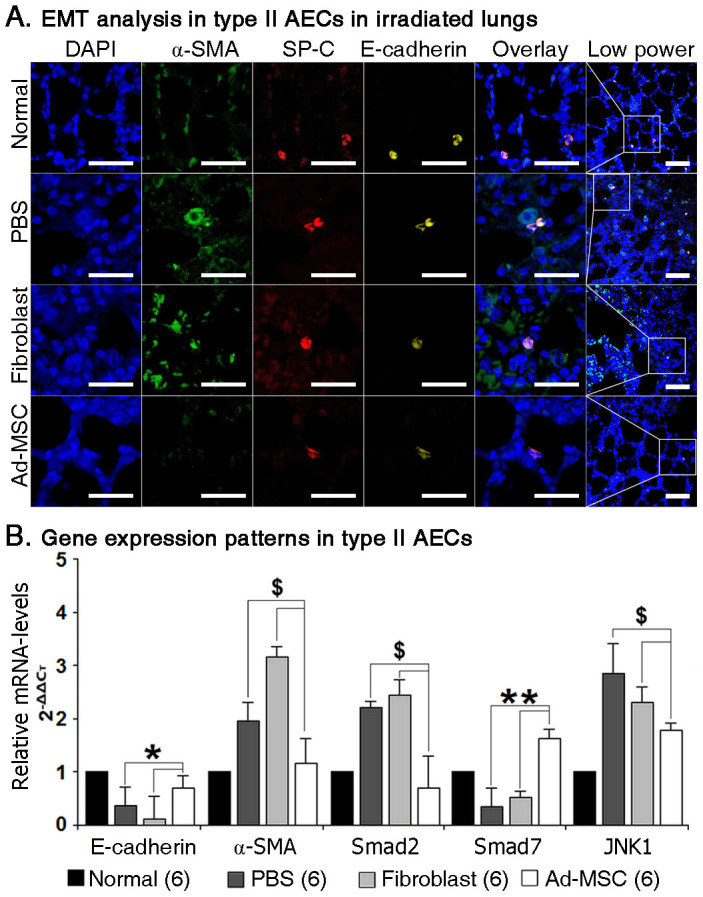
Radiation-induced pulmonary fibrosis is a common disease and has a poor prognosis owing to the progressive breakdown of gas exchange regions in the lung. Recently, a novel strategy of administering mesenchymal stem cells for pulmonary fibrosis has achieved high therapeutic efficacy. In the present study, we attempted to use human adipose tissue-derived mesenchymal stem cells to prevent disease in Sprague-Dawley rats that received semi-thoracic irradiation (15 Gy). To investigate the specific roles of mesenchymal stem cells in ameliorating radiation-induced pulmonary fibrosis, we treated control groups of irradiated rats with human skin fibroblasts or phosphate-buffered saline. After mesenchymal stem cells were infused, host secretions of hepatocyte growth factor (HGF) and prostaglandin E2 (PGE2) were elevated compared with those of the controls. In contrast, tumour necrosis factor-alpha (TNF-α) and transforming growth factor-beta1 (TGF-β1) levels were decreased after infusion of mesenchymal stem cells. Consequently, the architecture of the irradiated lungs was preserved without marked activation of fibroblasts or collagen deposition within the injured sites. Moreover, mesenchymal stem cells were able to prevent the irradiated type II alveolar epithelial cells from undergoing epithelial-mesenchymal transition. Collectively, these data confirmed that mesenchymal stem cells have the potential to limit pulmonary fibrosis after exposure to ionising irradiation.
Figures
Similar articles
-
Adipose-Derived Stem Cell Therapy Ameliorates Ionizing Irradiation Fibrosis via Hepatocyte Growth Factor-Mediated Transforming Growth Factor-β Downregulation and Recruitment of Bone Marrow Cells.Stem Cells. 2019 Jun;37(6):791-802. doi: 10.1002/stem.3000. Epub 2019 Apr 11. Stem Cells. 2019. PMID: 30861238 Free PMC article.
-
Anti-fibrotic effects of bone morphogenetic protein-7-modified bone marrow mesenchymal stem cells on silica-induced pulmonary fibrosis.Exp Mol Pathol. 2017 Feb;102(1):70-77. doi: 10.1016/j.yexmp.2016.12.010. Epub 2017 Jan 4. Exp Mol Pathol. 2017. PMID: 28062213
-
Hepatocyte growth factor gene-modified mesenchymal stem cells reduce radiation-induced lung injury.Hum Gene Ther. 2013 Mar;24(3):343-53. doi: 10.1089/hum.2012.177. Epub 2013 Mar 4. Hum Gene Ther. 2013. PMID: 23458413
-
Mesenchymal Stromal Cells Derived Conditioned Medium in Pulmonary Fibrosis: A Systematic Review and Meta-analysis.Arch Iran Med. 2020 Dec 1;23(12):870-879. doi: 10.34172/aim.2020.116. Arch Iran Med. 2020. PMID: 33356346
-
Hepatocyte growth factor in lung repair and pulmonary fibrosis.Acta Pharmacol Sin. 2011 Jan;32(1):12-20. doi: 10.1038/aps.2010.90. Epub 2010 Dec 6. Acta Pharmacol Sin. 2011. PMID: 21131996 Free PMC article. Review.
Cited by
-
Enhanced secretion of hepatocyte growth factor in human umbilical cord mesenchymal stem cells ameliorates pulmonary fibrosis induced by bleomycin in rats.Front Pharmacol. 2023 Jan 6;13:1070736. doi: 10.3389/fphar.2022.1070736. eCollection 2022. Front Pharmacol. 2023. PMID: 36726784 Free PMC article.
-
Mesenchymal Stromal Cells: Heterogeneity and Therapeutical Applications.Cells. 2023 Aug 10;12(16):2039. doi: 10.3390/cells12162039. Cells. 2023. PMID: 37626848 Free PMC article. Review.
-
Efficacy of bone marrow mesenchymal stem cell transplantation in animal models of pulmonary fibrosis after exposure to bleomycin: A meta-analysis.Exp Ther Med. 2019 Mar;17(3):2247-2255. doi: 10.3892/etm.2019.7205. Epub 2019 Jan 28. Exp Ther Med. 2019. PMID: 30867709 Free PMC article.
-
Oncostatin M-Preconditioned Mesenchymal Stem Cells Alleviate Bleomycin-Induced Pulmonary Fibrosis Through Paracrine Effects of the Hepatocyte Growth Factor.Stem Cells Transl Med. 2017 Mar;6(3):1006-1017. doi: 10.5966/sctm.2016-0054. Epub 2016 Oct 18. Stem Cells Transl Med. 2017. PMID: 28297588 Free PMC article.
-
Inhibition of Transforming Growth Factor-β Receptor signaling promotes culture expansion of undifferentiated human Endometrial Mesenchymal Stem/stromal Cells.Sci Rep. 2015 Oct 13;5:15042. doi: 10.1038/srep15042. Sci Rep. 2015. PMID: 26461813 Free PMC article.
References
-
- Kong F. M., Ten Haken R., Eisbruch A. & Lawrence T. S. Non-small cell lung cancer therapy-related pulmonary toxicity: an update on radiation pneumonitis and fibrosis. SeminOncol. 32, S42–54 (2005). - PubMed
-
- Ghafoori P., Marks L. B., Vujaskovic Z. & Kelsey C. R. Radiation-induced lung injury. assessment, management, and prevention. Oncology (Williston Park). 22, 37–47; discussion 52–3 (2008). - PubMed
-
- Derynck R. & Zhang Y. E. Smad-dependent and smad-independent pathways in TGF-beta family signalling. Nature. 425, 577–584 (2003). - PubMed
MeSH terms
Substances
LinkOut - more resources
Full Text Sources
Other Literature Sources
Medical
