

Mapping the Progression of Atrophy in Early- and Late-Onset Alzheimer's Disease
- PMID: 25737041
- PMCID: PMC4559486
- DOI: 10.3233/JAD-142292
Mapping the Progression of Atrophy in Early- and Late-Onset Alzheimer's Disease
Abstract
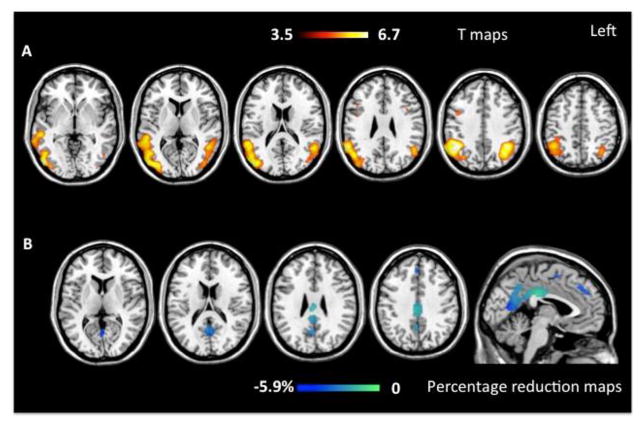
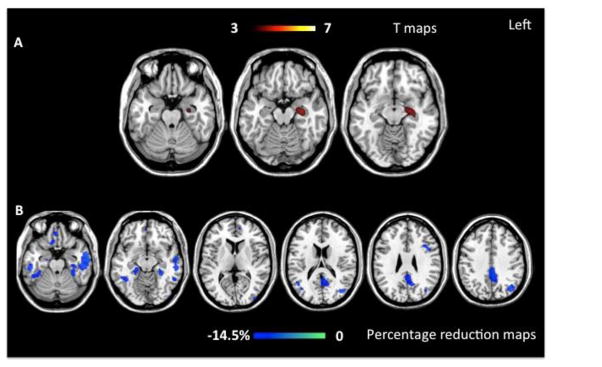
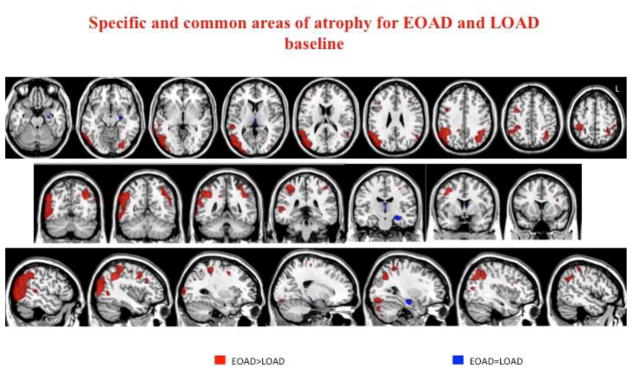
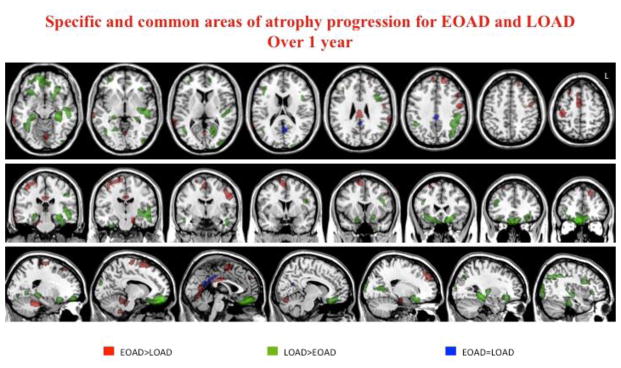
The term early-onset Alzheimer's disease (EOAD) identifies patients who meet criteria for AD, but show onset of symptoms before the age of 65. We map progression of gray matter atrophy in EOAD patients compared to late-onset AD (LOAD). T1-weighted MRI scans were obtained at diagnosis and one-year follow-up from 15 EOAD, 10 LOAD, and 38 age-matched controls. Voxel-based and tensor-based morphometry were used, respectively, to assess the baseline and progression of atrophy. At baseline, EOAD patients already showed a widespread atrophy in temporal, parietal, occipital, and frontal cortices. After one year, EOAD had atrophy progression in medial temporal and medial parietal cortices. At baseline, LOAD patients showed atrophy in the medial temporal regions only, and, after one year, an extensive pattern of atrophy progression in the same neocortical cortices of EOAD. Although atrophy mainly involved different lateral neocortical or medial temporal hubs at baseline, it eventually progressed along the same brain default-network regions in both groups. The cortical region showing a significant progression in both groups was the medial precuneus/posterior cingulate.
Keywords: Age of onset; Alzheimer’s disease; atrophy progression; default mode network; tensor based morphometry; voxel based morphometry.
Figures
References
-
- Seltzer B, Sherwin I. A comparison of clinical features in early- and late-onset primary degenerative dementia. One entity or two? Arch Neurol. 1983;40:143–146. - PubMed
-
- Koss E, Edland S, Fillenbaum G, Mohs R, Clark C, Galasko D, Morris JC. Clinical and neuropsychological differences between patients with earlier and later onset of Alzheimer’s disease: A CERAD analysis, Part XII. Neurology. 1996;46:136–141. - PubMed
-
- Grady CL, Haxby JV, Horwitz B, Berg G, Rapoport SI. Neuropsychological and cerebral metabolic function in early vs late onset dementia of the Alzheimer type. Neuropsychologia. 1987;25:807–816. - PubMed
-
- Smits LL, Pijnenburg YA, Koedam EL, van der Vlies AE, Reuling IE, Koene T, Teunissen CE, Scheltens P, van der Flier WM. Early onset Alzheimer’s disease is associated with a distinct neuropsychological profile. J Alzheimers Dis. 2012;30:101–108. - PubMed
-
- van der Vlies AE, Staekenborg SS, Admiraal-Behloul F, Prins ND, Barkhof F, Vrenken H, Reiber JH, Scheltens P, van der Flier WM. Associations between magnetic resonance imaging measures and neuropsychological impairment in early and late onset alzheimer’s disease. J Alzheimers Dis. 2013;35:169–178. - PubMed
