

Estimating the basic reproductive ratio for the Ebola outbreak in Liberia and Sierra Leone
- PMID: 25737782
- PMCID: PMC4347917
- DOI: 10.1186/s40249-015-0043-3
Estimating the basic reproductive ratio for the Ebola outbreak in Liberia and Sierra Leone
Abstract
Background: Ebola virus disease has reemerged as a major public health crisis in Africa, with isolated cases also observed globally, during the current outbreak.
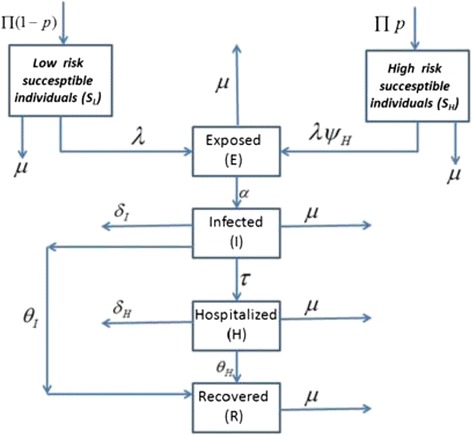
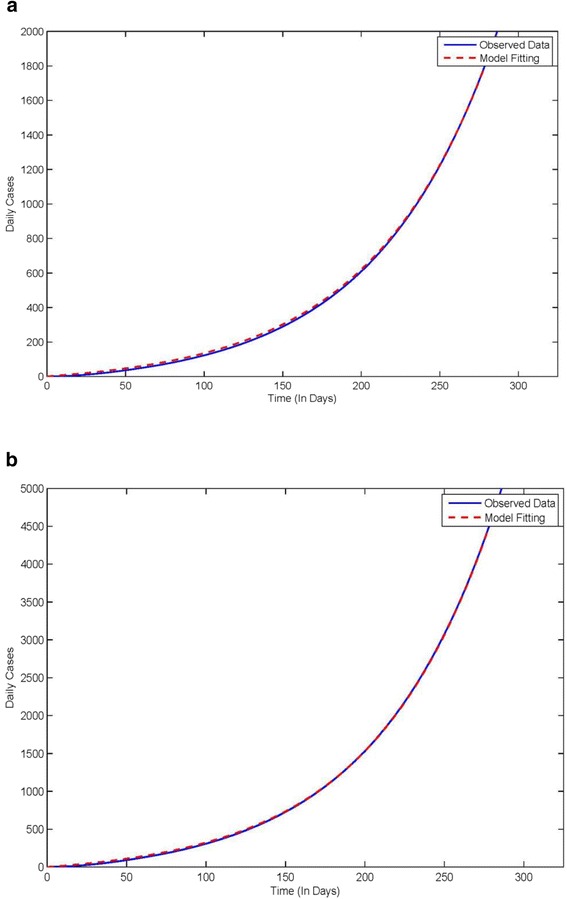
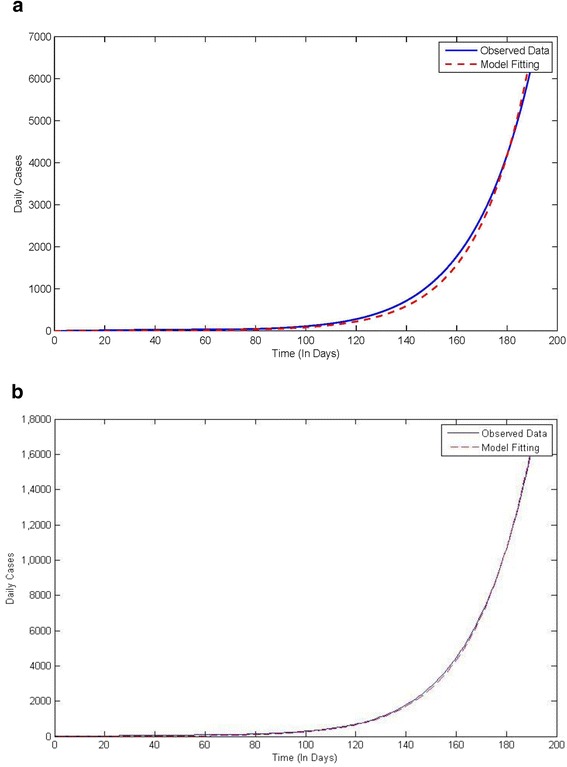
Methods: To estimate the basic reproductive ratio R0, which is a measure of the severity of the outbreak, we developed a SEIR (susceptible-exposed-infected-recovered) type deterministic model, and used data from the Centers for Disease Control and Prevention (CDC), for the Ebola outbreak in Liberia and Sierra Leone. Two different data sets are available: one with raw reported data and one with corrected data (as the CDC suspects under-reporting).
Results: Using a deterministic ordinary differential equation transmission model for Ebola epidemic, the basic reproductive ratio R0 for Liberia resulted to be 1.757 and 1.9 for corrected and uncorrected case data, respectively. For Sierra Leone, R0 resulted to be 1.492 and 1.362 for corrected and uncorrected case data, respectively. In each of the two cases we considered, the estimate for the basic reproductive ratio was initially greater than unity leading to an epidemic outbreak.
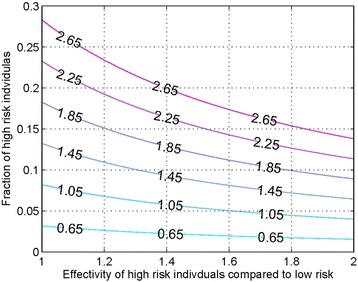
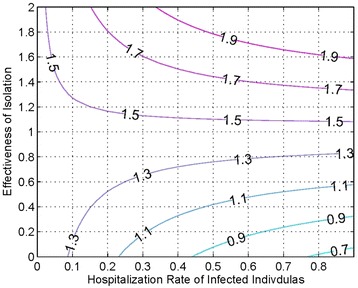
Conclusion: We obtained robust estimates for the value of R0 associated with the 2014 Ebola outbreak, and showed that there is close agreement between our estimates of R0. Analysis of our model also showed that effective isolation is required, with the contact rate in isolation less than one quarter of that for the infected non-isolated population, and that the fraction of high-risk individuals must be brought to less than 10% of the overall susceptible population, in order to bring the value of R0 to less than 1, and hence control the outbreak.
Keywords: Basic reproductive ratio; Ebola virus disease; Epidemiology; Transmission model.
Figures
References
-
- Brief General History of Ebola, 29 Oct 2014 https://web.stanford.edu/group/virus/filo/history.html.
-
- Haradhan M. The most fatal 2014 outbreak of ebola virus disease in Western Africa. Am J Epidemiol Infect Dis. 2014;2(4).
-
- Ebola mapping the outbreak, BBC News Africa, BBC Web 29 Oct 2014. http://www.bbc.com/news/world-africa-28755033.
LinkOut - more resources
Full Text Sources
Other Literature Sources
