. 2015 Feb 10:7:ecurrents.outbreaks.406ae55e83ec0b5193e30856b9235ed2.
doi: 10.1371/currents.outbreaks.406ae55e83ec0b5193e30856b9235ed2.

Temporal Changes in Ebola Transmission in Sierra Leone and Implications for Control Requirements: a Real-time Modelling Study

Affiliations

Temporal Changes in Ebola Transmission in Sierra Leone and Implications for Control Requirements: a Real-time Modelling Study

Anton Camacho et al. PLoS Curr. .

Abstract

Background: Between August and November 2014, the incidence of Ebola virus disease (EVD) rose dramatically in several districts of Sierra Leone. As a result, the number of cases exceeded the capacity of Ebola holding and treatment centres. During December, additional beds were introduced, and incidence declined in many areas. We aimed to measure patterns of transmission in different regions, and evaluate whether bed capacity is now sufficient to meet future demand.

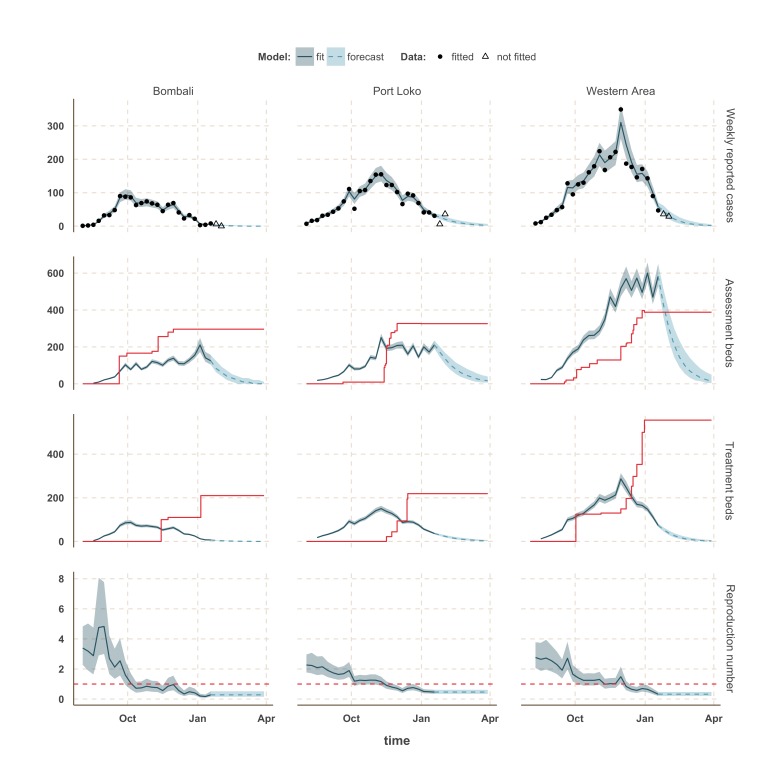
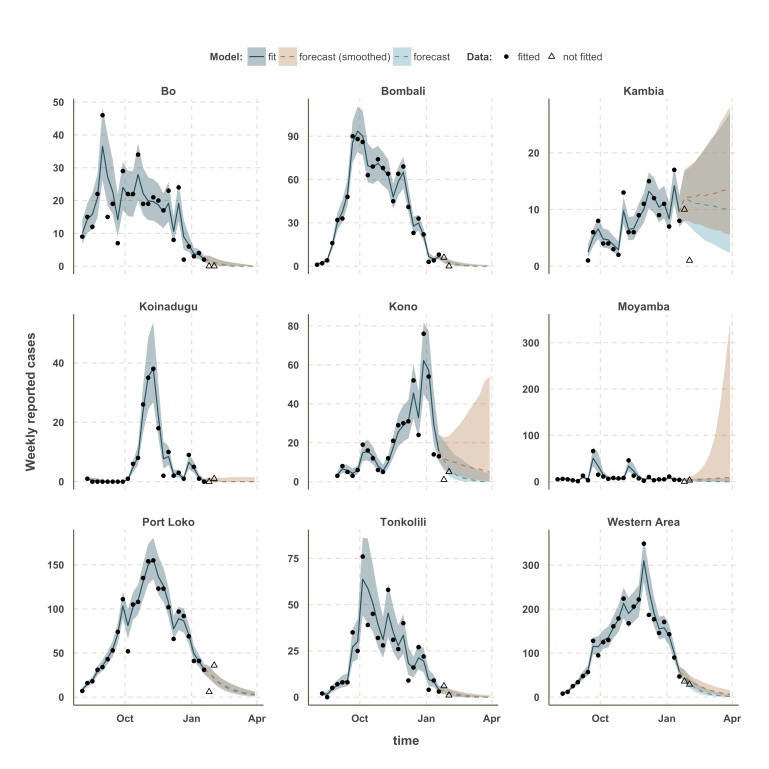
Methods: We used a mathematical model of EVD infection to estimate how the extent of transmission in the nine worst affected districts of Sierra Leone changed between 10th August 2014 and 18th January 2015. Using the model, we forecast the number of cases that could occur until the end of March 2015, and compared bed requirements with expected future capacity.

Results: We found that the reproduction number, R, defined as the average number of secondary cases generated by a typical infectious individual, declined between August and December in all districts. We estimated that R was near the crucial control threshold value of 1 in December. We further estimated that bed capacity has lagged behind demand between August and December for most districts, but as a consequence of the decline in transmission, control measures caught up with the epidemic in early 2015.

Conclusions: EVD incidence has exhibited substantial temporal and geographical variation in Sierra Leone, but our results suggest that the epidemic may have now peaked in Sierra Leone, and that current bed capacity appears to be sufficient to keep the epidemic under-control in most districts.

Keywords: ebola.


Figures

Geographical distribution of Ebola virus disease in Sierra Leone.
The map shows cumulative number of confirmed and probable cases reported up to 18 January 2015 in the fourteen districts of Sierra Leone. Darker shades of red indicate a greater number of cases.
Time-series of the weekly number of confirmed and probable cases reported in the patient (black) and situation report (blue) databases.
The vertical red line indicates the cut-off date after which we used the situation report database since it provided more reliable information than the patient database.
Model fits and forecast for Bombali, Port Loko, and Western Area.
The shaded area is the interquartile range on estimates (grey) and projections (blue), the red solid line is the bed capacity and the red dotted line on the lower panels represents R=1, which is the threshold for control. Fitted data are plotted as filled circles and the two additional, non-fitted, data as open triangles.
Model fits and forecast for Bo, Kambia, and Kono.
The shaded area is the interquartile range on estimates (grey) and projections (blue), the red solid line is the bed capacity and the red dotted line on the lower panels represents R=1, which is the threshold for control. Fitted data are plotted as filled circles and the two additional, non-fitted, data as open triangles.
Model fits and forecast for Koinadugu, Moyamba and Tonkolili.
The shaded area is the interquartile range on estimates (grey) and projections (blue), the red solid line is the bed capacity and the red dotted line on the lower panels represents R=1, which is the threshold for control. Fitted data are plotted as filled circles and the two additional, non-fitted, data as open triangles.
Flowchart of the model
Proportion of EVD positive cases in different districts
Sensitivity analysis on sampling of reproduction number
Blue dashed line shows median forecast as in Figures 3-5, with the reproduction number sampled from the posterior at the last data point.Orange dashed line shows median forecast when the reproduction number is sampled from the average posterior distribution over the first three weeks of January. Shaded regions represent interquartile range. Fitted data are plotted as filled circles and the two additional, non-fitted, data as open triangles.

References

    1. Sierra Leone Ministry of Health and Sanitation. Ebola virus disease - situation report 2014. - PubMed
    1. UN for Ebola Emergency Response and the National Emergency Response Centre. Ebola emergency weekly situation report. Tech. Rep. 7,8, United Nations, New York, USA 2014.
    1. The Humanitarian Data Exchange. West Africa: Ebola Outbreak 2014
    1. World Health Organization. Ebola Situation reports 2015
    1. Chowell G, Hengartner NW, Castillo-Chavez C, Fenimore PW, Hyman JM. The basic reproductive number of Ebola and the effects of public health measures: the cases of Congo and Uganda. J Theor Biol. 2004 Jul 7;229(1):119-26. PubMed PMID:15178190. - PubMed