. 2015 Jan 6;4(3):199-209.
doi: 10.1016/j.molmet.2014.12.013. eCollection 2015 Mar.

Seipin oligomers can interact directly with AGPAT2 and lipin 1, physically scaffolding critical regulators of adipogenesis

Affiliations

Seipin oligomers can interact directly with AGPAT2 and lipin 1, physically scaffolding critical regulators of adipogenesis

Md Mesbah Uddin Talukder et al. Mol Metab. .

Abstract

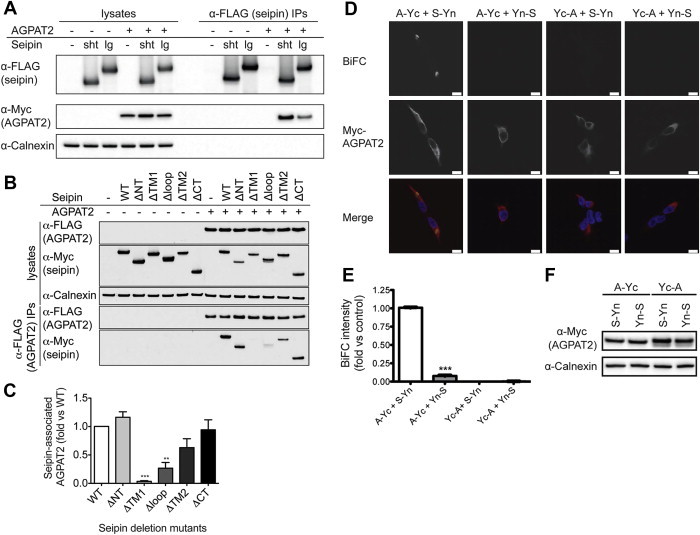
Objective: Disruption of the genes encoding either seipin or 1-acylglycerol-3-phosphate O-acyltransferase 2 (AGPAT2) causes severe congenital generalized lipodystrophy (CGL) in humans. However, the function of seipin in adipogenesis remains poorly defined. We demonstrated recently that seipin can bind the key adipogenic phosphatidic acid (PA) phosphatase lipin 1 and that seipin forms stable dodecamers. As AGPAT2 generates PA, the substrate for lipin 1, we investigated whether seipin might bind both enzymes of this lipid biosynthetic pathway, which is required for adipogenesis to occur.

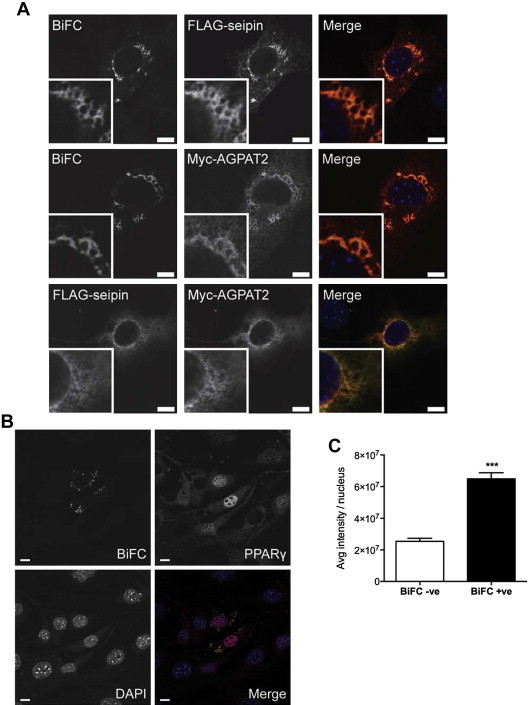
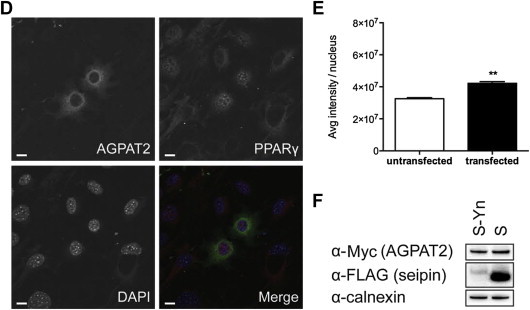
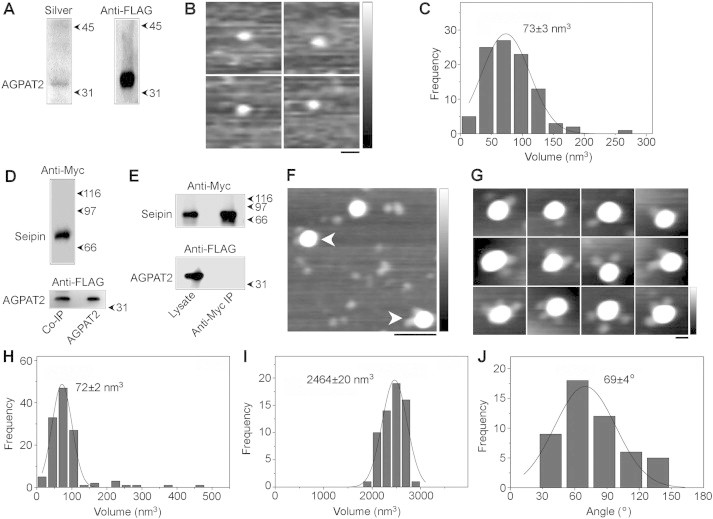
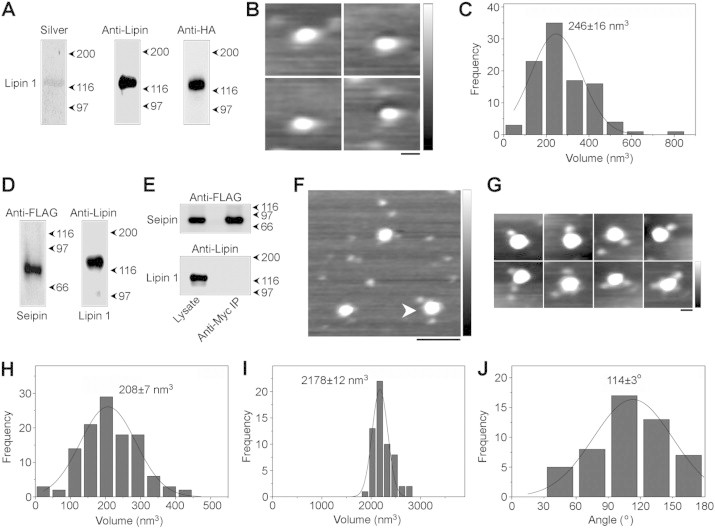
Methods: We employed co-immunoprecipitation and immunofluorescence methods to determine whether seipin can interact with AGPAT2 and the consequences of this in developing adipocytes. Atomic force microscopy was used to determine whether these interactions involved direct association of the proteins and to define the molecular architecture of these complexes.

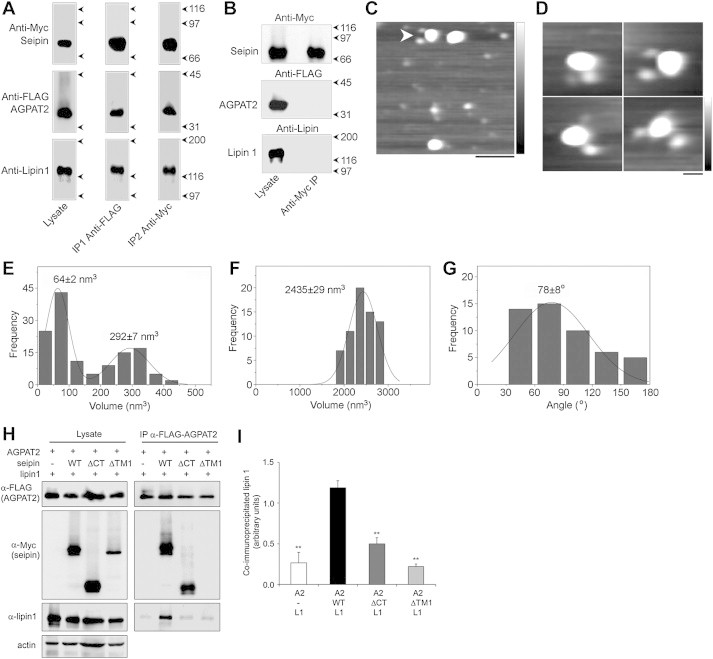
Results: Our data reveal that seipin can bind AGPAT2 during adipogenesis and that stabilizing this interaction during adipogenesis can increase the nuclear accumulation of PPARγ. Both AGPAT2 and lipin 1 can directly associate with seipin dodecamers, and a single seipin complex can simultaneously bind both AGPAT2 and lipin with a defined orientation.

Conclusions: Our study provides the first direct molecular link between seipin and AGPAT2, two proteins whose disruption causes CGL. Moreover, it provides the first example of an interaction between seipin and another protein that causally influences a key aspect of adipogenesis. Together our data suggest that the critical role of seipin in adipogenesis may involve its capacity to juxtapose important regulators of this process in a multi-protein complex.

Keywords: AGPAT2; Adipocyte; Adipogenesis; Atomic force microscopy (AFM); BSCL2; Lipid synthesis; Lipin; Lipodystrophy; Seipin.


Figures

Figure 1
Figure 1
Seipin can associate with AGPAT2 in intact cells. (A) HEK293 cells were transfected with AGPAT2-Myc in the presence or absence of either the short (sht) or long (lg) translation of FLAG-seipin. Lysates and anti-FLAG immunoprecipitated proteins were separated by SDS-PAGE and immunoblotted with antibodies to FLAG and Myc. Lysates were probed for calnexin as a loading control. (B) HEK293 cells were transfected with FLAG-AGPAT2 in the absence or presence of either wild-type Myc-seipin (WT) or mutants lacking the N terminus (ΔNT), first transmembrane domain (ΔTM1), ER luminal loop region (ΔLP), second transmembrane domain (ΔTM2), or the C terminus (ΔCT). Lysates or anti-FLAG immunoprecipitates were immunoblotted for FLAG, Myc and calnexin. (C) Quantification of the interaction of mutant vs wild-type seipin from replicate experiments shown in (B). Data are means ± SEM (n = 3). ** indicates p < 0.01, *** indicates p < 0.001 versus co-immunoprecipitation with wild-type seipin. (D) HEK293 cells were co-transfected with constructs in which the N-terminal fragment of YFP was fused to the N terminus (Yn-S) or the C terminus (S-Yn) of seipin and constructs in which the C-terminal fragment of YFP was fused to either the N terminus (Yc-A) or the C terminus (A-Yc) of AGPAT2-Myc. Following a temperature shift to induce the formation of reconstituted YFP, cells were fixed and stained for AGPAT2-Myc (red) and DAPI to label nuclei. The direct interaction between seipin and AGPAT2 is indicated by the presence of a YFP signal (yellow). Scale bars, 10 μm. (E) Quantified BiFC signal intensity. Errors are SEM (n = 3). *** indicates difference from A-Yc/S-Yn (p < 0.001). (F) Representative immunoblot using anti-Myc antibody to detect Yc-AGPAT2 and AGPAT2-Yc expression, showing calnexin as a loading control.
Figure 2
Figure 2
Seipin can interact with AGPAT2 in differentiating adipocytes and potentiate adipogenesis. (A) 3T3-L1 preadipocytes were induced to differentiate and immediately co-transfected with FLAG-seipin-Yn and Myc-AGPAT2-Yc. Cells were fixed after three days of differentiation, and anti-FLAG or anti-Myc antibodies in combination with Alexa Fluor 594 secondary antibodies were used to immunodetect FLAG-seipin-Yn or Myc-AGPAT2-Yc, respectively, as indicated. Identically transfected cells were used to co-immunostain for FLAG-seipin-Yn and Myc-AGPAT2-Yc (lower panels). Note that these cells were not temperature shifted, preventing the formation of YFP which would otherwise confound the Alexa Fluor488 fluorescence of the secondary antibody used to detect the FLAG epitope. Scale bars, 10 μm. (B) 3T3-L1 preadipocytes were induced to differentiate and immediately co-transfected with FLAG-seipin-Yn and Myc-AGPAT2-Yc, as in (A). Following a temperature shift to induce the stable formation of reconstituted YFP, cells were fixed at day 3 of differentiation and stained for PPARγ (red) and DAPI to label nuclei. The direct interaction between seipin and AGPAT2 is indicated by the presence of a YFP signal (yellow). Scale bars, 10 μm. (C) Quantified PPARγ signal intensity in BiFC-negative (BiFC −ve) and BiFC-positive (BiFC +ve) cell nuclei. Intensity of PPARγ staining was determined in 100 nuclei each of BiFC-negative and BiFC-positive cells in 3 separate experiments, and mean intensity values were determined for each experiment. Errors are SEM (n = 3). *** indicates difference from BiFC-positive cell nuclei (p < 0.001). (D) 3T3-L1 preadipocytes were induced to differentiate, immediately co-transfected with FLAG-seipin (with no Yn) and Myc-AGPAT2-Yc and otherwise treated exactly as those in (B). Cells were fixed at day 3 of differentiation and stained for Myc to identify transfected cells, PPARγ and DAPI to label nuclei. Scale bars, 10 μm. (E) Quantified PPARγ signal intensity in the nuclei of untransfected versus transfected cells. Intensity of PPARγ staining was determined in 100 nuclei each of transfected versus untransfected cells in 3 separate experiments and mean intensity values were determined for each experiment. Errors are SEM (n = 3). ** indicates difference from untransfected cell nuclei (p < 0.01). (F) Lysates of cells transfected with Myc-AGPAT2-Yc and either FLAG-seipin-Yn or FLAG-seipin as in (B) and (D) were immunoblotted for AGPAT2 and seipin using anti-Myc and anti-FLAG antibodies, respectively, to determine the relative levels of each protein. Samples were also probed for calnexin as a loading control.
Figure 2
Figure 2
Seipin can interact with AGPAT2 in differentiating adipocytes and potentiate adipogenesis. (A) 3T3-L1 preadipocytes were induced to differentiate and immediately co-transfected with FLAG-seipin-Yn and Myc-AGPAT2-Yc. Cells were fixed after three days of differentiation, and anti-FLAG or anti-Myc antibodies in combination with Alexa Fluor 594 secondary antibodies were used to immunodetect FLAG-seipin-Yn or Myc-AGPAT2-Yc, respectively, as indicated. Identically transfected cells were used to co-immunostain for FLAG-seipin-Yn and Myc-AGPAT2-Yc (lower panels). Note that these cells were not temperature shifted, preventing the formation of YFP which would otherwise confound the Alexa Fluor488 fluorescence of the secondary antibody used to detect the FLAG epitope. Scale bars, 10 μm. (B) 3T3-L1 preadipocytes were induced to differentiate and immediately co-transfected with FLAG-seipin-Yn and Myc-AGPAT2-Yc, as in (A). Following a temperature shift to induce the stable formation of reconstituted YFP, cells were fixed at day 3 of differentiation and stained for PPARγ (red) and DAPI to label nuclei. The direct interaction between seipin and AGPAT2 is indicated by the presence of a YFP signal (yellow). Scale bars, 10 μm. (C) Quantified PPARγ signal intensity in BiFC-negative (BiFC −ve) and BiFC-positive (BiFC +ve) cell nuclei. Intensity of PPARγ staining was determined in 100 nuclei each of BiFC-negative and BiFC-positive cells in 3 separate experiments, and mean intensity values were determined for each experiment. Errors are SEM (n = 3). *** indicates difference from BiFC-positive cell nuclei (p < 0.001). (D) 3T3-L1 preadipocytes were induced to differentiate, immediately co-transfected with FLAG-seipin (with no Yn) and Myc-AGPAT2-Yc and otherwise treated exactly as those in (B). Cells were fixed at day 3 of differentiation and stained for Myc to identify transfected cells, PPARγ and DAPI to label nuclei. Scale bars, 10 μm. (E) Quantified PPARγ signal intensity in the nuclei of untransfected versus transfected cells. Intensity of PPARγ staining was determined in 100 nuclei each of transfected versus untransfected cells in 3 separate experiments and mean intensity values were determined for each experiment. Errors are SEM (n = 3). ** indicates difference from untransfected cell nuclei (p < 0.01). (F) Lysates of cells transfected with Myc-AGPAT2-Yc and either FLAG-seipin-Yn or FLAG-seipin as in (B) and (D) were immunoblotted for AGPAT2 and seipin using anti-Myc and anti-FLAG antibodies, respectively, to determine the relative levels of each protein. Samples were also probed for calnexin as a loading control.
Figure 3
Figure 3
AFM analysis of AGPAT2 and its interaction with seipin. (A) FLAG-AGPAT2 was expressed in tsA 201 cells and isolated using anti-FLAG immunoaffinity chromatography. Isolated protein was analyzed by SDS-PAGE followed by either silver staining (left panel) or immunoblotting using an anti-FLAG antibody (right panel). The position of AGPAT2 is indicated at the left, and molecular mass markers (kDa) are shown at the right. (B) Gallery of zoomed AFM images showing individual isolated AGPAT2 particles. Scale bar, 25 nm; height scale, 0–1 nm. (C) Frequency distribution of volumes of the AGPAT2 particles. The curve indicates the fitted Gaussian function. The peak of the distribution (±SEM) is indicated. (D) FLAG-seipin-Myc and FLAG-AGPAT2 were co-expressed in tsA 201 cells and proteins were isolated using anti-Myc immunoaffinity chromatography. Isolated protein was analyzed by SDS-PAGE followed by immunoblotting using either anti-Myc (top panel) or anti-FLAG (bottom panel) antibodies. The positions of seipin and AGPAT2 are indicated at the left, and molecular mass markers (kDa) are shown at the right. The bottom panel shows immunoprecipitated AGPAT2 and AGPAT2 expressed alone. (E) Control experiment in which two batches of cells separately expressing either FLAG-seipin-Myc or FLAG-AGPAT2 were mixed immediately before solubilization, followed by anti-Myc immunoaffinity chromatography. Samples of both total cell lysate and immunoprecipitate were immunoblotted using either anti-Myc (top panel) or anti-FLAG (bottom panel) antibodies. (F) Low-magnification AFM image of isolated proteins. Arrowheads indicate large particles (seipin), each decorated by two smaller particles (AGPAT2). Scale bar, 100 nm; height scale, 0–2 nm. (G) Gallery of zoomed images showing seipin particles decorated by either one (top panels), two (center panels) or three (bottom panels) AGPAT2 particles. Scale bar, 25 nm; height scale, 0–2 nm. (H) Frequency distribution of volumes of the smaller (AGPAT2) particles. The curve indicates the fitted Gaussian function. The peak of the distribution (±SEM) is indicated. (I) Frequency distribution of volumes of the larger (seipin) particles. (J) Frequency distribution of angles between pairs of bound AGPAT2 particles.
Figure 4
Figure 4
AFM analysis of lipin 1 and its interaction with seipin. (A) HA-lipin 1α was expressed in tsA 201 cells and isolated using anti-HA immunoaffinity chromatography. Isolated protein was analyzed by SDS-PAGE followed by either silver staining (left panel), or immunoblotting using either an anti-lipin 1 antibody (center panel) or an anti-HA antibody (right panel). The position of lipin 1 is indicated at the left, and molecular mass markers (kDa) are shown at the right. (B) Gallery of zoomed AFM images showing individual isolated lipin 1α particles. Scale bar, 25 nm; height scale, 0–1 nm. (C) Frequency distribution of volumes of the lipin 1α particles. The curve indicates the fitted Gaussian function. The peak of the distribution (±SEM) is indicated. (D) FLAG-seipin-Myc and HA-lipin 1α were co-expressed in tsA 201 cells and proteins were isolated using anti-Myc immunoaffinity chromatography. Isolated protein was analyzed by SDS-PAGE followed by immunoblotting using either anti-FLAG (left panel) or anti-lipin 1 (right panel) antibodies. Molecular mass markers (kDa) are shown at the right. (E) Control experiment in which two batches of cells separately expressing either FLAG-seipin-Myc or HA-lipin 1α were mixed immediately before solubilization, followed by anti-Myc immunoaffinity chromatography. Samples of both total cell lysate and immunoprecipitate were immunoblotted using either anti-FLAG (top panel) or anti-lipin 1 (bottom panel) antibodies. (F) Low-magnification AFM image of isolated proteins. The arrowhead indicates a large particle (seipin) decorated by two smaller particles (lipin 1α). Scale bar, 100 nm; height scale, 0–2 nm. (G) Gallery of zoomed images showing seipin particles decorated by either one (top panels) or two (bottom panels) lipin 1 particles. Scale bar, 25 nm; height scale, 0–2 nm. (H) Frequency distribution of volumes of the smaller (lipin 1) particles. The curve indicates the fitted Gaussian function. The peak of the distribution (±SEM) is indicated. (I) Frequency distribution of volumes of the larger (seipin) particles. (J) Frequency distribution of angles between pairs of bound lipin 1 particles.
Figure 5
Figure 5
Seipin forms a triple complex with AGPAT2 and lipin 1. (A) Seipin-Myc, FLAG-AGPAT2 and HA-lipin 1α were co-expressed in tsA 201 cells. A detergent extract of the cells was subjected to sequential anti-FLAG (IP1) and anti-Myc (IP2) immunoaffinity chromatography steps. Isolated protein was analyzed by SDS-PAGE followed by immunoblotting using either anti-Myc (seipin; top panels), anti-FLAG (AGPAT2; centre panels) or anti-lipin 1 (bottom panels) antibodies. The positions of the three proteins are indicated at the left, and molecular mass markers (kDa) are shown at the right. (B) Control experiment in which three batches of cells separately expressing either seipin-Myc, FLAG-AGPAT2 or HA-lipin 1α were mixed immediately before solubilization, followed by anti-Myc immunoaffinity chromatography. Samples of both total cell lysate and immunoprecipitate were immunoblotted using either anti-Myc (top panel), anti-FLAG (centre panel) or anti-lipin 1 (bottom panel) antibodies. The positions of seipin, AGPAT2 and lipin 1 are indicated at the left, and molecular mass markers (kDa) are shown at the right. (C) Low-magnification AFM image of proteins isolated using sequential immunoaffinity chromatography, as in (A). The arrowhead indicates a large particle (seipin) decorated by two differently-sized smaller particles (AGPAT2 and lipin 1). Scale bar, 100 nm; height scale, 0–2 nm. (D) Gallery of zoomed images showing seipin particles decorated by two differently-sized smaller particles. Scale bar, 25 nm; height scale, 0–2 nm. (E) Frequency distribution of volumes of the smaller particles (AGPAT2 and lipin 1). The curve indicates the fitted Gaussian functions. The peaks of the distribution (±SEM) are indicated. (F) Frequency distribution of the larger (seipin) particles. (G) Frequency distribution of angles between pairs of bound smaller particles. (H) tsA 201 cells were co-transfected with FLAG-AGPAT2 and HA-lipin 1α in the absence or presence of wild-type seipin (WT) or seipin lacking either the cytoplasmic C-terminus (ΔCT) or the first transmembrane domain (ΔTM1). FLAG-AGPAT2 was immunoprecipitated and lysates or immunoprecipitates (IP) were immunoblotted to determine the levels of FLAG-AGPAT2 and associated Myc-seipin or lipin 1α using anti-FLAG, anti-Myc and anti-lipin 1 antibodies, as indicated. (I) The levels of lipin 1α associated with immunoprecipitated AGPAT2 in the absence or presence of wild-type or mutant seipin proteins were determined in three independent experiments. Data shown are means ± SEM of co-precipitated lipin 1α normalized to levels of co-precipitated AGPAT2. ** indicates difference from levels of lipin 1 associated with AGPAT2 in the presence of WT seipin (p < 0.01).

References

    1. Agarwal A.K., Arioglu E., De Almeida S., Akkoc N., Taylor S.I., Bowcock A.M. AGPAT2 is mutated in congenital generalized lipodystrophy linked to chromosome 9q34. Nature Genetics. 2002;31:21–23. - PubMed
    1. Capeau J., Magre J., Caron-Debarle M., Lagathu C., Antoine B., Bereziat V. Human lipodystrophies: genetic and acquired diseases of adipose tissue. Endocrine Development. 2010;19:1–20. - PMC - PubMed
    1. Garg A., Agarwal A.K. Lipodystrophies: disorders of adipose tissue biology. Biochimica et Biophysica Acta. 2009;1791:507–513. - PMC - PubMed
    1. Magre J., Delepine M., Khallouf E., Gedde-Dahl T., Jr., Van Maldergem L., Sobel E. Identification of the gene altered in Berardinelli-Seip congenital lipodystrophy on chromosome 11q13. Nature Genetics. 2001;28:365–370. - PubMed
    1. Chen W., Yechoor V.K., Chang B.H., Li M.V., March K.L., Chan L. The human lipodystrophy gene product Berardinelli-Seip congenital lipodystrophy 2/seipin plays a key role in adipocyte differentiation. Endocrinology. 2009;150:4552–4561. - PMC - PubMed