. 2015 Mar 3;21(3):443-54.
doi: 10.1016/j.cmet.2015.02.009.

The mitochondrial-derived peptide MOTS-c promotes metabolic homeostasis and reduces obesity and insulin resistance

Affiliations

The mitochondrial-derived peptide MOTS-c promotes metabolic homeostasis and reduces obesity and insulin resistance

Changhan Lee et al. Cell Metab. .

Abstract

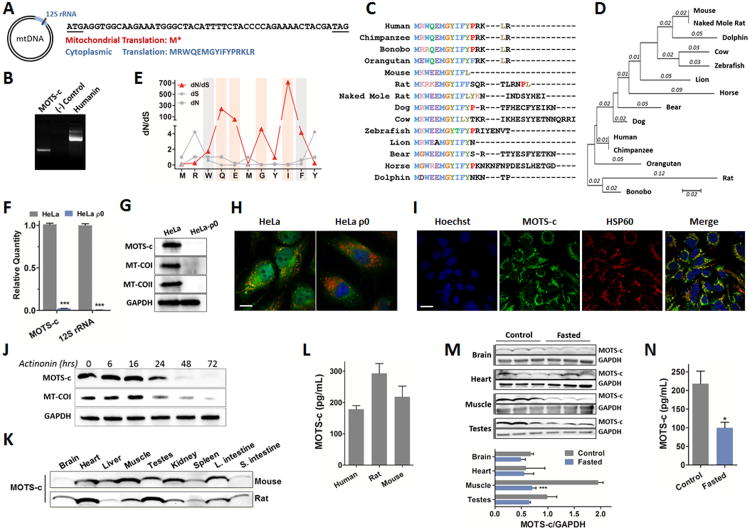
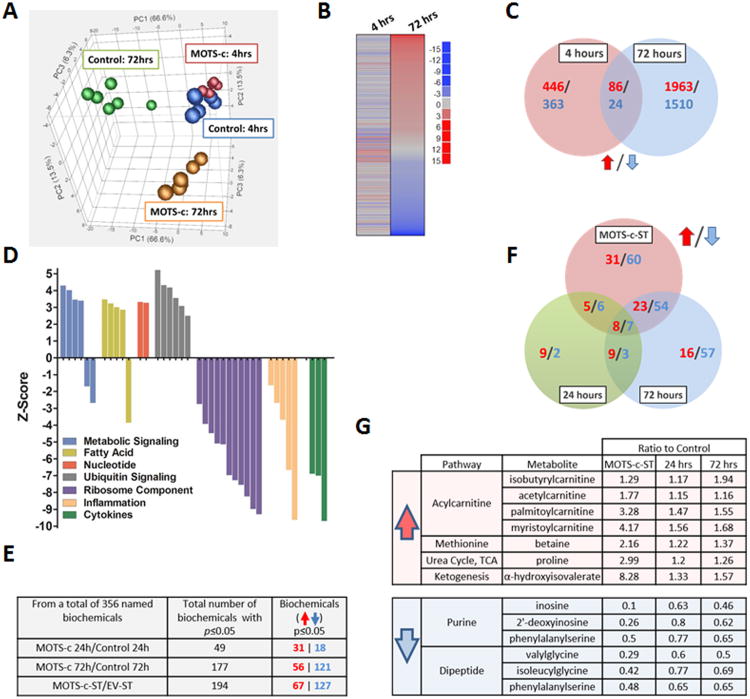
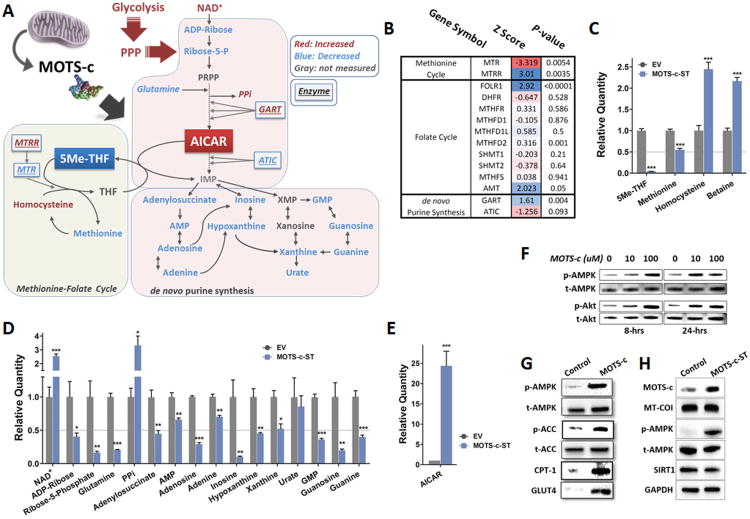
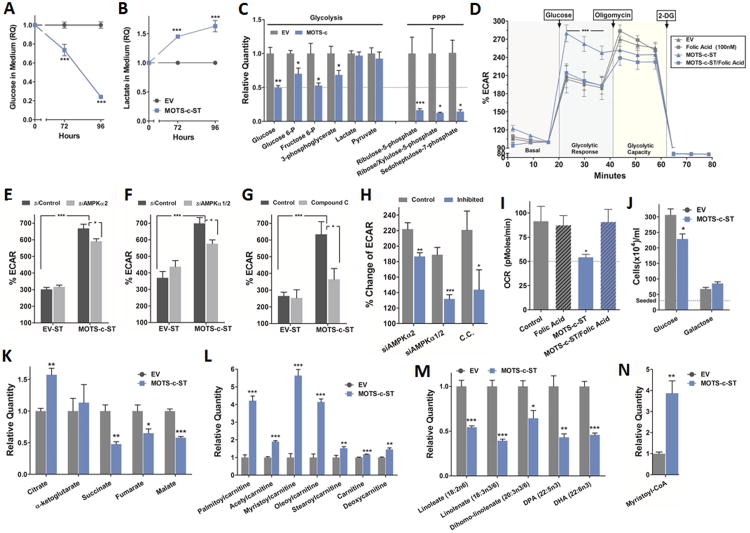
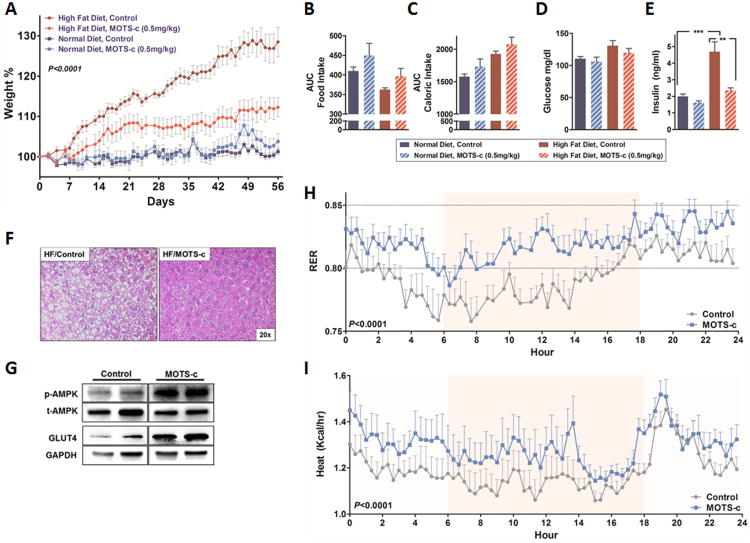
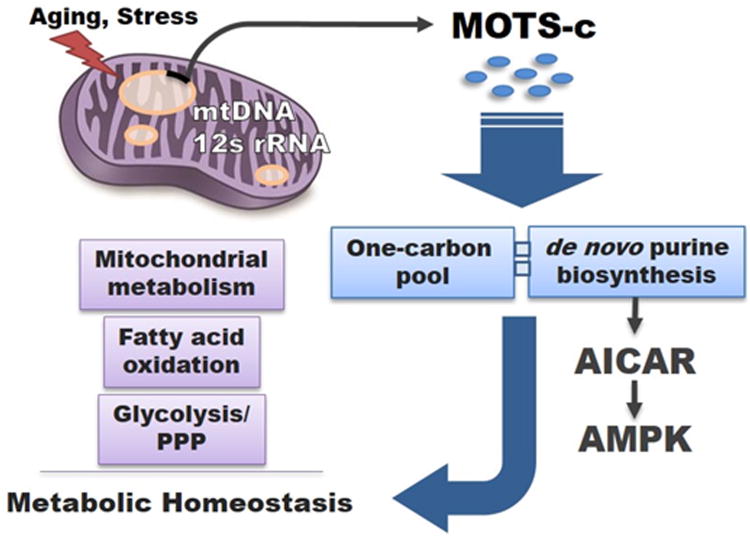
Mitochondria are known to be functional organelles, but their role as a signaling unit is increasingly being appreciated. The identification of a short open reading frame (sORF) in the mitochondrial DNA (mtDNA) that encodes a signaling peptide, humanin, suggests the possible existence of additional sORFs in the mtDNA. Here we report a sORF within the mitochondrial 12S rRNA encoding a 16-amino-acid peptide named MOTS-c (mitochondrial open reading frame of the 12S rRNA-c) that regulates insulin sensitivity and metabolic homeostasis. Its primary target organ appears to be the skeletal muscle, and its cellular actions inhibit the folate cycle and its tethered de novo purine biosynthesis, leading to AMPK activation. MOTS-c treatment in mice prevented age-dependent and high-fat-diet-induced insulin resistance, as well as diet-induced obesity. These results suggest that mitochondria may actively regulate metabolic homeostasis at the cellular and organismal level via peptides encoded within their genome.


Figures

Figure 1
Figure 1. Identification of a novel expressed short open reading frame (sORF) encoded within the mitochondrial genome
(A) MOTSC is encoded as a 51-bp short open reading frame (sORF) in the mitochondrial 12S rRNA. The mitochondrial genetic code yields tandem start/stop codons, whereas the cytoplasmic genetic code yields a viable peptide. (B) 3′ rapid amplification of cDNA ends (3′ RACE) of polyadenylated MOTS-c and humanin transcripts. (C-E) Phylogenetic analysis of MOTS-c with (C) multiple peptide sequence alignment in 14 species, and (D) its phylogenetic tree and branch length (estimated number of substitutions per site), and (E) the rate of non-synonymous (dN) and synonymous substitutions (dS), and their ratio (dN/dS) for the first well-conserved 11 residues of MOTS-c. The red bars represent residues that evolved under significant positive selection and the grey bars those under significant purifying selection. (F-H) HeLa-ρ0 cells are devoid of mitochondrial DNA. HeLa cells vs HeLa-ρ0 La cells: (F) 12S rRNA and MOTS-c transcripts by qRT-PCR, (G) MOTS-c peptide and mitochondrial-encoded cytochrome C oxidase I and II (MT-COI/II) protein, and nuclear-encoded GAPDH by immunoblotting, (H) MOTS-c (green), mitochondrial resident HSP60 (red), and nucleus (blue) by immunocytochemistry (ICC). Scale bar, 100-μm. (I) MOTS-c (green), HSP60 (red), and nucleus (blue) immunostaining in HEK293 cells. Scale bar, 20-μm. (J) Time-course detection of MOTS-c and MT-COI after treating with actinonin (150μM), which causes mitochondrial RNA degradation. (K-L) MOTS-c is detected in (K) various tissues in mice and rats and (L) circulation (plasma) in humans and rodents. (M-N) Fasting alters expression of endogenous MOTS-c in (M) tissues and (N) plasma in mice. Data shown as mean ± SEM. Student's t-test. *P<0.05, **P<0.01, ***P<0.001. See also Figure S1 and Table S1 for additional information on MOTS-c and validation for Western blotting, ICC, and ELISA.
Figure 2
Figure 2. MOTS-c is a bioactive peptide that regulates gene expression and cellular metabolism
(A to D) Microarray analyses on HEK293 cells treated with MOTS-c (10 μM) for 4- and 72-hours (N=6). (A) Principal component analysis (PCA), (B) Parametric analysis of gene set enrichment (PAGE) relative to control cells at the same time point, (C) Venn diagram depicting upregulated (Red) and downregulated (Blue) genes per time point. (D) Gene ontology analysis on HEK293 cells treated with MOTS-c for 72-hours. (E-G) Global unbiased metabolomics on HEK293 cells treated with MOTS-c (10 μM) for 24-and 72-hours or stably transfected with MOTS-c (MOTS-c-ST) or empty vector (EV-ST) (N=5). Welch's two sample t-test. (E) Total number of significantly or near-significantly changed metabolites. (F) Venn diagram depicting upregulated (Red) and downregulated (Blue) metabolites in MOTS-c-ST cells and HEK293 cells treated with MOTS-c for 24-and 72-hours compared to their controls. (G) List of metabolites that were consistently altered in all 3 groups. See also Table S2.
Figure 3
Figure 3. MOTS-c targets the methionine-folate cycle, increases AICAR levels, and activates AMPK
(A-B) The effect of ‘gain-of-function’ of MOTS-c on the folate-methionine cycle and de novo purine biosynthesis in MOTS-c-ST cells. (A) Metabolites were measured by mass spectrometry (N=5). (B) Enzymes altered 4-hours after MOTS-c treatment were determined by microarray (N=6). GART: phosphoribosylglycinamide formyltransferase (a trifunctional enzyme) ATIC: AICAR transformylase IMP carboxylase (a bifunctional enzyme), MTR: 5-methyltetrahydrofolate-homocysteine methyltransferase, MTRR: MTR reductase, 5Me-THF: 5-methyl-tetrahydrofolate, AICAR: 5-aminoimidazole-4-carboxamide ribonucleotide. (C) 5Me-THF and the methionine cycle intermediates in MOTS-c-ST cells (N=5). (D) Metabolic intermediates of the de novo purine biosynthesis pathway in MOTS-c-ST cells (N=5). (E) AICAR levels in MOTS-c-ST cells measured by mass spectrometry (N=5). (F) MOTS-c promotes AMPK (Thr172) and Akt (Ser473) phosphorylation in a time- and dose-dependent manner in HEK293 cells. (G) AMPK phosphorylation and its downstream pathways that control fatty acid oxidation (ACC and CPT-1) 72-hours after MOTS-c treatment (10 μM) in HEK293 cells. (H) MOTS-c-ST cells have higher levels of MOTS-c and phosphorylation of AMPK, but no changes in MT-COI, SIRT1, and GAPDH levels. Data shown as mean ± SEM. Student's t-test. *P<0.05, **P<0.01, ***P<0.001. See also Figure S2 for data on exogenous MOTS-c treatment and NAD+/NADH and adenine derivatives.
Figure 4
Figure 4. MOTS-c coordinates cellular glucose, mitochondrial, and fatty acid metabolism
Extracellular (A) glucose and (B) lactate in the culture medium of MOTS-c-ST cells (N=6). (C) Intracellular metabolites of glycolysis and the pentose phosphate pathway (PPP) in MOTS-c-ST cells (N=5). Cells were seeded and allowed to acclimate for 72 hours prior to collection, at which time they were 90-95% confluent. (D) Real-time glycolytic flux determined by extracellular acidification rate (ECAR) in MOTS-c-ST cells treated with folic acid (100nM) for 72 hours (N=6). (E-H) Glucose-stimulated real-time glycolytic measurements in MOTS-c-ST cells treated with (E) siRNA against AMPKα2 (48-hours), or (F) siRNA against AMPKα1/2 (48-hours), or (G) compound C (10μM) (24-hours) and (H) the relative percent changes of ECAR of each treated groups to their corresponding controls in (E-G). (I) Real-time oxygen consumption rate (OCR) in MOTS-c-ST cells treated with folic acid (100nM) for 72 hours (N=6). All values normalized against DNA content. (J) MOTS-c-ST cell proliferation after 72 hours under equimolar (25mM) glucose or galactose medium (N=6). (K) Tricarboxylic acid (TCA) cycle intermediates in MOTS-c-ST cells (N=5). (L) Acyl-carnitine shuttle levels, (M) essential fatty acid levels, and (N) the β-oxidation intermediate myristoyl-CoA levels in MOTS-c-ST cells (N=5). Data shown as mean ± SEM. Student's t-test. *P<0.05, **P<0.01, ***P<0.001. See also Figures S3 and S4 for data on exogenous MOTS-c treatment, null MOTS-c mutants and non-specific scrambled MOTS-c peptide, and the role of SIRT1 in mediating the glycolytic effects of MOTS-c.
Figure 5
Figure 5. MOTS-c targets skeletal muscle and regulates insulin sensitivity in mice
(A) Intraperitoneal glucose tolerance test (1g/kg glucose) in male C57BL/6 mice after MOTS-c treatment (5 mg/kg/day; IP) for 7 days (N=7). (B to E) Euglycemic-hyperglycemic clamps on C57BL/6 mice fed a high-fat diet (60% by calories) and treated with MOTS-c (5 mg/kg/day; IP) for 7 days (N=6-8). (B) Glucose infusion rate (GIR), reflecting whole body insulin sensitivity, (C) insulin-stimulated glucose disposal rate (IS-GDR), primarily reflecting skeletal muscle insulin sensitivity, and (D) hepatic glucose production (HGP). (E) Akt activation (assessed by phosphorylation at Ser473) and MOTS-c levels were detected in the insulin-stimulated skeletal muscles obtained at the end of the hyperinsulinemic-euglycemic clamp. (F and G) MOTS-c levels in young (4-month) and aged (32-month) mice (N=3-4) decline in (F) skeletal muscle, and (G) circulation (serum). (H) Insulin-stimulated (60 μU/ml) 2-deoxyglucose uptake into soleus muscles of young (3-month) and middle-aged (12-month) male C57BL/6 mice after MOTS-c treatment (5 mg/kg/day; IP) for 7 days (N=6). (I-K) Differentiated mature rat L6 myotubes that stably over-express MOTS-c (L6-MOTS-c-ST) show (I) accelerated media glucose clearance, (J) enhanced glucose-stimulated glycolytic response, and (K) maximum glycolytic capacity estimated by oligomycin treatment. Data shown as mean ± SEM. Student's t-test. *P<0.05, **P<0.01, ***P<0.001. See also Table S3.
Figure 6
Figure 6. MOTS-c treatment prevents high fat diet-induced obesity and insulin resistance in mice
8-week old male CD-1 mice fed a high fat diet (HFD, 60% by calories) or matched control diet (N=10) treated with MOTS-c daily (0.5 mg/kg/day; IP) for 8 weeks. (A) body weight, (B) food intake, (C) caloric intake, (D) glucose levels, (E) insulin levels determined at the time of euthanasia, (F) liver H&E staining, and (G) AMPK phosphorylation (Thr172) and GLUT4 levels in the skeletal muscles of HFD-fed mice treated with MOTS-c or vehicle control. (H-I) Respiratory exchange ratio (RER) and body heat production values of 8-week old male CD-1 mice fed a high fat diet (HFD, 60% by calories) or matched control diet treated with MOTS-c daily (0.5 mg/kg/day; IP) for 3 weeks (N=6). Data shown as mean ± SEM. (A, H, and I) Repeated measures two-way ANOVA and (B-E) Student's t-test. **P<0.01, ***P<0.001. See also Figure S6 for total activity and Figure S7 for similar data in C57BL/6 mice.
Figure 7
Figure 7. MOTS-c: mitochondrial-encoded regulator of metabolic homeostasis
Proposed model of MOTS-c as a mitochondrial signaling peptide encoded in the mtDNA that regulates metabolic homeostasis. MOTS-c targets the skeletal muscle and acts on the folate cycle (one carbon pool) and inhibits the directly tethered de novo purine biosynthesis pathway. This leads to the accumulation of the de novo purine synthesis intermediate AICAR that is also a potent activator of the metabolic regulator AMPK, thus partially mediating the metabolic effects of MOTS-c.

Comment in

References

    1. Altschul SF, Madden TL, Schaffer AA, Zhang J, Zhang Z, Miller W, Lipman DJ. Gapped BLAST and PSI-BLAST: a new generation of protein database search programs. Nucleic acids research. 1997;25:3389–3402. - PMC - PubMed
    1. Amikura R, Kashikawa M, Nakamura A, Kobayashi S. Presence of mitochondria-type ribosomes outside mitochondria in germ plasm of Drosophila embryos. Proceedings of the National Academy of Sciences of the United States of America. 2001;98:9133–9138. - PMC - PubMed
    1. Attardi G, Attardi B. Mitochondrial origin of membrane-associated heterogeneous RNA in HeLa cells. Proceedings of the National Academy of Sciences of the United States of America. 1968;61:261–268. - PMC - PubMed
    1. Bratic A, Larsson NG. The role of mitochondria in aging. The Journal of clinical investigation. 2013;123:951–957. - PMC - PubMed
    1. Cabreiro F, Au C, Leung KY, Vergara-Irigaray N, Cocheme HM, Noori T, Weinkove D, Schuster E, Greene ND, Gems D. Metformin retards aging in C. elegans by altering microbial folate and methionine metabolism. Cell. 2013;153:228–239. - PMC - PubMed

Publication types

MeSH terms

Associated data