. 2015;6(1):55-65.
doi: 10.1080/19491034.2014.1003745.

Chromosome conformation of human fibroblasts grown in 3-dimensional spheroids

Affiliations

Chromosome conformation of human fibroblasts grown in 3-dimensional spheroids

Haiming Chen et al. Nucleus. 2015.

Erratum in

  • Corrigendum.
    [No authors listed] [No authors listed] Nucleus. 2016 Apr 29;7(2):232. doi: 10.1080/19491034.2016.1167418. eCollection 2016. Nucleus. 2016. PMID: 31265700 Free PMC article.

Abstract

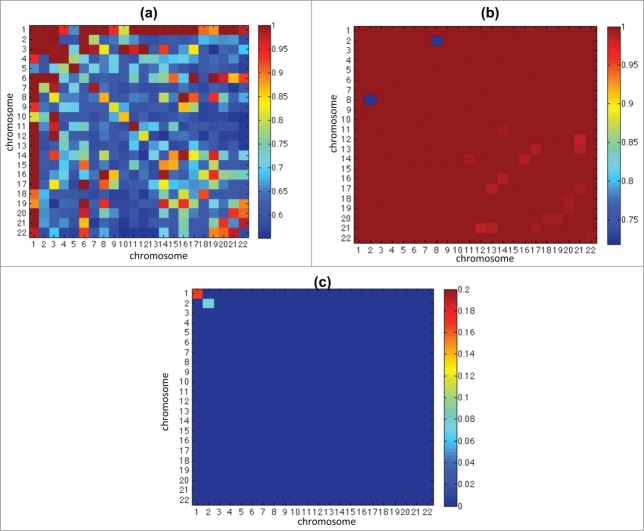
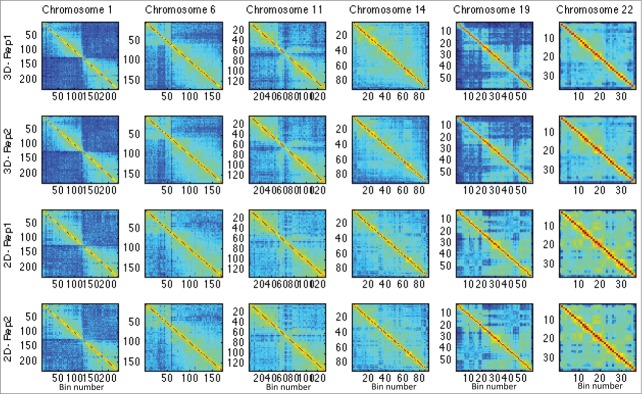
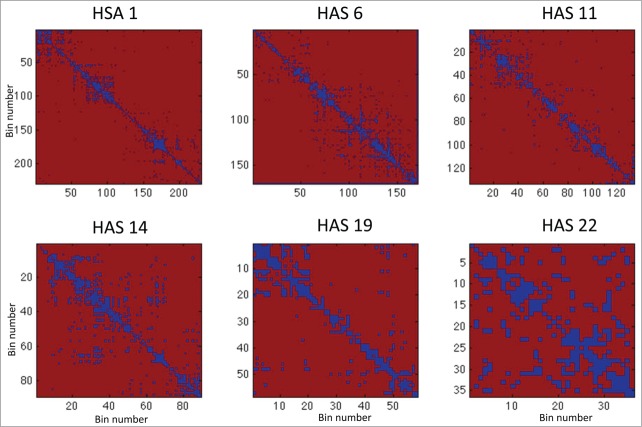
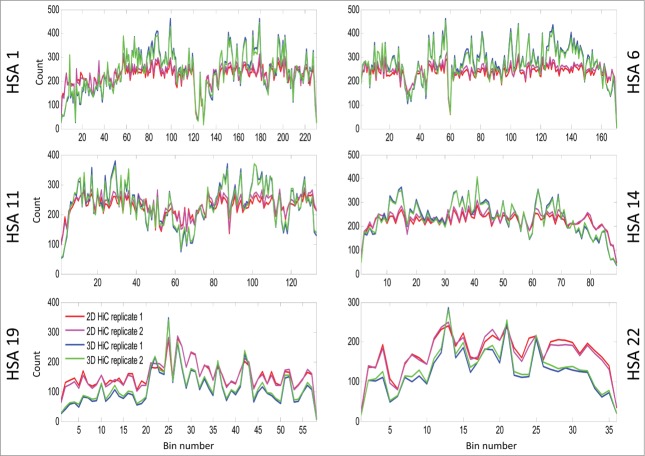
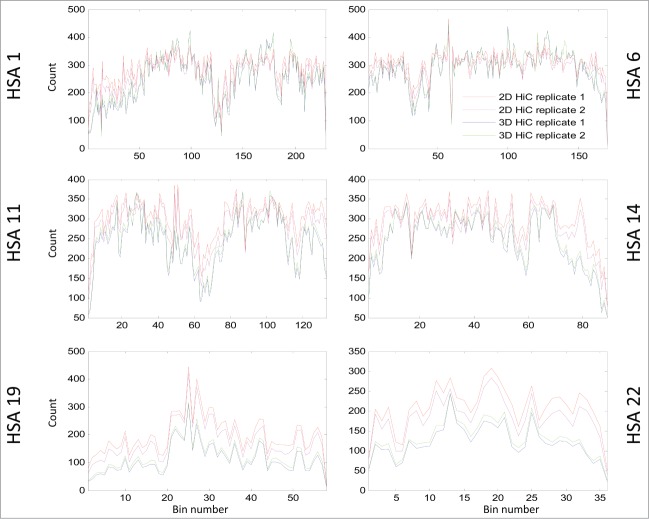
In the study of interphase chromosome organization, genome-wide chromosome conformation capture (Hi-C) maps are often generated using 2-dimensional (2D) monolayer cultures. These 2D cells have morphological deviations from cells that exist in 3-dimensional (3D) tissues in vivo, and may not maintain the same chromosome conformation. We used Hi-C maps to test the extent of differences in chromosome conformation between human fibroblasts grown in 2D cultures and those grown in 3D spheroids. Significant differences in chromosome conformation were found between 2D cells and those grown in spheroids. Intra-chromosomal interactions were generally increased in spheroid cells, with a few exceptions, while inter-chromosomal interactions were generally decreased. Overall, chromosomes located closer to the nuclear periphery had increased intra-chromosomal contacts in spheroid cells, while those located more centrally had decreased interactions. This study highlights the necessity to conduct studies on the topography of the interphase nucleus under conditions that mimic an in vivo environment.

Keywords: 3-dimensional spheroids; chromatin; chromosome conformation; chromosome territories; interphase nucleus.


Figures

Figure 1.
Figure 1.
The 4 diagonal matrices (3D rep1 and rep2, 2D rep1 and rep2) are the heatmaps that show the norms of portions of the Hi-C matrices after RPM (A) and ICE (B) application, after the centromeres are removed. Each pixel within these heatmaps represents a summary of an interaction between 2 chromosomes; each is obtained by taking the norm of the corresponding block from the Hi-C matrix and dividing by the length of the corresponding chromosomes. On the off-diagonal, the heatmaps show the absolute magnitude difference between the diagonal heatmaps, all on the same scale, so that these matrices are symmetric about the diagonal matrices. Color bars shown right of both (A) and (B) correspond to individual matrix diagonal values. Color bars shown below (A) and (B) correspond to individual matrix off-diagonal values. Note that the difference between replicates is relatively small compared to the difference between growth conditions.
Figure 2.
Figure 2.
This figure shows the p-values of the distribution test of intra- and inter-chromosome matrices between 2D and 3D cases (see Local Analysis under Materials and Methods). Fig. 2(a, b) shows the p-values of test within 2D and 3D replicates respectively, and shows there is no significant difference within replicates. Figure 3(c) shows that most blocks have very small p value, which implies significant difference.
Figure 3.
Figure 3.
This figure shows the Hi-C matrices (interactions) in 2D and 3D cases for chromosomes HSA 1, 6, 11, 14, 19, and 22.
Figure 4.
Figure 4.
This figure shows the component-wise significance level test for equality of means between Hi-C matrices from 3D spheroids and 2D cells. Shown in this heat map are intra-chromosome contact matrices for chromosomes HSA 1, 6, 11, 14, 19, 22. Dark blue represents the bins with significance level with adjusted P < 0.05.
Figure 5.
Figure 5.
This line plot shows the intra-bin Hi-C counts after RPM normalization within each mega base generated from 2D cells and 3D spheroids. On the X-axis are the coordinates of DNA sequence in mega base from pter to qter of each correspondence chromosome. The Y-axis indicates the diagonal bin counts. Lines in blue and cyan indicate counts for spheroids, and lines in red and magenta represent counts from 2D cells. Increased bin-wise counts in spheroids are seen in large regions on HSA 1, 6, 11, 14, and decreased bin-wise counts in spheroids are seen on HSA 19 and 22. If you want to include ICE figures, the figure legend will be nearly the same – simply indicate that ICE and RPM were applied before the analyses.
Figure 6.
Figure 6.
This line plot shows RPM normalized inter-bin mega base bin sums generated from 2D cells and 3D spheroids. This was calculated by taking the sum of counts in each bin with the diagonal removed. Globally decreased interaction are seen on all chromosomes displayed (HSA 1, 6, 11 14, 19, 22). On the X-axis are the coordinates of DNA sequence in mega base from pter to qter of each correspondence chromosome. The Y-axis indicates the bin counts. Lines in blue and cyan indicate counts for spheroids, and lines in red and magenta represent counts from 2D cells.

References

    1. Misteli T. Beyond the sequence: cellular organization of genome function. Cell 2007; 128:787-800; PMID:17320514; http://dx.doi.org/ 10.1016/j.cell.2007.01.028 - DOI - PubMed
    1. Rouquette J, Genoud C, Vazquez-Nin GH, Kraus B, Cremer T, Fakan S. Revealing the high-resolution three-dimensional network of chromatin and interchromatin space: a novel electron-microscopic approach to reconstructing nuclear architecture. Chromosome Res 2009; 17:801-10; PMID:19731052; http://dx.doi.org/ 10.1007/s10577-009-9070-x - DOI - PubMed
    1. Cremer T, Cremer M. Chromosome territories. Cold Spring Harb Perspect Biol 2010; 2:a003889; PMID:20300217; http://dx.doi.org/ 10.1101/cshperspect.a003889 - DOI - PMC - PubMed
    1. Rajapakse I, Groudine M. On emerging nuclear order. J Cell Biol 2011; 192:711-21; PMID:21383074; http://dx.doi.org/ 10.1083/jcb.201010129 - DOI - PMC - PubMed
    1. Takizawa T, Meaburn KJ, Misteli T. The meaning of gene positioning. Cell 2008; 135:9-13; PMID:18854147; http://dx.doi.org/ 10.1016/j.cell.2008.09.026 - DOI - PMC - PubMed

Publication types