. 2015 Mar 4;10(3):e0118991.
doi: 10.1371/journal.pone.0118991. eCollection 2015.

Co-prescription trends in a large cohort of subjects predict substantial drug-drug interactions

Affiliations

Co-prescription trends in a large cohort of subjects predict substantial drug-drug interactions

Jeffrey J Sutherland et al. PLoS One. .

Abstract

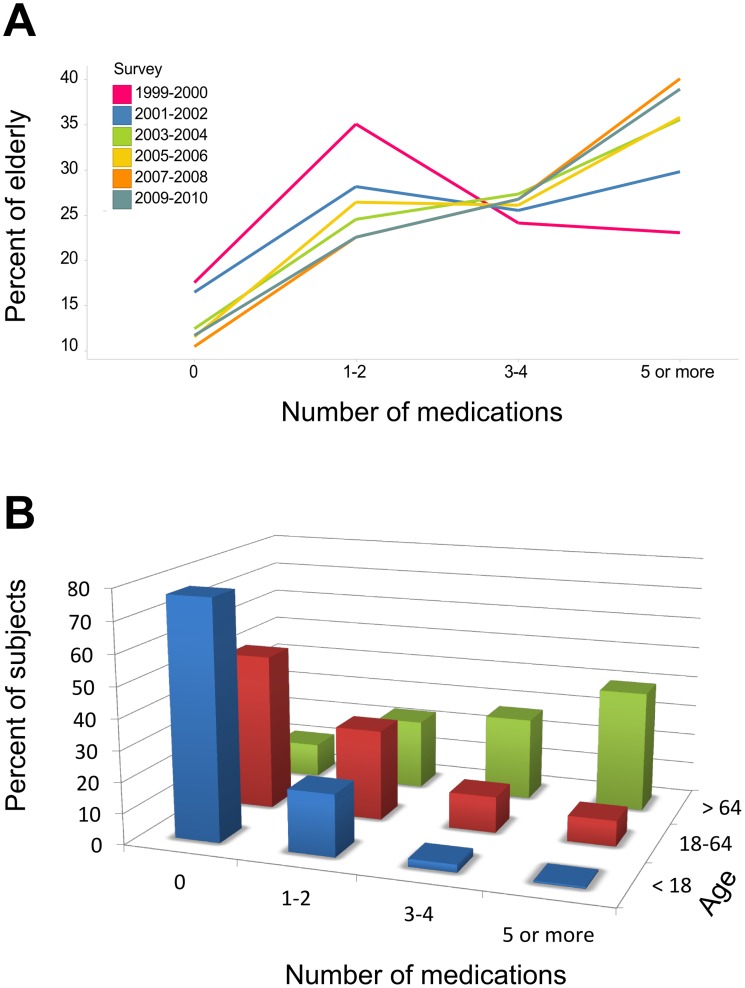
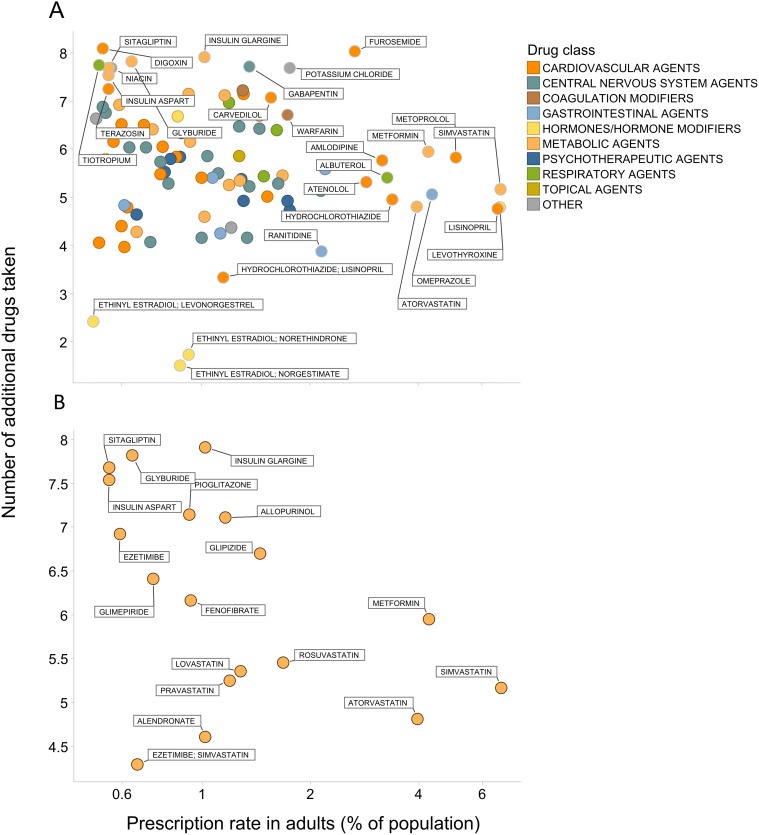
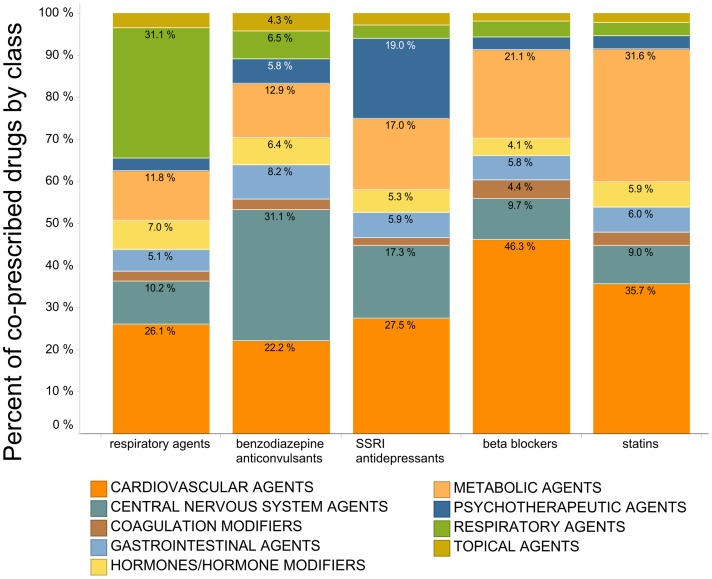
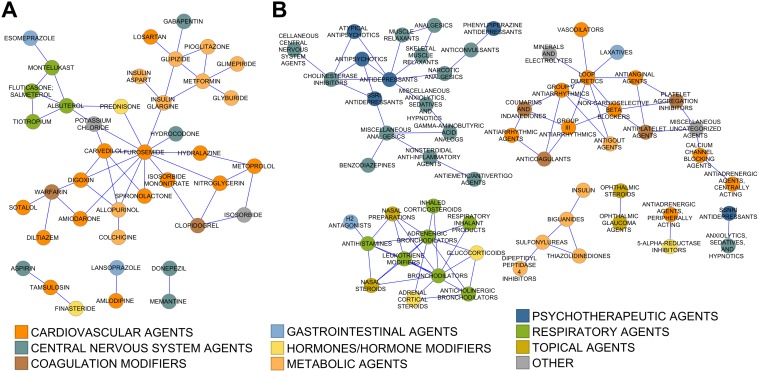
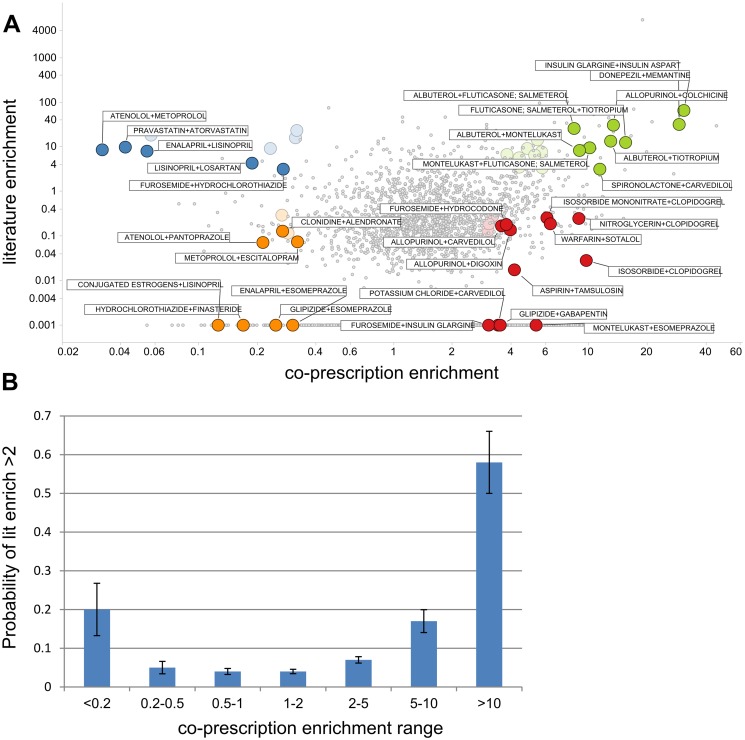
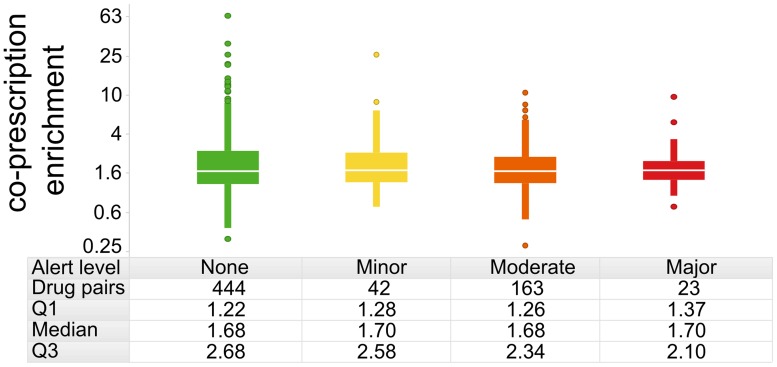
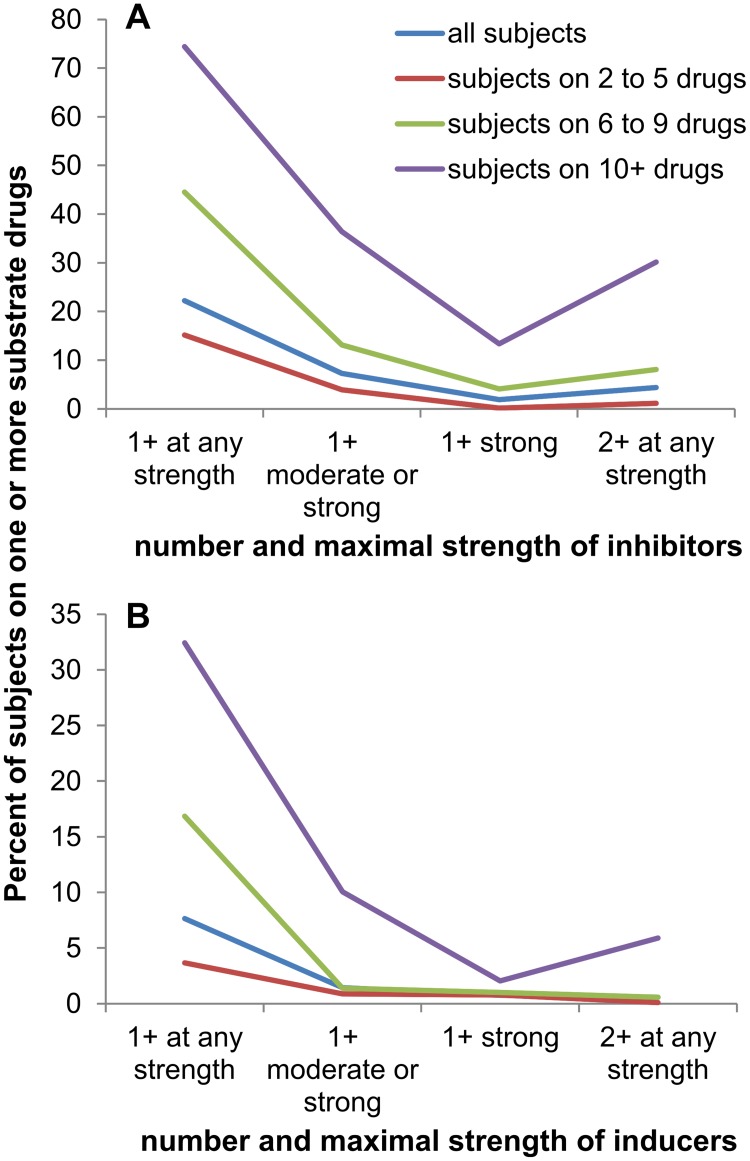
Pharmaceutical prescribing and drug-drug interaction data underlie recommendations on drug combinations that should be avoided or closely monitored by prescribers. Because the number of patients taking multiple medications is increasing, a comprehensive view of prescribing patterns in patients is important to better assess real world pharmaceutical response and evaluate the potential for multi-drug interactions. We obtained self-reported prescription data from NHANES surveys between 1999 and 2010, and confirm the previously reported finding of increasing drug use in the elderly. We studied co-prescription drug trends by focusing on the 2009-2010 survey, which contains prescription data on 690 drugs used by 10,537 subjects. We found that medication profiles were unique for individuals aged 65 years or more, with ≥98 unique drug regimens encountered per 100 subjects taking 3 or more medications. When drugs were viewed by therapeutic class, it was found that the most commonly prescribed drugs were not the most commonly co-prescribed drugs for any of the 16 drug classes investigated. We cross-referenced these medication lists with drug interaction data from Drugs.com to evaluate the potential for drug interactions. The number of drug alerts rose proportionally with the number of co-prescribed medications, rising from 3.3 alerts for individuals prescribed 5 medications to 11.7 alerts for individuals prescribed 10 medications. We found 22% of elderly subjects taking both a substrate and inhibitor of a given cytochrome P450 enzyme, and 4% taking multiple inhibitors of the same enzyme simultaneously. By examining drug pairs prescribed in 0.1% of the population or more, we found low agreement between co-prescription rate and co-discussion in the literature. These data show that prescribing trends in treatment could drive a large extent of individual variability in drug response, and that current pairwise approaches to assessing drug-drug interactions may be inadequate for predicting real world outcomes.


Conflict of interest statement

Competing Interests: The authors Jeffrey J. Sutherland, Xiong Liu, Keith Goldstein, Joseph A. Johnston, and Timothy P. Ryan are employed by commercial companies, Eli Lilly and Sano Informed Prescribing. This does not alter the authors’ adherence to PLOS ONE policies on sharing data and materials.

Figures

Fig 1
Fig 1. Prescription trends by age and NHANES survey period.
A) Percent of elderly subjects taking a given number of medications for each of the past five NHANES data releases. B) Number of prescriptions per person grouped by age for 10,537 subjects from the 2009–2010 NHANES survey. The average number of drugs prescribed per subject are 0.4, 1.4 and 4.1 for subjects <18 years, between 18 and 64 years and ≥65 years old, respectively.
Fig 2
Fig 2. Co-prescription rates relative to drug prescribing frequency.
Percent of adult subjects taking a given prescription medication (X-axis) vs. average number of co-taken drugs (Y-axis). Only medications taken by 0.5% of the adult population or more are shown. A) all drugs, B) only metabolic agents. The X-axis is shown on a log scale to improve clarity.
Fig 3
Fig 3. Co-prescription rates by therapeutic indication.
Co-prescribed drugs categorized by drug class for all adults in the 2009–2010 NHANES dataset. For the 3 most prescribed drugs in each of the five classes shown, the distribution of classes for additional co-prescribed drugs is shown. Color-coding by therapeutic indication is represented as indicated in legends. For clarity, the drug classes ‘alternative medicines’, ‘anti-infectives’, ‘antineoplastics’, ‘biologicals’, genitourinary tract agents’, ‘immunologic agents’, ‘miscellaneous agents’, ‘nutritional products’, taken by fewer than 10% of elderly subjects, are removed.
Fig 4
Fig 4. Network representation of coprescription enrichment.
Drug pairs (A) or drug subclasses (B) showing enriched co-prescription in the 2007–2008 and 2009–2010 NHANES surveys. Nodes represent drugs or drug subclasses, and edges connect drugs/drug classes with average enrichment ≥3 (i.e 3x more co-prescribed than expected) calculated over two surveys. In addition, the drug/subclass pair must have been observed in 5 or more subjects within each survey (methods).
Fig 5
Fig 5. Relationship between enrichment of drug co-discussion in Medline and co-prescription from NHANES 2007–2008 and 2009–2010 surveys.
Enrichment quantifies the extent to which a pair of drugs are co-discussed or co-prescribed more (enrichment >1) or less (enrichment <1) than expected if discussed/prescribed independently. A) co-prescription enrichment for 4032 drug pairs, arising from 133 drugs prescribed in ≥0.1% of the population for both surveys (and based on 5 or more actual subjects in each of the last two surveys) vs. co-discussion enrichment in the literature; values shown on log scale and enrichment of 0 in literature (i.e. no Medline records describing both drugs together) is arbitrary shown at 0.001 on the Y-axis. The listed drug pairs exemplify low/high co-prescription and co-discussion. Drug pairs co-prescribed >3x more than expected are exemplified in green and red; in addition to above criteria, these drug pairs are co-prescribed in 0.3 percent or more of the population based on 5 or more actual subjects reporting the use of both drugs in each of the last two surveys. Drug pairs co-prescribed >3x less than expected are exemplified in blue and orange; these drugs have individual prescription rates ≥1% in the last two surveys. B) Probability of co-discussion enrichment >2 when co-prescription enrichment is analyzed in ranges.
Fig 6
Fig 6. Enrichment in co-prescription rate vs. Drugs.com alert level.
The enrichment metric calculates whether a given drug pair is prescribed at a different rate than expected if the two drugs are used independently. For drug pairs that are actively avoided, enrichment values should be < 1. The enrichment metric is plotted on a log10 scale to normalize its distribution. None of the pairwise comparisons across alert categories are statistically significant (p > 0.05 via two-sided t-tests).
Fig 7
Fig 7. Prevalence of potential drug-drug interactions.
Percentage of elderly subjects taking a given number and/or strength of CYP inhibiting or inducing drugs in addition to one or more substrates for the affected CYP; 2+ at any strength indicates that a subject is taking two or more drugs which inhibit or induce CYPs metabolizing a given substrate. A) inhibitors, B) inducers

References

    1. Center of Disease Control and Prevention. Available: http://www.cdc.gov/nchs/fastats/drugs.htm. Accessed on 30 September 2014.
    1. IMS Health. Available: www.imshealth.com. Accessed on 30 September 2014.
    1. Gu QD, Burt VL. Prescription drug use continues to increase: U.S. prescription drug data for 2007–2008. NCHS Data Brief. 2010; 42: 1–8. - PubMed
    1. Paterno MD, Maviglia SM, Gorman PN, Seger DL, Yoshida E, Seger AC, et al. Tiering drug-drug interaction alerts by severity increases compliance rates. J Am Med Inform Assoc. 2009;16: 40–6. 10.1197/jamia.M2808 - DOI - PMC - PubMed
    1. Kent DM, Rothwell PM, Ioannidis JP, Altman DG, Hayward RA. Assessing and reporting heterogeneity in treatment effects in clinical trials: a proposal. Trials. 2010;11: 85 10.1186/1745-6215-11-85 - DOI - PMC - PubMed