. 2015 Mar 4;10(3):e0118270.
doi: 10.1371/journal.pone.0118270. eCollection 2015.

A rapid molecular approach for chromosomal phasing

Affiliations

A rapid molecular approach for chromosomal phasing

John F Regan et al. PLoS One. .

Abstract

Determining the chromosomal phase of pairs of sequence variants - the arrangement of specific alleles as haplotypes - is a routine challenge in molecular genetics. Here we describe Drop-Phase, a molecular method for quickly ascertaining the phase of pairs of DNA sequence variants (separated by 1-200 kb) without cloning or manual single-molecule dilution. In each Drop-Phase reaction, genomic DNA segments are isolated in tens of thousands of nanoliter-sized droplets together with allele-specific fluorescence probes, in a single reaction well. Physically linked alleles partition into the same droplets, revealing their chromosomal phase in the co-distribution of fluorophores across droplets. We demonstrated the accuracy of this method by phasing members of trios (revealing 100% concordance with inheritance information), and demonstrate a common clinical application by phasing CFTR alleles at genomic distances of 11-116 kb in the genomes of cystic fibrosis patients. Drop-Phase is rapid (requiring less than 4 hours), scalable (to hundreds of samples), and effective at long genomic distances (200 kb).


Conflict of interest statement

Competing Interests: We have read the journal’s policy and the authors of this manuscript have the following competing interests. Several of the authors are employees of Bio-Rad and own Bio-Rad stock through an employee stock purchase program; Bio-Rad sells droplet digital PCR systems that can be used to perform assays such as those in the paper. In addition, several authors are inventors on a patent application that includes claims related to measurement of linked DNA species in droplets. This does not alter the authors’ adherence to PLoS ONE policies on sharing data and materials.

Figures

Fig 1
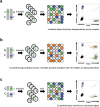
Fig 1. Drop-Phase schematic.
A genomic DNA sample is emulsified into aqueous droplets in an oil-aqueous reverse emulsion. Allele-specific fluorescence probes (FAM, blue; and HEX, green) are used to detect alleles at two different loci. Following PCR, the droplets are positive for one fluorophore (blue or green), positive for both fluorophores (orange), or positive for neither fluorophore, depending on the alleles they contained at the beginning of the reaction. (a) Trans-configured alleles partition independently into droplets. Co-partitioning (orange) is therefore governed by chance. (b) Cis-configured alleles tend to co-segregate into the same droplets, because they are physically linked; co-partitioning greatly exceeds chance expectation. (c) Restriction digest at a site between the cis-configured alleles abolished co-partitioning of the two alleles; co-partitioning again occurs to the extent expected by chance.
Fig 2
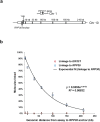
Fig 2. Evaluation of the relationship of physical linkage to genomic distance, using polysaccharide precipitation-extracted DNA.
(a) In this analysis, FAM-labeled “mile marker” assays targeting sequences at different distances (1–210 kb) from the RPP30 anchor sequence were paired with a HEX-labeled assay specific to the RPP30 anchor sequence. Control assays utilized an anchor assay sequence in EIF2C, which resides on another chromosome. (b) The percentage of linked molecules at each genomic distance is shown as a function of distance. Means (of triplicate measurements) and 95% confidence intervals are shown.
Fig 3
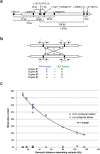
Fig 3. Phasing CFTR variants in the genomes of cystic fibrosis patients.
(a) Locations and genomic distances separating the variants along the CFTR gene in the tested cell lines. (b) Assembly of four duplex assays to redundantly evaluate phase of screened variants. (c) Physical linkage of CFTR variants as measured by Drop-Phase, as a function of genomic distance (horizontal axis). Blue diamonds: allele-pairs inferred to be cis-configured; purple squares: allele-pairs inferred to be trans-configured. The black line is an exponential curve fit to the cis-configured allele-pairs. Four duplex assays were performed per variant pair. Variants were classified as cis- or trans-configured based on measured positive linkage or lack of linkage, respectively. Samples were analyzed in duplicate.
Fig 4
Fig 4. Droplet cluster identification and classification in the context of allelically cross-reacting fluorescence probes.
(a,b) The two potential haplotype configurations in a compound heterozygote. Primer pairs (arrows) are designed for both loci, and fluorescent probes are designed for the A allele at locus A/a and the B allele at locus B/b. (c,d) Expected populations of droplets under the two potential haplotype configurations in panels a and b. Although fluorescence probes are designed to one allele, they also fluoresce (at reduced intensity) in response to the other allele. For example, when a FAM-labeled probe is designed to the A allele, droplets exhibit four levels of FAM fluorescence: the highest level for droplets containing only the A allele; a lower level for droplets containing a mixture of A and a; a substantially lower level for droplets containing only a; and the lowest level for droplets containing neither A nor a (S3 Fig.). When both SNP assays have this property, up to 16 (24) different patterns of fluorescence will be detected, depending on the presence or absence in each droplet of targeted (A, B) alleles and non-targeted (a, b) alleles. Droplets arising from a single molecular species (e.g., the linked AB species) are more common than droplets arising from combinations of molecules that happen by chance to appear in the same droplet (e.g., unlinked molecules containing A and b). Arrowheads indicate common droplet populations that are diagnostic of the key linked species (AB and ab in the first individual; Ab and aB in the second). (e,f) Drop-Phase data diagnostic of the two different haplotypic configurations in panels a and b. Arrowheads indicate the highly populated clusters diagnostic of the linked species. Mathematical analysis of the droplet population sizes (S1 Note) is used to estimate the number of linked molecules of each species and determine phase. S4 Fig. elaborates on the relationship of these droplet population sizes to DNA input concentration.

References

    1. Cowles CR, Hirschhorn JN, Altshuler D, Lander ES. Detection of regulatory variation in mouse genes. Nat Genet 2002; 32: 432–437. - PubMed
    1. Pastinen T. Genome-wide allele-specific analysis: insights into regulatory variation. Nat Rev Genet 2010; 11: 533–538. 10.1038/nrg2815 - DOI - PubMed
    1. Conrad DF, Keebler JE, DePristo MA, Lindsay SJ, Zhang Y, Casals F, et al. Variation in genome-wide mutation rates within and between human families. Nat Genet 2011; 43: 712–714. 10.1038/ng.862 - DOI - PMC - PubMed
    1. Kong A, Frigge ML, Masson G, Besenbacher S, Sulem P, Magnusson G, et al. Rate of de novo mutations and the importance of father's age to disease risk. Nature 2012; 488: 471–475. 10.1038/nature11396 - DOI - PMC - PubMed
    1. Fromer M, Pocklington AJ, Kavanagh DH, Williams HJ, Dwyer S, Gormley P, et al. De novo mutations in schizophrenia implicate synaptic networks. Nature 2014; 506: 179–184. 10.1038/nature12929 - DOI - PMC - PubMed

Publication types