. 2015 May 7;521(7550):85-9.
doi: 10.1038/nature14179. Epub 2015 Mar 4.

A direct GABAergic output from the basal ganglia to frontal cortex

Affiliations

A direct GABAergic output from the basal ganglia to frontal cortex

Arpiar Saunders et al. Nature. .

Abstract

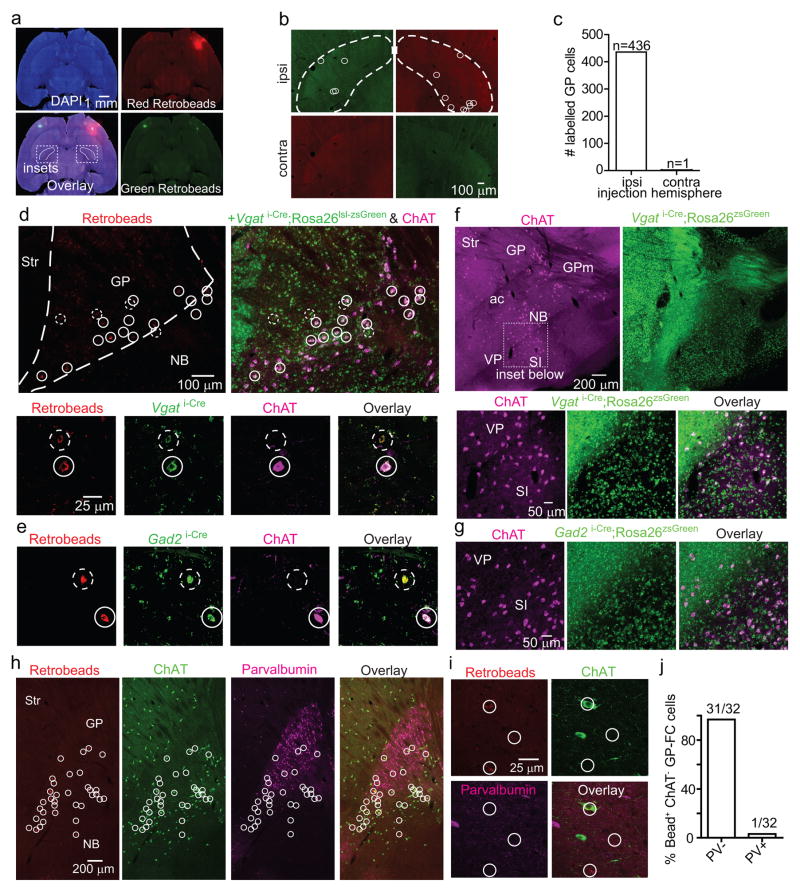
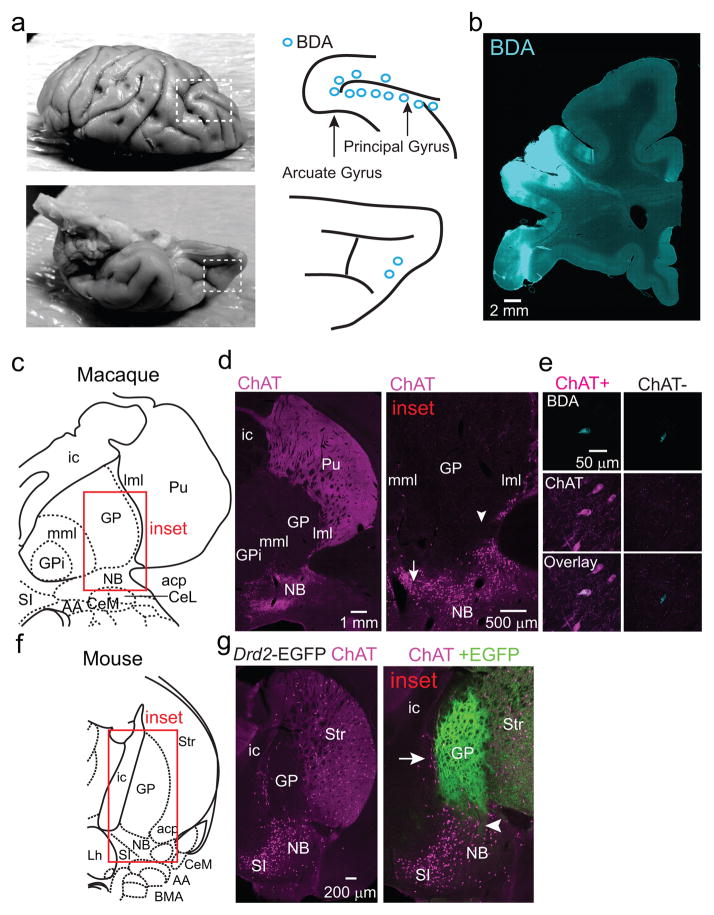
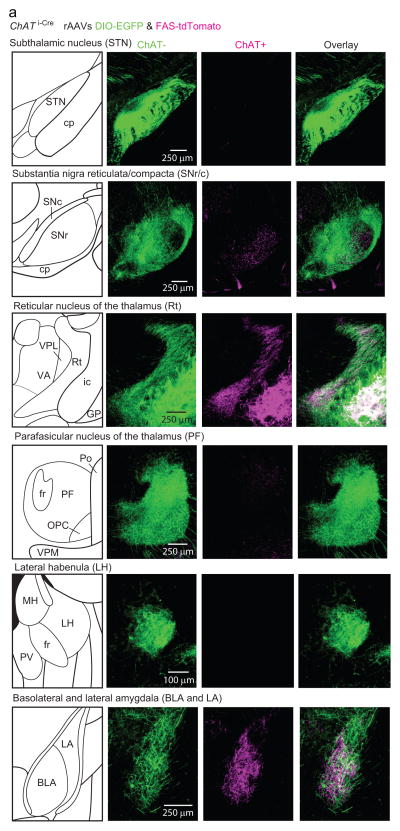
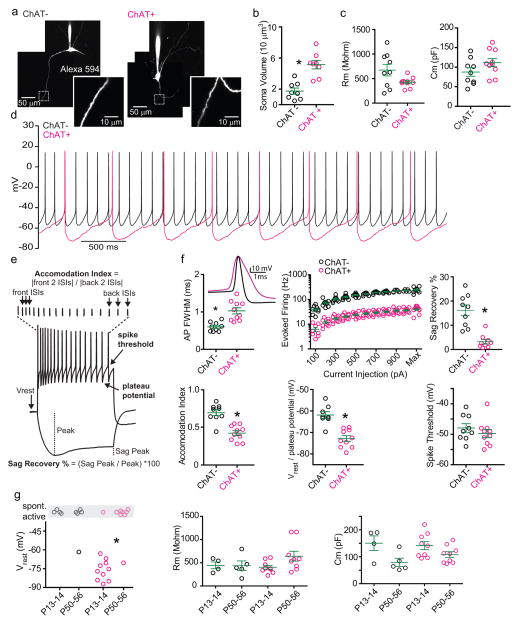
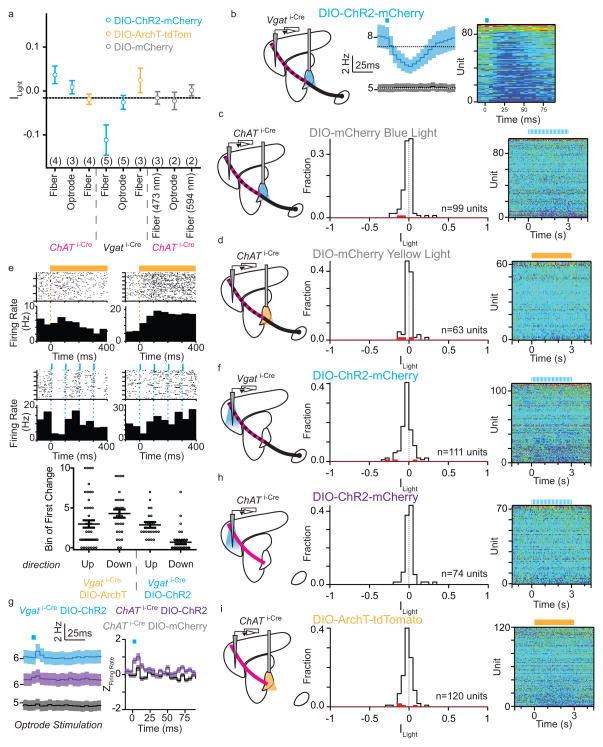
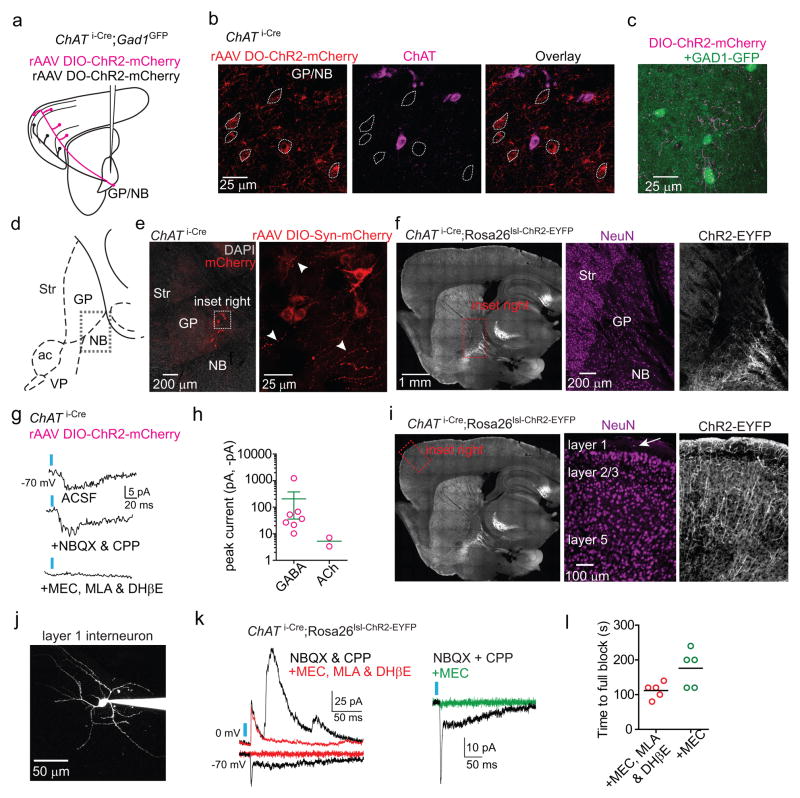
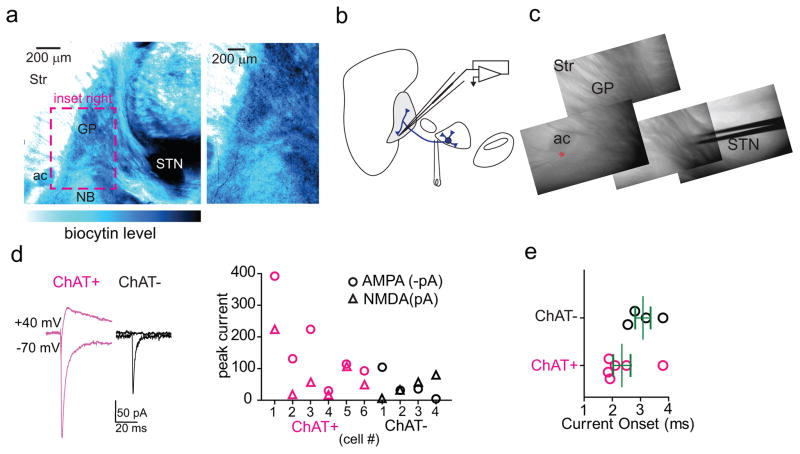
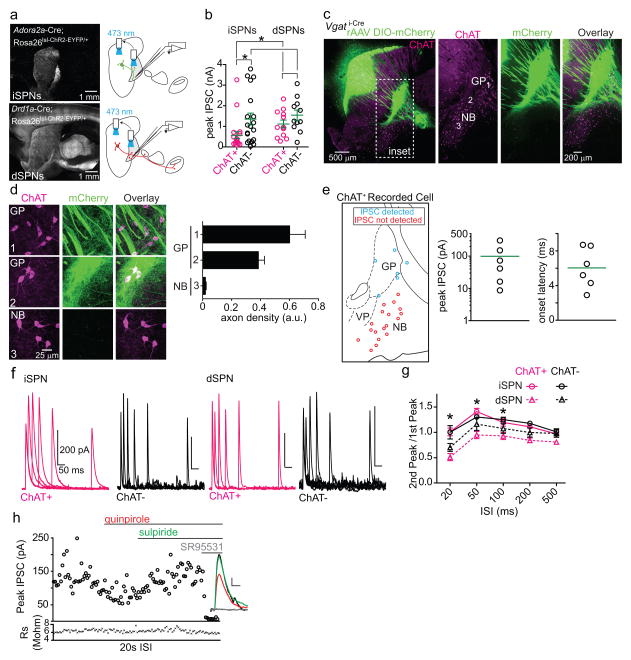
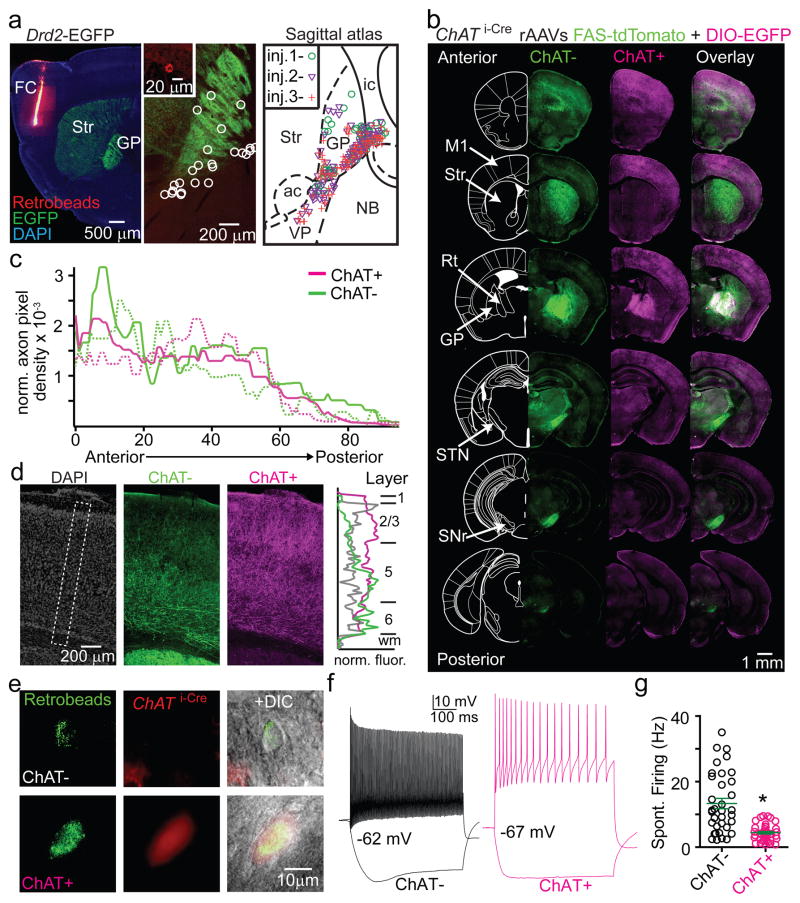
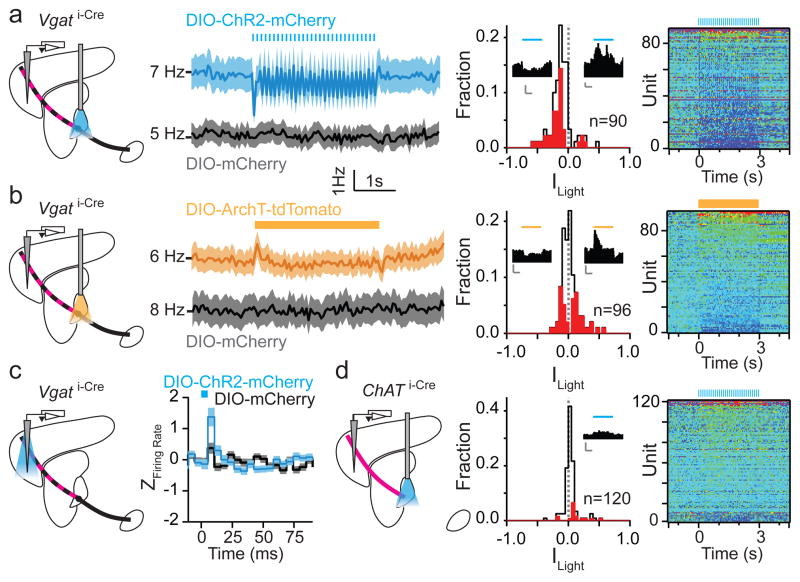
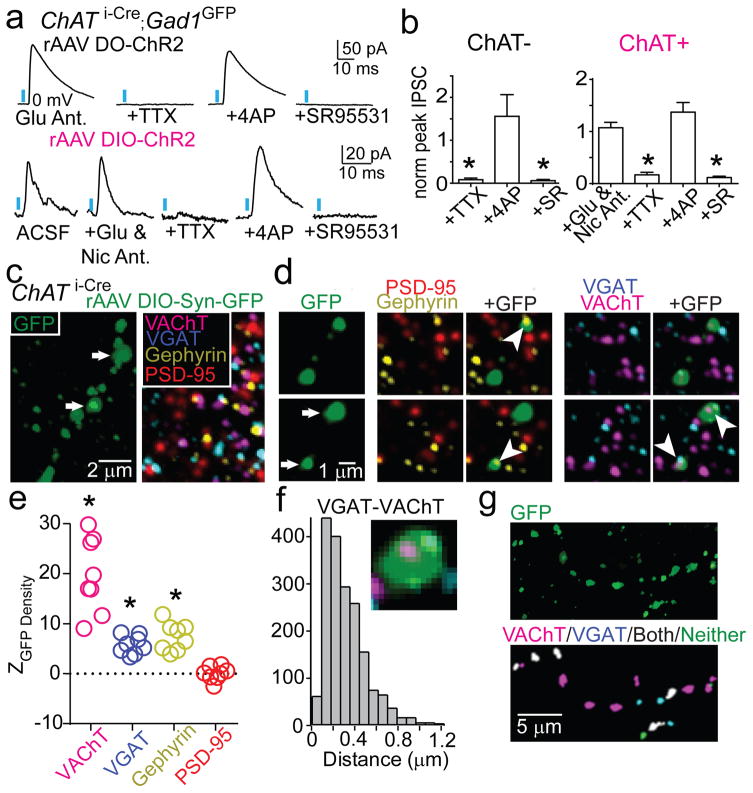
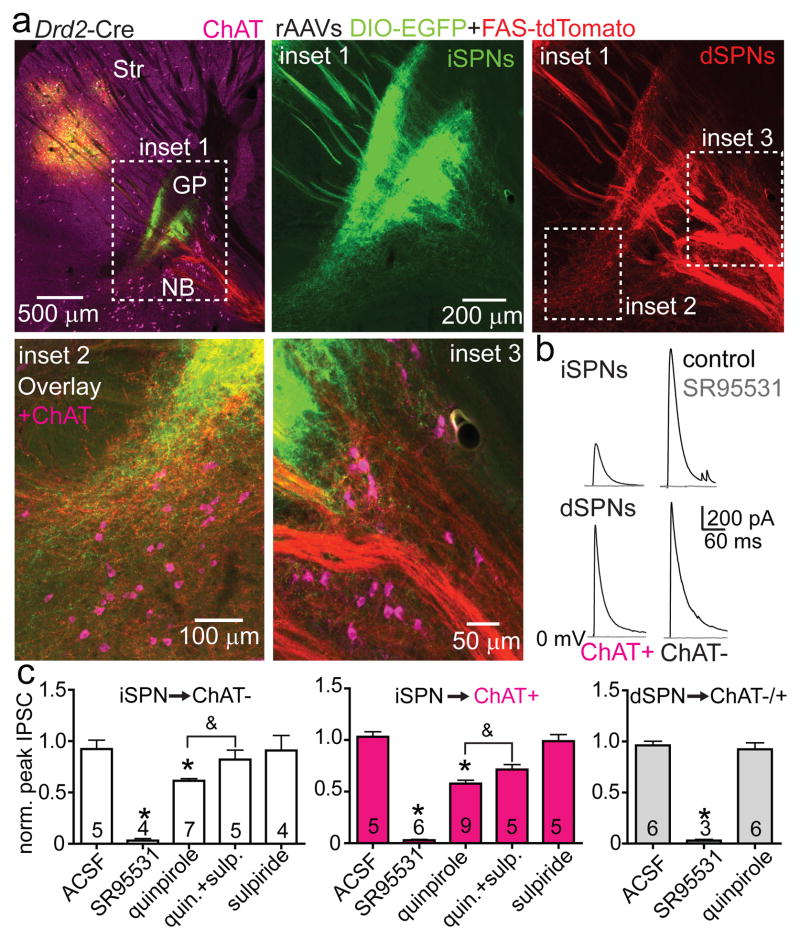
The basal ganglia are phylogenetically conserved subcortical nuclei necessary for coordinated motor action and reward learning. Current models postulate that the basal ganglia modulate cerebral cortex indirectly via an inhibitory output to thalamus, bidirectionally controlled by direct- and indirect-pathway striatal projection neurons (dSPNs and iSPNs, respectively). The basal ganglia thalamic output sculpts cortical activity by interacting with signals from sensory and motor systems. Here we describe a direct projection from the globus pallidus externus (GP), a central nucleus of the basal ganglia, to frontal regions of the cerebral cortex (FC). Two cell types make up the GP-FC projection, distinguished by their electrophysiological properties, cortical projections and expression of choline acetyltransferase (ChAT), a synthetic enzyme for the neurotransmitter acetylcholine (ACh). Despite these differences, ChAT(+) cells, which have been historically identified as an extension of the nucleus basalis, as well as ChAT(-) cells, release the inhibitory neurotransmitter GABA (γ-aminobutyric acid) and are inhibited by iSPNs and dSPNs of dorsal striatum. Thus, GP-FC cells comprise a direct GABAergic/cholinergic projection under the control of striatum that activates frontal cortex in vivo. Furthermore, iSPN inhibition of GP-FC cells is sensitive to dopamine 2 receptor signalling, revealing a pathway by which drugs that target dopamine receptors for the treatment of neuropsychiatric disorders can act in the basal ganglia to modulate frontal cortices.


Conflict of interest statement

The authors declare no competing financial interests.

Figures

Extended Data Figure 1
Extended Data Figure 1. Anatomical and molecular properties of GP-FC cells and ChAT+ cells of the substantia innominata (SI) and ventral pallidum (VP)
a–c. GP-FC cells project exclusively to ipsilateral cortex. a. Low magnification horizontal section from a wild type mouse injected bilaterally in FC with red (right hemisphere) and green (left hemisphere) retrobeads. DAPI (blue), nuclear stain. Boxed insets show location of GP in b. Green signal in the right hemisphere is due to bleed through from the red channel. b. High magnification of left and right GP from the same brain as in a. Retrobead+ cells from ipsilateral (ipsi) and contralateral (contra) injections are highlighted with white circles. Dashed lines demarcate the approximate boundaries of the GP. c. Summary graph showing nearly all retrobead+ cells (n=436 of 437, from 4 mice) resulted from injections in ipsilateral FC. d–e. FC retrobead labeling in Vgat i-Cre;Rosa26lsl-zsGreen or Gad2 i-Cre;Rosa26lsl-zsGreen mice followed by ChAT immunostaining (magenta) demonstrates that nearly all retrobead+ GP cells (red) are Vgat i-Cre + or Gad2 i-Cre + (green) while a subset of retrobead+ neurons are also ChAT+ (solid circles) and the remainder are ChAT (dashed circles). Nearly all retrobead+ GP cells were Vgat+ (n=159 of 159 cells, from 3 mice) or Gad2+ (n=231 of 233 cells, from 2 mice), whereas 72% were ChAT+ (n=215 of 300 cells, from 5 mice) and 28% ChAT (n=85 of 300 cells). d. Top, low magnification sagittal view of the GP. Bottom, a single confocal plane from stacks used to quantify marker co-localization in Vgat i-Cre;Rosa26lsl-zsGreen mice. e. A single confocal plane from stacks used to quantify marker co-localization in Gad2 i-Cre;Rosa26lsl-zsGreen mice. f–g. ChAT+ neurons of the substantia innominata (SI) and ventral pallidum (VP) also express Vgat and Gad2. f. Top, low magnification ventral view of a sagittal section from a Vgati-Cre; Rosa26lsl-zsGreen mouse immunostained for ChAT. Bottom, high magnification view of the SI and bordering VP. g. High magnification view of SI/VP in a Gad2 i-Cre; Rosa26lsl-zsGreen mouse immunostained for ChAT. h–j. ChAT− GP-FC cells do not express Parvalbumin (PV). h. Low magnification view of sagittal section through the GP of a wild type mouse injected with retrobeads (red) in FC and immunostained for ChAT (green) and PV (magenta). White circles highlight retrobead+ GP-FC cells. i. A single confocal plane showing retrobead+ GP-FC cells (circled in white) and immunostaining for ChAT and PV. j. Confocal quantification of co-localization between retrobead+ ChAT GP-FC cells and PV (n=32 cells, from 2 mice).
Extended Data Figure 2
Extended Data Figure 2. ChAT+ and ChAT− GP-FC cells are present in a rhesus macaque
a. In order to label frontal cortical projection neurons from Ch4iv and Ch4id regions of the NB adjacent to the GP of a rhesus macaque, the neuronal tracer biotinylated dextran amine (BDA) was injected at multiple sites along the arcuate and principal gyri and in the orbital cortex. Left, dorsal (top) and ventral (bottom) views of a fixed macaque brain. Dashed boxes indicate the injected areas. Right, schematic of the injection sites. Blue circles correspond to 2 x 0.5 μl BDA injections at 1 and 2 mm below the pial surface. b. Coronal section through the injection area after immunostaining to visualize BDA. c–e. Immunostaining for BDA and ChAT identifies retrogradely labeled ChAT+ and ChAT− GP-FC cells. c. Coronal section from macaque atlas containing GP and NB. d. Left, ChAT immunostaining highlights traditional anatomical boundaries of the GP/Putamen and GP/NB. Same plane as in c. Right, higher magnification view of GP/NB border corresponding to the inset in c. ChAT+ neurons are distributed around the ventral GP/dorsal NB and along laminae separating the GP from the Putamen (lateral medullary laminae, lml) and GPi (medial medullary laminae, mml). Arrow and arrowhead indicate approximate locations of BDA+ChAT+ (680 μm anterior) and BDA+ChAT (360 μm anterior) example GP-FC cells shown in e. e. Single confocal planes showing example BDA+ChAT+ and BDA+ChAT GP-FC cells. f,g. ChAT immunostaining in a Drd2-EGFP mouse distinguishes traditional anatomical boundaries of the GP/NB from the territory occupied by iSPN axons. f. Coronal section from the mouse atlas. g. Left, ChAT immunostaining highlights traditional anatomical boundaries of the GP/Striatum and GP/NB. Same plane as in f. Right, higher magnification view of GP/NB border region corresponding to the inset in f. As in macaque, ChAT+ cells are distributed along GP borders between striatum and the internal capsule (ic) and at the border of ventral GP/dorsal NB. Overlay of GFP fluorescence demonstrates iSPN axons arborize throughout the GP, abutting ChAT+ cells on the GP border regions (arrow), and ventrally in the dorsal NB (arrowhead). AA, anterior amygdaloid area; ac, anterior commissure posterior; CeL, central lateral division of amygdala; CeM, central medial division of amygdala; GP, globus pallidus externus; GPi, globus pallidus internus; Lh, lateral hypothalamus; Pu, putamen; SI, substantia innominata; Str, striatum.
Extended Data Figure 3
Extended Data Figure 3. Validation of ChAT i-Cre knock-in mouse and rAAV strategy for Cre-On/Off labeling of GP-FC axons in cortex
a–c. The ChAT i-Cre mouse expresses Cre selectively in ChAT+ GP/NB neurons with high penetrance. a. Left, low magnification view of sagittal section through ChAT i-Cre;Rosa26lsl-tdTomato mouse immunostained for ChAT. Right, inset showing higher magnification view of the GP and NB. Dashed line approximates the boundaries for quantifying Cre-reporter and ChAT co-localization. b. Single confocal plane showing overlap of Cre-reporter expression and ChAT immunostaining of ChAT+ cells at the GP/NB border. c. Quantification of confocal co-localization between the Cre-reporter+ and ChAT+ cells (n=471 of 484 tdTomato+ ChAT+, n=12 of 484 tdTomato+ only, n=1 of 484 ChAT+ only, from 3 mice). d–f. Transduction of the GP in a ChAT i-Cre mouse with DIO-EGFP (Cre-On) and FAS-tdTomato (Cre-Off) rAAVs effectively targets GFP and tdTomato to ChAT+ and ChAT cells respectively. d. Sagittal section through the GP following transduction of the DIO-EGFP (green) and FAS-tdTomato (red) rAAVs and immunostaining for ChAT (magenta). e. Single confocal plane showing ChAT+ cells (circled in white) co-localized with GFP but not tdTomato. f. Quantification of confocal co-localization between ChAT, GFP and tdTomato (n=319 ChAT+ cells, from 2 mice). g. Left, coronal atlas. Right, injection site for injection 1 (Fig. 1b–d), showing ChAT+ (Cre-On) expression limited to GP and the immediately adjacent NB. ChAT− (Cre-Off) expression is limited to GP with slight leak in striatum. ChAT+ and ChAT− axons arborize in Rt. SI, substantia innominata; NB, nucleus basalis; ic, internal capsule. h. Coronal section of anterior M1 illustrating automated axon detection of ChAT− and ChAT+ axons. i. Densities of detected ChAT− (green) and ChAT+ (magenta) axons along with total cortical area (black) in successive 50 μm coronal slices (anterior-posterior) across the cortical mantle (n= 2 mice). Densities and area are shown raw (thin line) and after 5 point median filtering (thick line). Median filtered data are reported in Fig. 1c. j. Average density of ChAT+ and ChAT− GP-FC axons by cortical area. FrA, frontal association; PrL, prelimbic; MO, medial orbital; LO, lateral orbital; VO, ventral orbital; GI/DI, granular/dysgranular; AI, agranular insular; M1, primary motor; M2, secondary motor; S1, primary sensory; S2, secondary sensory; Cg, cingulate; IL, infralimbic; DLO, dorsolateral orbital; Pir, piriform; A2, secondary auditory; A1, primary auditory; RS retrosplenial; V1, primary visual; V2, secondary visual; TeA, temporal association; PTA, parietal; Ent, enthorhinal; Ect, ectorhinal; PRh, perirhinal. k. Coronal section illustrating the distribution of GP-FC axons across layers of ectorhinal cortex, a posterior cortical area that receives a large GP-FC projection. ChAT− axons target superficial layers 1 and 2/3 (arrow), in addition to deeper layers 5 and 6, as in anterior cortices including M1. The ChAT+ axons arborize across all cortical layers in both ectorhinal and anterior cortical areas. rh, rhinal fissure; Str, striatum; wm, white matter.
Extended Data Figure 4
Extended Data Figure 4. ChAT+ and ChAT− GP-FC cells target distinct but overlapping subcortical nuclei
a. Coronal sections from a three dimensional brain reconstructions illustrating subcortical nuclei targeted by ChAT+ and ChAT− axons following transduction of ChAT i-Cre GP/dorsal NB with rAAVs DIO-EGFP (green, Cre-On) and FAS-tdTomato (magenta, Cre-Off)(n=2 mice, examples from injection 1). Left, coronal atlas. Right, high magnification views of subcortical nuclei.
Extended Data Figure 5
Extended Data Figure 5. GP-FC cells are distinguished by active and passive membrane properties
a. Maximum intensity 2-photon projections of example ChAT− (left) and ChAT+ (right) GP-FC cells following whole-cell recording. Dashed insets show high magnification projections through dendrites. b. ChAT+ cells have larger soma than ChAT− cells. Soma volumes were quantified from 2-photon stacks (from 4 P18-22 mice; n=8 ChAT+ cells, n=8 ChAT− cells). c. Passive membrane properties of GP-FC cells (n=9 ChAT−, n=10 ChAT+, from 4 P18-22 mice). d. Representative waveforms of spontaneously active ChAT− and ChAT+ GP-FC cells. e. Schematic of quantified membrane properties following positive and negative current injections. ISI, interspike interval. f. Active membrane properties of GP-FC cells (n=8–9 ChAT−, n=10 ChAT+). Representative action potential waveforms from a spontaneously active ChAT− cell or from minimal current injection in a ChAT+ cell. Evoked firing rates were calculated for 500 ms current injections. g. Developmental comparison of GP-FC membrane properties before (P13-14, n=2 mice) and around (P50-56, n=3 mice) sexual maturity. Left, ChAT− GP-FC cells are spontaneously active throughout post-natal development (P13-14, n= 4 of 4; P50-56, n=4 of 5), while ChAT+ cells tend to become spontaneously active after sexual maturity (P13-14, n=1 of 11; P50-56, n=7 of 8). GP-FC membrane resistance (middle) does not change before and after sexual maturity but membrane capacitance (right) is reduced (ChAT−: P13-14, n= 4; P50-56, n=5; ChAT+: P13-14, n= 9; P50-56, n=9). Asterisk, P<0.05 (Fisher’s Exact test); Bars denote mean±s.e.m.
Extended Data Figure 6
Extended Data Figure 6. Optogenetic manipulations of GP-FC cells coupled with in vivo extracellular FC recordings in an awake behaving mouse
a. Summary plot of mean (and 95% CI) indices for light modulation (Ilight) of FC unit firing rate by experimental condition. Dashed line denotes average of blue light fiber mCherry+ control. The number of mice for each condition are shown in parentheses. b. Pulsed ChR2 depolarization of Vgat i-Cre GP somata in FC increases firing rates on a millisecond time scale. Left, experimental schematic. Extracellular recordings in FC are coupled with fiber-delivered pulses of blue light (5ms pulses of 473 nm, 10 Hz for 3s) in GP. Middle, mean firing rate (±sem) of all FC units in response to pulsed blue light in ChR2+ (blue) or control (black) mice (ChR2+, n=90 units from 5 mice; mCherry+, n=99 units from 3 mice). Dotted line represents mean pre-stimulation firing rate. Right, pseudocolored plot of normalized firing rate for all units. c. Fiber-delivered pulsed blue light illumination of mCherry+ GP somata in ChAT i-Cre mice shows no light induced changes in the firing rates of FC units above chance (Increased, 0 of 99; Decreased, 2 of 99; from 3 mice). Right, pseudocolored plot of normalized firing rate for all units. d. Fiber-delivered constant yellow light illumination of mCherry+ GP somata in ChAT i-Cre mice shows no light induced changes in the firing rates of FC units above chance (Increased, 1 of 63; Decreased, 2 of 63; from 2 mice;). Right, pseudocolored plot of normalized firing rate for all units. e. Latencies of light-induced modulation of FC firing following fiber-based illumination of ChR2+ (pulsed blue light) or ArchT+(constant yellow light) GP somata in Vgat i-Cre mice. Top, spike raster blots (upper) and firing rate histograms (lower, 50ms bins) from example FC units exhibiting light-induced decreases and increases in firing rates. Onset times for light pulses are shown with colored dash lines. Bottom, summary graph plotting light-effect latencies for those FC units with statistically significant modulations. Firing rates are binned every 50 ms, such that “Bin of first change = 0” contains the spikes from 0–50 ms after light onset. First change is determined as the first bin to deviate more than ± 2 SD from the mean baseline firing. Units in which no change is detected within 500 ms are excluded. Individual units may have a first increasing and first decreasing bin if their activity is biphasic. Mean 50 ms bin of first activated by ArchT in Vgat i-Cre mice was 3.0±0.5 n = 47 of 96 units; first suppressed 4.3±0.5 n = 28 of 96 units; first activated by ChR2 2.9±0.3 n = 22 of 90 units, first suppressed by ChR2 0.7±0.2 n = 35 of 90 units. f. Optrode-delivered pulsed blue light illumination of ChR2+ axons in FC from Vgat i-Cre mice shows no persistent changes in the firing rates of FC units above chance (Increased, 1 of 111; Decreased, 2 of 111 from 5 mice). Right, pseudocolored plot of normalized firing rate for all units. g. Pulsed blue light illumination of GP-FC axons using an optrode leads to increases in firing rate on the millisecond timescale. Left, mean (±sem) firing rates on a millisecond time scale of all units in response to pulsed blue light illumination of GP axons in FC for Vgat i-Cre mice expressing ChR2 (blue) or mCherry (black) or ChAT i-Cre mice expressing ChR2 (purple). Right, Z score of inter-pulse interval firing rates (20 x 5ms bins) comparing positive and negative deviations from preceding baseline period without light. h. Optrode-delivered pulsed blue light illumination of ChR2+ axons in FC from ChAT i-Cre mice shows no persistent changes in the firing rates of FC units above chance (Increased, 0 of 74 from 3 mice; Decreased, 0 of 74). Right, pseudocolored plot of normalized firing rate for all units. i. Fiber-delivered constant yellow light illumination of ArchT+ GP somata in ChAT i-Cre mice shows no light induced changes in the firing rates of FC units above chance (Increased, 1 of 120; Decreased, 3 of 120 from 4 mice). Right, pseudocolored plot of normalized firing rate for all units. In plots of Ilight, red bars indicate units that were statistically significantly modulated by light (T-Test, P<0.05). For pseudocolored plot of normalized firing rate, units are normalized to the baseline period, prior to light onset, and ordered by Ilight (low to high). Blues and purples represent low firing rates whereas yellow and red represent higher firing rates. Red represents modulations three or more times baseline.
Extended Data Figure 7
Extended Data Figure 7. ChR2-mediated stimulation of ChAT i-Cre axons following rAAV transduction or with a Cre-activated allele evokes ACh and GABA mediated currents
a,b. Targeting ChR2 expression to ChAT+ and ChAT− GP-FC cells. a. Schematic of ChAT+ (magenta) or ChAT− (black) GP-FC axons expressing ChR2-mCherry after DIO (Cre-On) or DO (Cre-Off) rAAV transduction in the GP of ChAT i-Cre;GAD1GFP mice. b. rAAV DO-ChR2-mCherry transduced into the ChAT i-Cre GP expresses ChR2-mCherry selectively in Cre neurons. Single confocal plane showing neighboring ChR2-mCherry+ soma (dotted outline) and ChAT+ soma at the GP/NB border. Of n=158 ChR2-mCherry+ neurons surrounding n=223 ChAT+ neurons, n=0 were ChR2-mCherry+ChAT+ (from 2 mice). c. ChAT+ axons surrounding GAD1GFP expressing cells in FC layer 6. d–f. ChAT+ GP-FC cells ramify local axon collaterals around the GP/NB border. d. Sagittal atlas with the GP/NB border indicated with a dashed box. e. Left, low magnification view of ChAT i-Cre GP following transduction with rAAV DIO-Synaptophysin-mCherry. DAPI (grey), nuclear stain. Right, max projection confocal stack (28 μm) of inset region. Example putative presynaptic boutons indicated by arrowheads. f. Left, low magnification sagittal section from ChAT i-Cre;Rosa26lsl-ChR2-EYFP/+ mouse. Right, high magnification inset of GP showing distribution of neurons (NeuN immunostain, magenta) and ChR2-EYFP+ processes (white). g,h. Following rAAV transduction in ChAT i-Cre mice, ChR2 activation of local ChAT i-Cre axon collaterals results in rare nicotinic EPSCs but prevalent GABAergic IPSCs onto ChR2 GP/NB neurons (EPSC=2 of 85 cells; IPSC=7 of 85 cells from 6 mice). g. Light-evoked EPSC from an example ChR2 GP/NB cell voltage-clamped at −70 mV (top) was insensitive to glutamate receptor block with NBQX and CPP (middle), but abolished by bath application of MEC, MLA & DHβE (bottom), suggesting the EPSC resulted from ACh release and nicotinic receptor activation. h. Summary of peaks from nicotinic EPSCs and GABAergic IPSCs evoked from ChAT i-Cre axons onto ChR2 GP/NB cells. i. Left, low magnification image of sagittal section from a ChAT i-Cre;Rosa26lsl-ChR2-EYFP/+ mouse. Right, high magnification of inset from frontal cortex showing distribution of neurons (NeuN immunostain, magenta) and ChR2-EYFP (white), expressed in axons from basal forebrain and in local cortical interneurons. j. Maximum intensity 2-photon projection of a layer 1 interneuron following whole-cell recording. k. Left, light-evoked current responses from two layer 1 interneurons held at indicated potentials to optogenetic activation in a ChAT i-Cre;Rosa26lsl-ChR2-EYFP/+ mouse in baseline conditions (black, NBQX & CPP) and after bath application of nicotinic receptor antagonist cocktail (red, MEC, MLA & DHβE). Right, nicotinic EPSCs are blocked by bath application of the non-selective blocker MEC alone (green). l. Time until full block of light-evoked nicotinic EPSCs following bath application of either nicotinic receptor antagonist cocktail (MEC, MLA & DhβE, n=5 cells from 3 mice) or MEC alone (n=5 cells from 3 mice). Inter-stimulus interval = 20 s.
Extended Data Figure 8
Extended Data Figure 8. Synaptic connectivity and array tomography marker co-localization analysis of GP-FC axons in FC
a–d. Ionotropic synaptic connectivity of ChAT+ and ChAT− GP-FC neurons onto FC cell types and layers. a. Example morphologies of FC neurons identified as pyramidal (from layer 5) or an interneuron (from layer 1). b. Summary of cortical neurons with ChR2-evoked monosynaptic ionotropic GABAergic or nicotinic currents from ChAT+ or ChAT− axons by cortical layer. c. Peak currents induced by ChR2 activation of ChAT+ or ChAT− GP-FC cells in FC. Post-synaptic cells are grouped across layers as pyramids or interneurons. Left, GABAergic IPSCs reported with either TTX/4AP in the bath or following wash in are plotted with dotted data. IPSCs recorded in baseline conditions (ChAT−, NBQX & CPP; ChAT+, ACSF only) and are plotted with undotted data. Each cell is represented once. (ChAT−, n=5 pyramids, n=15 interneurons from 13 mice; ChAT+, n=3 interneurons, from 15 mice). Right, nicotinic EPSCs recorded in ACSF, present after bath application of CPP and NBQX and fully blocked by nicotinic receptor antagonists (MEC, MLA, DHβE, n=5 interneurons from 15 mice). d. Onset latencies for IPSCs and EPSCs induced by ChR2 activation of ChAT+ or ChAT− GP-FC cells under baseline conditions only (“ACSF”) or in the presence of TTX/4AP (“TTX/4AP”). “BaselineTTX/4AP” refers to the subset of cells with IPSCs recorded under both baseline conditions and recovered following wash in of TTX/4AP (n=5; same data as Fig. 3b). Onset latencies of ChAT− IPSCs were longer in TTX/4AP (n=14) than ACSF (n=11). Asterisk, P<0.05 (Mann-Whitney). Bars denote mean±s.e.m. e–k. Array tomography based co-localization analysis of ChAT+ pre-synaptic terminals (PSTs) in FC. e. Left, 300 μm sagittal slab from a ChAT i-Cre mouse injected with 300 nl of rAAV DIO-Synaptophysin-GFP in GP. Right, box indicates area of FC prepared for array tomography. f. Automated detection of GFP+ volumes (“pearls”) and synaptic markers. Left, maximum projection of GFP+ axons following computational detection of string-associated “pearls” (in red). Right, a single 70 nm plane showing diffraction-limited immunohistochemical punctae for PSD-95 and computational detection of point sources (in red). g. Maximum projection (z=2.17 μm) through layers 1–3 of FC following injection of rAAV DIO-Synaptophysin-GFP into the GP of a ChAT i-Cre mouse. Inset shows location of axon shown in Fig. 3c. h–k. GFP+ pearls are putative GABAergic PSTs. h. Individual volumes for all detected GFP+ PSTs (n=6,071 pearls from 2 mice; n=4 layers 1 & 2/3 stacks, n=4 layer 5 stacks). i. Mean density by distance plots for GFP+ PSTs versus synapsin1, bassoon, GAD1/2, VAChT, VGAT, Gephyrin, PSD-95 and parvalbumin from example stack. Crosses indicate means from real data, while lines denote mean values following 1000 rounds of marker randomization. Error bars denote 99% confidence intervals. j. Mean densities within GFP+ PSTs (0 distance) for all markers and all stacks. Real and randomized data are indicated as in i. k. Z score summary (n=8 stacks) quantifying the differences in mean density for the synaptic markers shown in j (and not reported in Fig. 3e) within GFP+ PSTs (0 distance) for the real data and following 10 rounds of randomization of GFP+ volumes. Positive Z scores indicate higher densities in the real data. Asterisk, P<0.001 for all stacks.
Extended Data Figure 9
Extended Data Figure 9. GP-FC cells receive glutamatergic synapses from the STN
a. Left, low magnification view of parasagittal slice showing the GP following biocytin labeling of the STN and avidin-HRP/DAB visualization of STN projections. Right, high magnification view of inset showing DAB-labeled projections in the GP and around the GP/NB border. b. Schematic of experimental strategy to electrically stimulate STN projections to GP. A bipolar electrode was placed at the anterior border of STN and GP-FC cells were targeted for whole-cell voltage-clamp recording. c. Acute parasagittal slice showing location of the bipolar electrode and recording pipette (red asterisk). d,e. Electrically-evoked glutamatergic currents in GP-FC cells following stimulation of STN-GP axon tract. d. Left, example NBQX-sensitive AMPAR (Vhold = −70 mV) then CPP-sensitive NMDAR (Vhold = +40 mV) currents evoked in GP-FC cells under baseline conditions (SR95331, scopolamine, CGP55845). Right, summary of AMPAR and NMDAR peak currents in ChAT+ (n=6) and ChAT− (n=4) GP-FC cells (from 7 mice). e. Onset latencies of glutamatergic currents (ChAT+: 2.3±0.3 ms, n=6 cells; ChAT−: 3.08±0.3 ms, n=4 cells, from 7 mice). Bars denote mean±s.e.m.
Extended Data Figure 10
Extended Data Figure 10. GP-FC cells receive GABAergic synapses from dorsal striatal iSPNs and dSPNs with different presynaptic properties and responses to D2r signaling
a. Left, sagittal sections from an Adora2a-Cre;Rosa26lsl-ChR2-EYFP/+ (top) or Drd1a-Cre; Rosa26lsl-ChR2-EYFP/+ (bottom) mouse where ChR2-EYFP is expressed in either iSPNs or dSPNs, respectively. Middle, light was delivered first over the recorded cell (peak IPSCs in b) and then in dorsal striatum (pharmacological analysis in Fig. 4c;ED Fig. 10h and pre-synaptic properties in f,g). c,d. SPNs from dorsal striatum arborize axons in and around the GP/NB border but not in the basal forebrain. c. Left, sagittal section from a VGAT i-Cre mouse injected with rAAV DIO-mCherry into dorsal striatum. Right, higher magnification view of inset. Axons from SPNs arborize in the GP proper and GP/NB border regions (areas 1 and 2) but not in the more ventral region of the basal forebrain (area 3, NB proper/substantia innominata). d. Left, example maximum projection confocal stacks (z = 28–42 μm) from the inset regions in c. Right, binary axonal quantification from the regions indicated. SPN axon density is sharply reduced in NB proper/substantia innominata. e. Synaptic connectivity screen for dorsal striatal SPN IPSCs onto ChAT+ neurons of the GP and basal forebrain. ChAT-GFP mice were injected with Cre-Off rAAV DO-ChR2-mCherry in dorsal striatum and whole-cell recordings were targeted to ChAT+ neurons (n=23 cells, from 4 mice) in combination with optogenetic activation. NBQX and CPP were included in the bath to block glutamatergic transmission. Left, sagittal map of recording locations of ChAT-GFP+ neurons with detected IPSCs (blue) and no detected IPSCs (red). Right, peaks and onset latencies for detected IPSCs. Green lines denote means. In every experiment, IPSCs onto ChAT-GFP+ neurons of the GP were detected before recordings were targeted to more ventral areas. f,g. Paired pulse optogenetic activation of iSPNs (Adora2a-Cre;Rosa26lsl-ChR2-EYFP/+) and dSPNs (Drd1a-Cre;Rosa26lsl-ChR2-EYFP/+) in dorsal striatum reveals differences in short-term synaptic plasticity properties in GP-FC cells. f. Examples of optogenetically evoked paired pulse IPSCs (interstimulus interval = 20, 50, 100, 200, and 500 ms) from iSPNs (left) and dSPNs (right) in GP-FC cells. g. Mean 2nd/1st peak IPSC ratios (iSPN: n= 13 ChAT+, n=9 ChAT− cells from 11 mice; dSPN: n=9 ChAT+, n=8 ChAT− cells from 6 mice). Asterisk, P<0.05 iSPNs vs dSPNs (ChAT+ and ChAT− grouped together, Mann-Whitney); Error bars denote s.e.m. h. Example iSPN peak IPSCs in a ChAT− GP-FC cell following application of quinpirole, sulpiride and SR95331. Inset, average IPSCs. Scale bar, 20 pA/10 ms. Rs, series resistance.
Figure 1
Figure 1. The GP and bordering NB contain two cell types that project to FC
a. Left, sagittal section from a Drd2-EGFP mouse injected with retrobeads into FC. Center, retrobead+ neurons (inset and circle-highlighted) in a medial section of GP. Right, retrobead+ overlay from 3 separate injections, spanning ~300 μm and excluding ventral basal forebrain. ac, anterior commissure; ic, internal capsule; Str, striatum; VP, ventral pallidum. b–d. Anterograde labeling of ChAT+ and ChAT− GP-FC axons. b. Coronal sections from a ChAT i-Cre mouse injected in GP (EDFig. 3g) with rAAVs DIO-EGFP (Cre-On) and FAS-tdTomato (Cre-Off) sampled from a whole-brain reconstruction. M1, primary motor cortex; Rt, thalamic reticular nucleus; STN, subthalamic nucleus; SNr, substantia nigra reticulata. c. Anterior-posterior distribution of normalized ChAT+ and ChAT− cortical axon densities (2 mice, solid and dotted lines). d. Left, GP-FC axons across layers in anterior M1. Right, normalized average fluorescence from dotted box. e. ChAT+ and ChAT− GP-FC cells are distinguishable in acute brain slices following green retrobead injection in FC of ChAT i-Cre;Rosa26lsl-tdTomato mice. f. Example membrane voltage (Vm) traces for GP-FC cells following positive (ChAT+:1.7; ChAT−:0.9 nA) and negative (ChAT+:−0.2; ChAT−: −0.1 nA) current injections (500 ms) to determine maximum firing rates and hyperpolarized membrane properties. Resting Vm is indicated. g. Whole-cell spontaneous firing rates (n=45 ChAT+ cells, n=35 ChAT−, 10 mice). Asterisk, P<0.05 (Mann-Whitney).
Figure 2
Figure 2. GP-FC cells modulate FC firing rates in vivo
a–b. ChR2 stimulation or ArchT inhibition of Vgat i-Cre GP somata bidirectionally modulates firing rates in FC. Left, Schematic showing extracellular recordings in FC during optical stimulation of ChAT+ (axons shown in magenta) and ChAT (axons shown in black) in GP with pulsed 473 nm (5ms pulses, 10 Hz for 3s, a) or constant 594 nm (3s, b) illumination. The mixed ChAT+/ChAT− GP-FC projection appears striped. Middle left, mean firing rate (±sem) of all FC units in response to 473 nm stimulation (a) of ChR2+ (blue; n=90 units, 5 mice) or control (black; n=99 units, 3 mice) mice or 594 nm stimulation (b) of ArchT+ (yellow; n=96 units, 3 mice) or control mCherry+ (black; n=63, 2 mice) mice (ChAT i-Cre mice expressing mCherry in GP). Middle right, histogram of indices of light modulation (Ilight) of FC unit firing rates (f), calculated as (f Light Onf Light Off)/(f Light On + f Light Off). Red bars indicate significantly modulated units (P<0.05, T-Test). ChR2+ stimulation excited 4 and inhibited 38 units; ArchT+ stimulation excited 25 and inhibited 19 units. Insets, example units, scale bar 5 Hz/1 s. Right, pseudocolored plot of changes in f for each unit, normalized to the baseline period and ordered by ILight. c. Pulsed (as in a) ChR2 stimulation of Vgat i-Cre GP axons in FC increases firing rates on a millisecond time scale. Left, Schematic shown optrode placement in FC used for stimulation and recording. Right, mean (±sem) Z-scored firing rates after each 5ms light pulse (blue rectangle) relative to equivalent baseline period 3s prior (ChR2+, n=111, 5 mice; mCherry+, n=92, 2 mice). d. Pulsed ChR2 depolarization of ChAT i-Cre GP somata increases firing rates in FC. Left, experimental schematic (as in a). Middle, histogram of Ilight for FC units (as in a), ChR2+ excited 15 and inhibited 2 of 120 units from 4 mice. Right, pseudocolored plot of changes in firing rate for all units.
Figure 3
Figure 3. GP-FC cells release GABA and ACh in FC
a–b. DIO (Cre-On) or DO (Cre-Off) rAAV transduction in the GP of ChAT i-Cre;GAD1GFP mice targets ChR2 to ChAT+ or ChAT− GP neurons. a. Top, IPSCs in a layer 6 interneuron evoked by optogenetic activation of ChAT− axons under baseline conditions of glutamate receptor antagonism (NBQX and CPP) and following co-application of (from left to right) voltage-gated sodium channel blocker TTX, voltage-gated K+ channel blocker 4-aminopyridine (4AP) and the GABAA receptor antagonist SR95531. Bottom, IPSCs in a ChR2 neuron at the GP/NB border following optogenetic activation of surrounding ChAT+ cells under baseline conditions (ACSF) and following co-application of glutamate (NBQX & CPP) and nicotinic (MEC, MLA & DHβE) receptor antagonists, TTX, 4AP and SR95531. b. IPSC peaks across conditions normalized to baseline (ChAT−, n=5 cortical interneurons; ChAT+, n=7 ChR2 GP/NB cells). c–g. Co-localization analysis of virally labeled ChAT+ pre-synaptic axon terminals (PSTs) in FC using array tomography. c. Left, maximum projection (z=2.17 μm) through layer 1 of FC showing GFP+ axon following injection of rAAV DIO-Synaptophysin-GFP into the GP of a ChAT i-Cre mouse. Right, a single plane of immunohistochemical labeling. d. Consecutive z-planes illustrating synaptic marker association with GFP+ PSTs (arrows in c). PSTs abut Gephyrin but not PSD-95 and contain both VGAT and VAChT punctae (arrowheads). e. Z scores for mean marker densities within GFP+ PSTs for real vs. PST-randomized data (n=8 stacks), indicating higher densities in the real data. Asterisk, P<0.001 for all stacks. f. Centroid separation of VGAT and VAChT punctae within the same GFP+ PST (n=1,851 comparisons). g. Left, maximum projection of GFP+ axon in layer 1. Right, GFP+ PSTs color-coded by VGAT/VAChT identity.
Figure 4
Figure 4. The GP-FC projection is a BG output sensitive to anti-psychotic drugs
a. Top left, sagittal section from a Drd2-Cre mouse injected with rAAVs DIO-EGFP (Cre-On) and FAS-TdTomato (Cre-Off) into dorsal striatum. Inset 1, iSPN and dSPN innervation zones in relation to ChAT+ GP cells. Insets 2 and 3, ChAT+ GP-FC clusters. b. Optogenetic activation of iSPNs (Adora2a-Cre;Rosa26lsl-ChR2-EYFP/+ mice, top) or dSPNs (Drd1a-Cre; Rosa26lsl-ChR2-EYFP/+ mice, bottom) in dorsal striatum evoked SR95531-sensitive IPSCs in ChAT+ and ChAT− cells. c. iSPN but not dSPN IPSCs are decreased through D2r activation and reversed by an anti-psychotic. Mean IPSCs amplitudes normalized to baseline. Cell numbers are indicated. Asterisk, P<0.05 vs. ACSF (Mann-Whitney); ampersand, P<0.05 quinpirole vs. quinpirole + sulpiride (Paired T-test on cells with both conditions, n=5). Error bars denote s.e.m.

References

    1. Yin HH, Knowlton BJ. The role of the basal ganglia in habit formation. Nat Rev Neurosci. 2006;7:464–476. - PubMed
    1. Smith Y, Bevan MD, Shink E, Bolam JP. Microcircuitry of the direct and indirect pathways of the basal ganglia. Neuroscience. 1998;86:353–387. - PubMed
    1. Kravitz AV, et al. Regulation of parkinsonian motor behaviours by optogenetic control of basal ganglia circuitry. Nature. 2010;466:622–626. - PMC - PubMed
    1. Freeze BS, Kravitz AV, Hammack N, Berke JD, Kreitzer AC. Control of Basal Ganglia Output by Direct and Indirect Pathway Projection Neurons. J Neurosci. 2013;33:18531–18539. - PMC - PubMed
    1. Goldberg JH, Farries MA, Fee MS. Basal ganglia output to the thalamus: still a paradox. Trends Neurosci. 2013;36:695–705. - PMC - PubMed

Publication types

MeSH terms