2,5-hexanedione induced apoptosis in mesenchymal stem cells from rat bone marrow via mitochondria-dependent caspase-3 pathway
- PMID: 25739802
- PMCID: PMC4466875
- DOI: 10.2486/indhealth.2014-0182
2,5-hexanedione induced apoptosis in mesenchymal stem cells from rat bone marrow via mitochondria-dependent caspase-3 pathway
Abstract
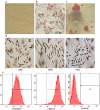
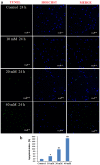
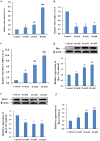
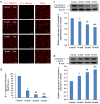
2,5-hexanedione (HD) induces apoptosis of nerve cells. However,the mechanism of HD-induced apoptosis remains unknown. Mesenchymal stem cells (MSCs) are multipotential stem cells with the ability to differentiate into various cell types. This study is designed to investigate the apoptosis induced by HD in rat bone marrow MSCs (BMSCs) and the related underlying mechanisms. The fifth generation of MSCs was treated with 0, 10, 20 and 40 mM HD respectively. The viability of BMSCs was observed by MTT. Apoptosis were estimated by Hoechst 33342 staining and TUNEL assay. The disruption of mitochondrial transmembrane potential (MMP) was examined by JC-1 staining. Moreover, the expression of Bax and Bcl-2, cytochrome c release, and caspase-3 activity were determined by real-time RT-PCR, Western blot and Spectrophotometry. Our results showed that HD induced apoptosis in MSCs in a dose dependent manner. Moreover, HD downregulated the Bcl-2 expression,upregulated the Bax expression and the Bax/Bcl-2 ratio, promoted the disruption of MMP, induced the release of cytochrome c from mitochondria to cytosol, and increased the activity of caspase-3 in MSCs. These results indicate that HD induces apoptosis in MSCs and the activated mitochondria-dependent caspase-3 pathway may be involved in the HD-induced apoptosis.
Figures


Similar articles
-
2,5-hexanedione induces bone marrow mesenchymal stem cell apoptosis via inhibition of Akt/Bad signal pathway.J Cell Biochem. 2018 Apr;119(4):3732-3743. doi: 10.1002/jcb.26602. Epub 2018 Jan 11. J Cell Biochem. 2018. PMID: 29236316
-
Mesenchymal stem cells-conditioned medium protects PC12 cells against 2,5-hexanedione-induced apoptosis via inhibiting mitochondria-dependent caspase 3 pathway.Toxicol Ind Health. 2017 Feb;33(2):107-118. doi: 10.1177/0748233715598267. Epub 2016 Jul 10. Toxicol Ind Health. 2017. PMID: 26419259
-
C1q tumor necrosis factor-related protein-3 protects mesenchymal stem cells against hypoxia- and serum deprivation-induced apoptosis through the phosphoinositide 3-kinase/Akt pathway.Int J Mol Med. 2014 Jan;33(1):97-104. doi: 10.3892/ijmm.2013.1550. Epub 2013 Nov 7. Int J Mol Med. 2014. PMID: 24212403
-
2,5-Hexanedione induces human ovarian granulosa cell apoptosis through BCL-2, BAX, and CASPASE-3 signaling pathways.Arch Toxicol. 2012 Feb;86(2):205-15. doi: 10.1007/s00204-011-0745-7. Epub 2011 Sep 8. Arch Toxicol. 2012. PMID: 21901545
-
Duhuo Jisheng decoction treatment inhibits the sodium nitroprussiate‑induced apoptosis of chondrocytes through the mitochondrial‑dependent signaling pathway.Int J Mol Med. 2014 Dec;34(6):1573-80. doi: 10.3892/ijmm.2014.1962. Epub 2014 Oct 10. Int J Mol Med. 2014. PMID: 25339266
Cited by
-
Taurine inhibits 2,5-hexanedione-induced oxidative stress and mitochondria-dependent apoptosis in PC12 cells.Ind Health. 2017 Apr 7;55(2):108-118. doi: 10.2486/indhealth.2016-0044. Epub 2016 Nov 11. Ind Health. 2017. PMID: 27840369 Free PMC article.
-
NGF protects bone marrow mesenchymal stem cells against 2,5-hexanedione-induced apoptosis in vitro via Akt/Bad signal pathway.Mol Cell Biochem. 2019 Jul;457(1-2):133-143. doi: 10.1007/s11010-019-03518-7. Epub 2019 Mar 25. Mol Cell Biochem. 2019. PMID: 30911955
-
2,5-Hexanedione Affects Ovarian Granulosa Cells in Swine by Regulating the CDKN1A Gene: A Transcriptome Analysis.Vet Sci. 2023 Mar 7;10(3):201. doi: 10.3390/vetsci10030201. Vet Sci. 2023. PMID: 36977240 Free PMC article.
-
Protective role of taurine against oxidative stress (Review).Mol Med Rep. 2021 Aug;24(2):605. doi: 10.3892/mmr.2021.12242. Epub 2021 Jun 29. Mol Med Rep. 2021. PMID: 34184084 Free PMC article. Review.
-
Taurine Attenuates As2O3-Induced Autophagy in Cerebrum of Mouse Through Nrf2 Pathway.Adv Exp Med Biol. 2017;975 Pt 2:863-870. doi: 10.1007/978-94-024-1079-2_68. Adv Exp Med Biol. 2017. PMID: 28849506
References
-
- Neghab M, Soleimani E, Khamoushian K. (2012) Electrophysiological studies of shoemakers exposed to sub-TLV levels of n-hexane. J Occup Health 54, 376–82. - PubMed
-
- Kim MS, Park HR, Park M, Kim SJ, Kwon M, Yu BP, Chung HY, Kim HS, Kwack SJ, Kang TS, Kim SH, Lee J. (2009) Neurotoxic effect of 2,5-hexanedione on neural progenitor cells and hippocampal neurogenesis. Toxicology 260, 97–103. - PubMed
-
- Ogawa Y, Shimizu H, Kim SU. (1996) 2,5-Hexanedione induced apoptosis in cultured mouse DRG neurons. Int Arch Occup Environ Health 68, 495–7. - PubMed
-
- Strange P, Møller A, Ladefoged O, Lam HR, Larsen JJ, Arlien-Søborg P. (1991) Total number and mean cell volume of neocortical neurons in rats exposed to 2,5-hexanedione with and without acetone. Neurotoxicol Teratol 13, 401–6. - PubMed
Publication types
MeSH terms
Substances
LinkOut - more resources
Full Text Sources
Other Literature Sources
Research Materials

