

Early estimates of SEER cancer incidence for 2012: Approaches, opportunities, and cautions for obtaining preliminary estimates of cancer incidence
- PMID: 25739953
- PMCID: PMC4457672
- DOI: 10.1002/cncr.29304
Early estimates of SEER cancer incidence for 2012: Approaches, opportunities, and cautions for obtaining preliminary estimates of cancer incidence
Abstract
Background: The National Cancer Institute's Surveillance, Epidemiology, and End Results (SEER) program collects and publishes population-based cancer incidence data from registries covering approximately 28% (seer.cancer.gov/registries/data.html) of the US population. SEER incidence rates are released annually in April from data submitted the prior November. The time needed to identify, consolidate, clean, and submit data requires the latest diagnosis year included to be 3 years before release. Approaches, opportunities, and cautions for an earlier release of data based on a February submission are described.
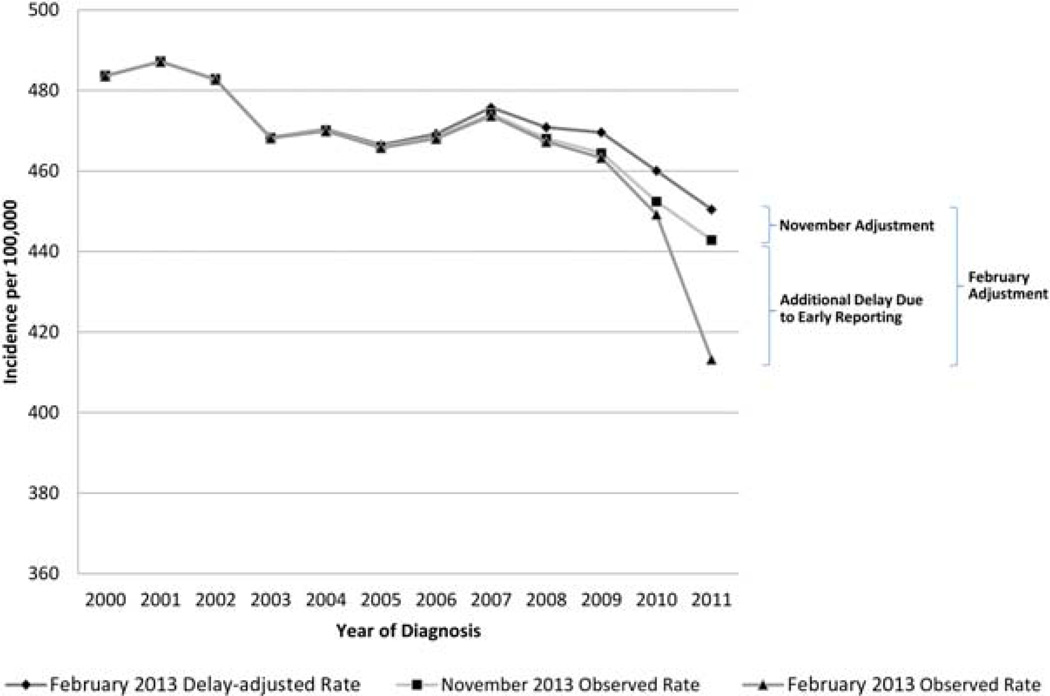
Methods: First, cases submitted in February for the latest diagnosis year represented 92% to 98% of those in the following November submission. A reporting delay model was used to statistically adjust counts in recent diagnosis years for cases projected in the future. February submissions required larger adjustment factors than November submissions. Second, trends were checked to assess the validity.
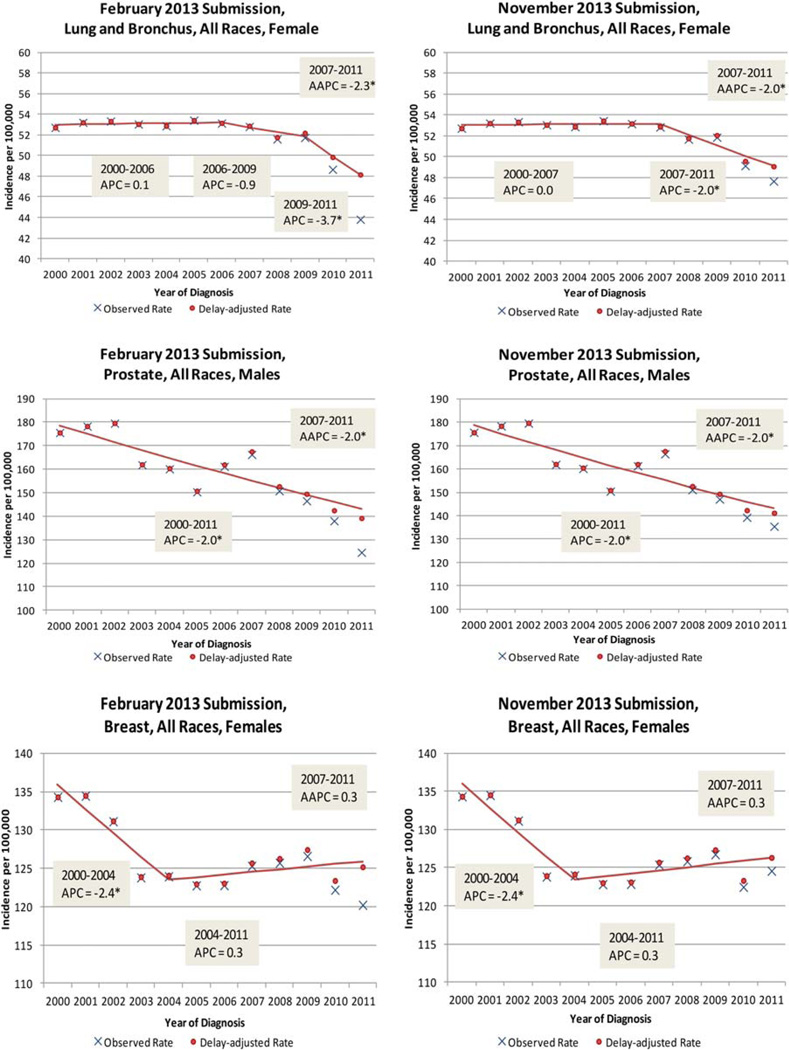
Results: Most cancer sites had similar annual percent change (APC) trends for February and November 2013. Male colon and rectum cancer and female lung and bronchus cancer showed an acceleration in declining APC trends only in February. Average annual percent change (AAPC) trends for the 2 submissions were similar for all sites.
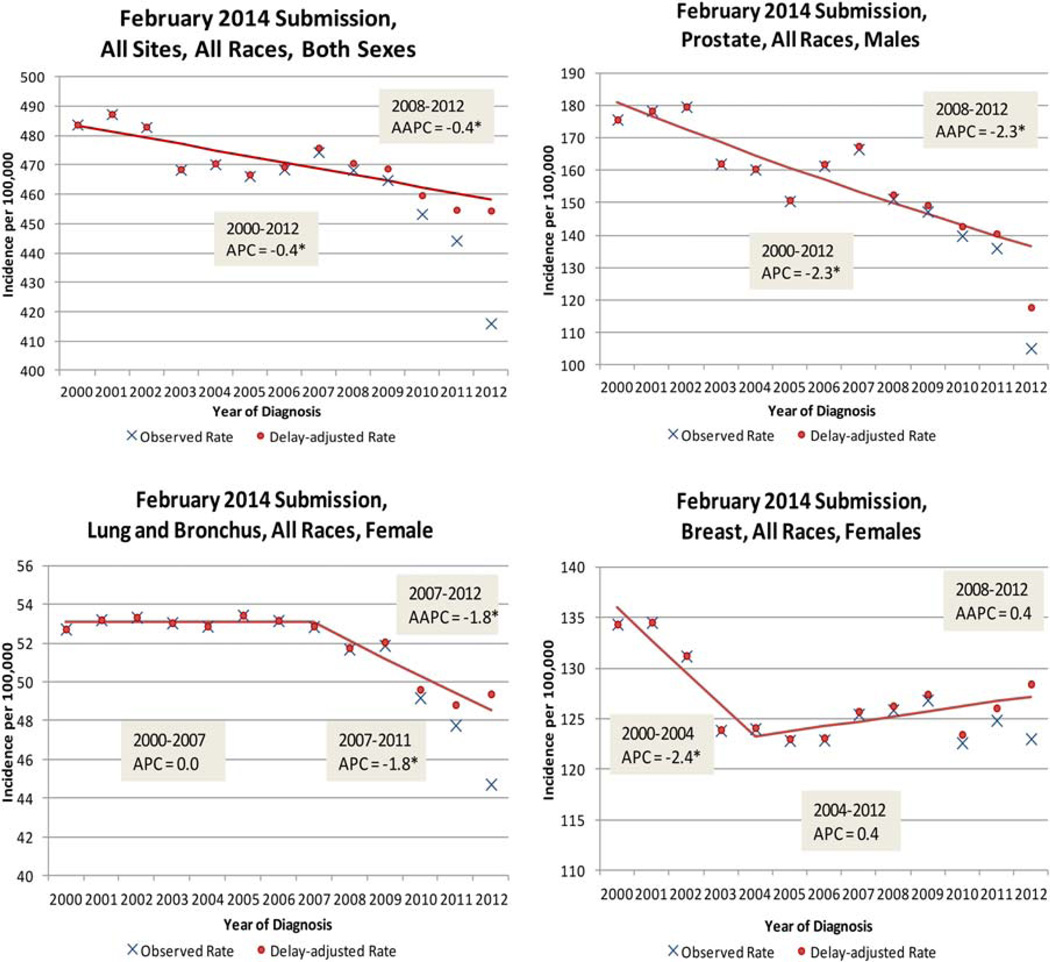
Conclusions: For the first time, preliminary 2012 incidence rates, based on February submissions, are provided. An accelerated decline starting in 2008 for male colon and rectum cancer rates and male lung cancer rates did not persist when 2012 data were added. An earlier release of SEER data is possible. Caution must be exercised when one is interpreting changing trends. Use of the more conservative AAPC is advised.
Keywords: annual percent change; average annual percent change; cancer incidence trends; delay adjustment; population-based registry data.
© 2015 American Cancer Society.
Conflict of interest statement
CONFLICT OF INTEREST DISCLOSURES
The authors made no disclosure.
Figures

References
-
- Howlader N, Noone AM, Krapcho M, et al. Cancer Statistics Review, 1975–2011. Bethesda, MD: National Cancer Institute; 2014.
-
- Surveillance, Epidemiology, and End Results (SEER) Program. Cancer stat fact sheets. [Accessed November 4, 2014]; http://seer.cancer.gov/statfacts/.
-
- National Cancer Institute. Cancer query system: delay-adjusted SEER incidence factors. [Accessed November 4, 2014]; http://surveillance.cancer.gov/delay/canques.html.
-
- Midthune DN, Fay M, Clegg LX, Feuer EJ. Modeling reporting delays and reporting corrections in cancer registry data. J Am Stat Assoc. 2005;100:61–70.
-
- Kim HJ, Fay MP, Feuer EJ, Midthune DN. Permutation tests for joinpoint regression with applications to cancer rates. Stat Med. 2000;19:335–351. - PubMed
MeSH terms
Grants and funding
LinkOut - more resources
Full Text Sources
Other Literature Sources
Miscellaneous
