Diagnostic accuracy of PLA2R autoantibodies and glomerular staining for the differentiation of idiopathic and secondary membranous nephropathy: an updated meta-analysis
- PMID: 25740009
- PMCID: PMC4350087
- DOI: 10.1038/srep08803
Diagnostic accuracy of PLA2R autoantibodies and glomerular staining for the differentiation of idiopathic and secondary membranous nephropathy: an updated meta-analysis
Abstract
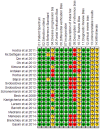
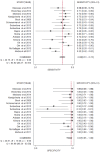
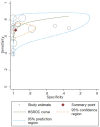
The diagnostic performance of M-type phospholipase A2 receptor (PLA2R) autoantibodies and PLA2R glomerular staining in discriminating between idiopathic membranous nephropathy (iMN) and secondary membranous nephropathy (sMN) has not been fully evaluated. We conducted an updated meta-analysis to investigate the accuracy and clinical value of serological anti-PLA2R test and histological PLA2R staining for differentiation iMN from sMN. A total of 19 studies involving 1160 patients were included in this meta-analysis. The overall sensitivity, specificity, diagnostic odds ratio (DOR) and area under the receiver operating characteristic curve (AUROC) of serum anti-PLA2R were 0.68 (95% CI, 0.61-074), 0.97 (95% CI, 0.85-1.00), 73.75 (95% CI, 12.56-432.96) and 0.82 (95% CI, 0.78-0.85), respectively, with substantial heterogeneity (I(2) = 86.42%). Subgroup analyses revealed the study design, publication type, study origin, assay method might account for the heterogeneity. Additionally, the overall sensitivity, specificity, DOR and AUROC of glomerular PLA2R staining were 0.78 (95% CI, 0.72-0.83), 0.91 (95% CI, 0.75-0.97), 34.70 (95% CI, 9.93-121.30) and 0.84 (95% CI, 0.81-0.87), respectively, without heterogeneity (I(2) = 0%). Serological anti-PLA2R testing has diagnostic value, but it must be interpreted in context with patient clinical characteristics and histological PLA2R staining in seronegative patients is recommended.
Conflict of interest statement
The authors declare no competing financial interests.
Figures


References
-
- Ronco P. & Debiec H. Pathogenesis of membranous nephropathy: recent advances and future challenges. Nat Rev Nephrol. 8, 203–213 (2012). - PubMed
-
- Hofstra J. M., Fervenza F. C. & Wetzels J. M. Treatment of idiopathic membranous nephropathy. Nat Rev Nephrol. 9, 443–458 (2013). - PubMed
-
- Jefferson J. A. & Couser W. G. Therapy of membranous nephropathy associated with malignancy and secondary causes. Semin Nephrol. 23, 400–405 (2003). - PubMed
-
- Jhaveri K. D. et al. Glomerular diseases seen with cancer and chemotherapy: A narrative review. Kidney Int. 84, 34–44 (2013). - PubMed
Publication types
MeSH terms
Substances
LinkOut - more resources
Full Text Sources
Other Literature Sources
Molecular Biology Databases

