. 2015 Apr;49(4):397-410.
doi: 10.3109/10715762.2015.1006215. Epub 2015 Mar 5.

Dopamine D1 and D5 receptors differentially regulate oxidative stress through paraoxonase 2 in kidney cells

Affiliations

Dopamine D1 and D5 receptors differentially regulate oxidative stress through paraoxonase 2 in kidney cells

S Yang et al. Free Radic Res. 2015 Apr.

Abstract

Background: The renal dopaminergic system plays an important role in the pathogenesis of hypertension. Dopamine D1-like receptors (D1R and D5R) decrease reactive oxygen species (ROS) production via inhibition of pro-oxidant enzymes such as NADPH oxidase. Paraoxonase 2 (PON2) is also involved in the inhibition of NADPH oxidase activity. Therefore, we tested the hypothesis that D1R and D5R inhibit ROS production by increasing the expression of PON2, including those in membrane microdomains.

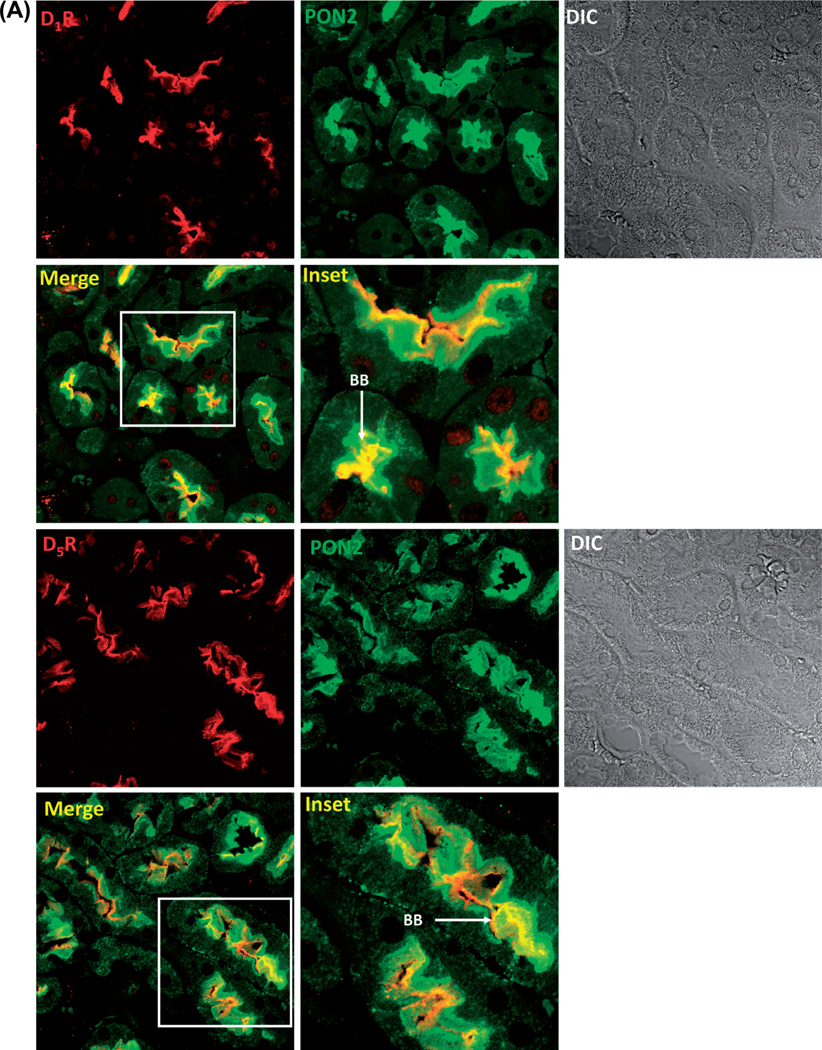
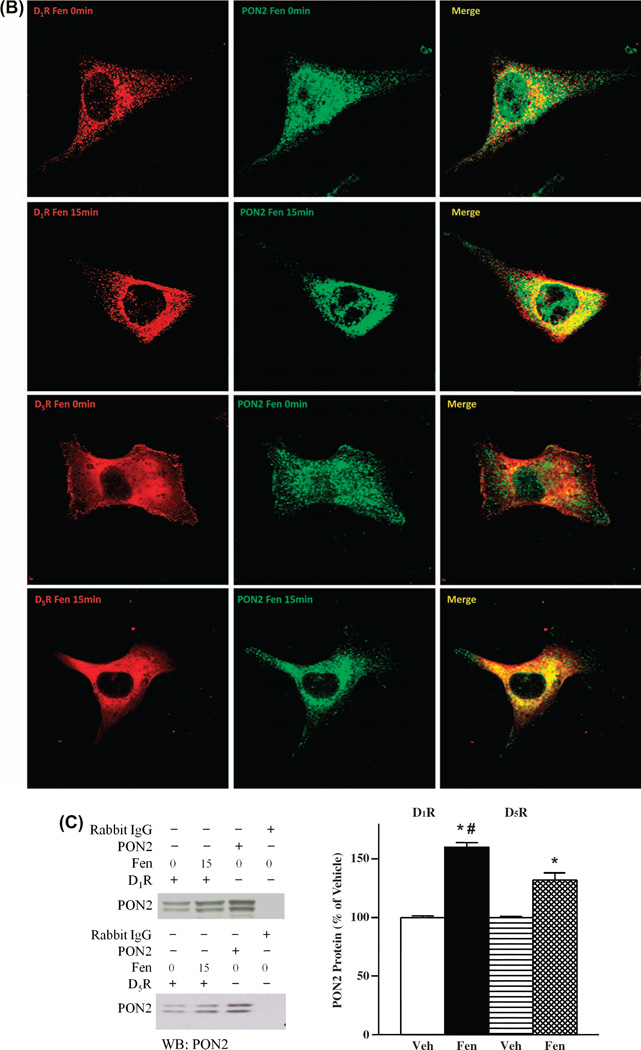
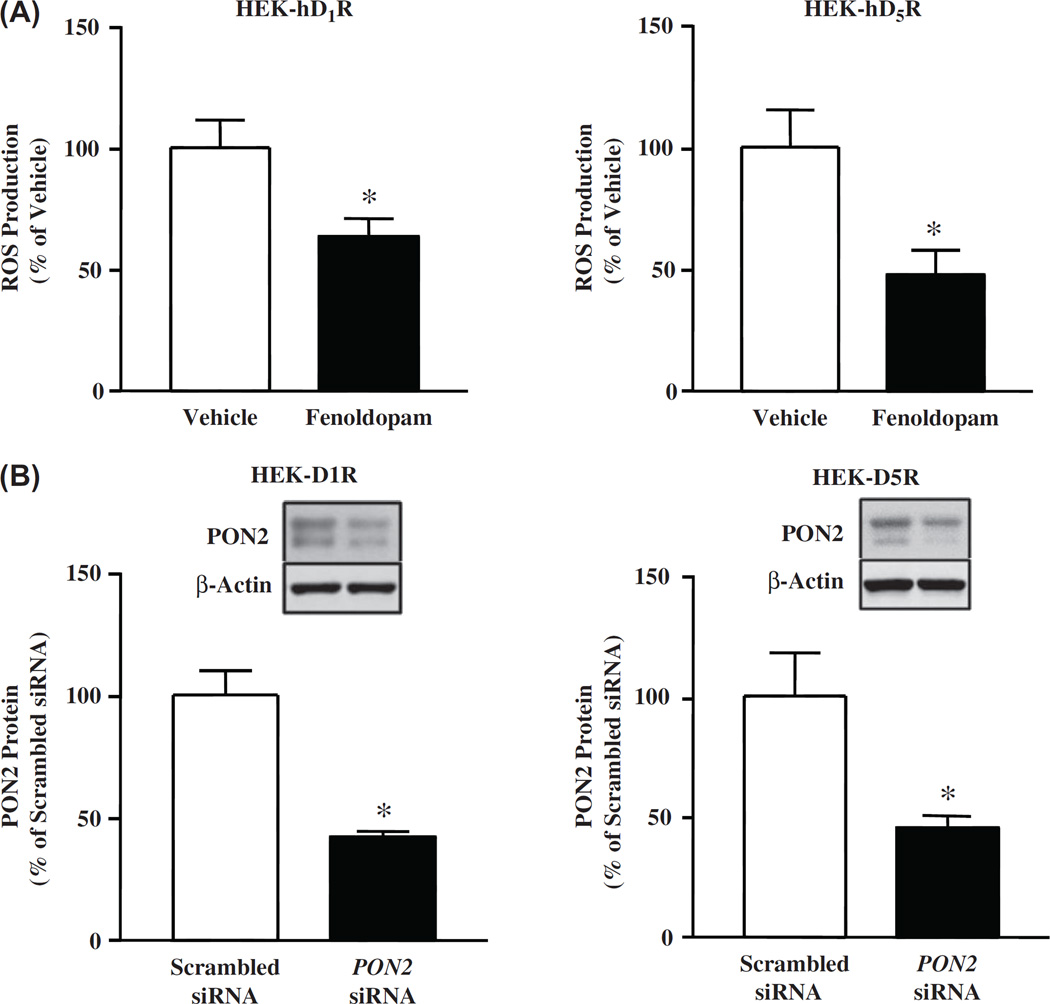
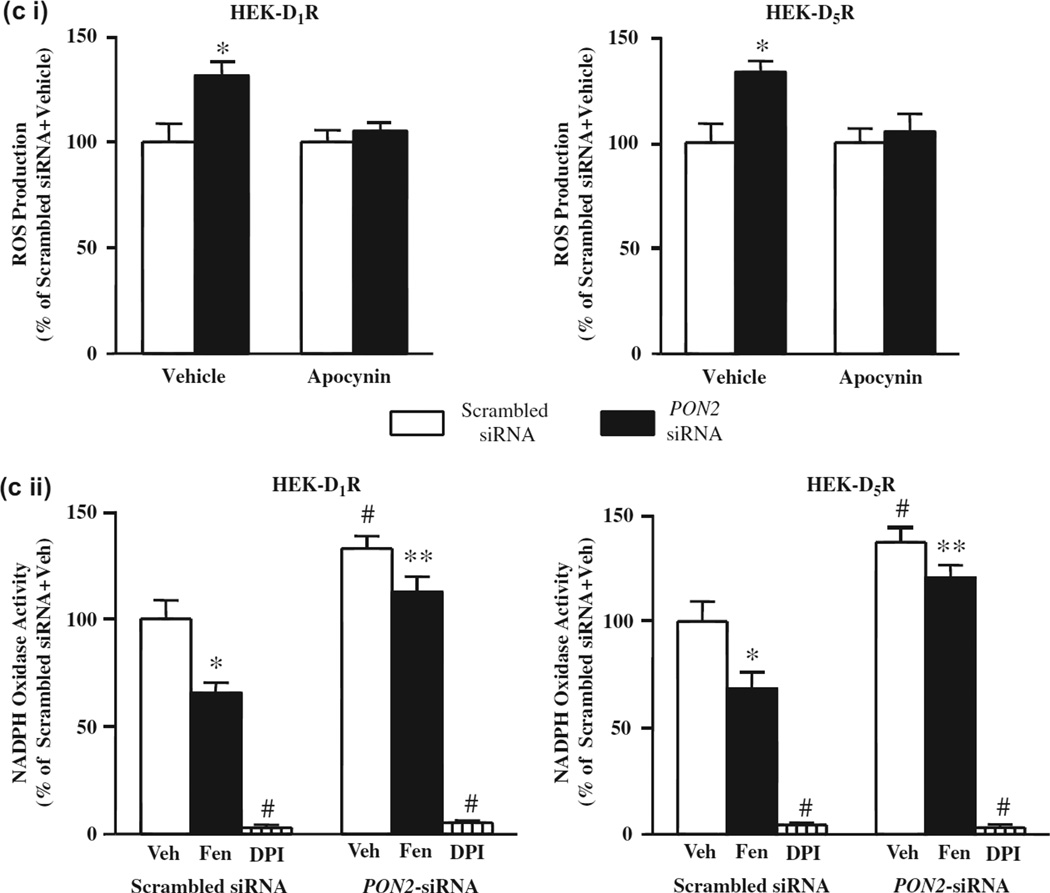
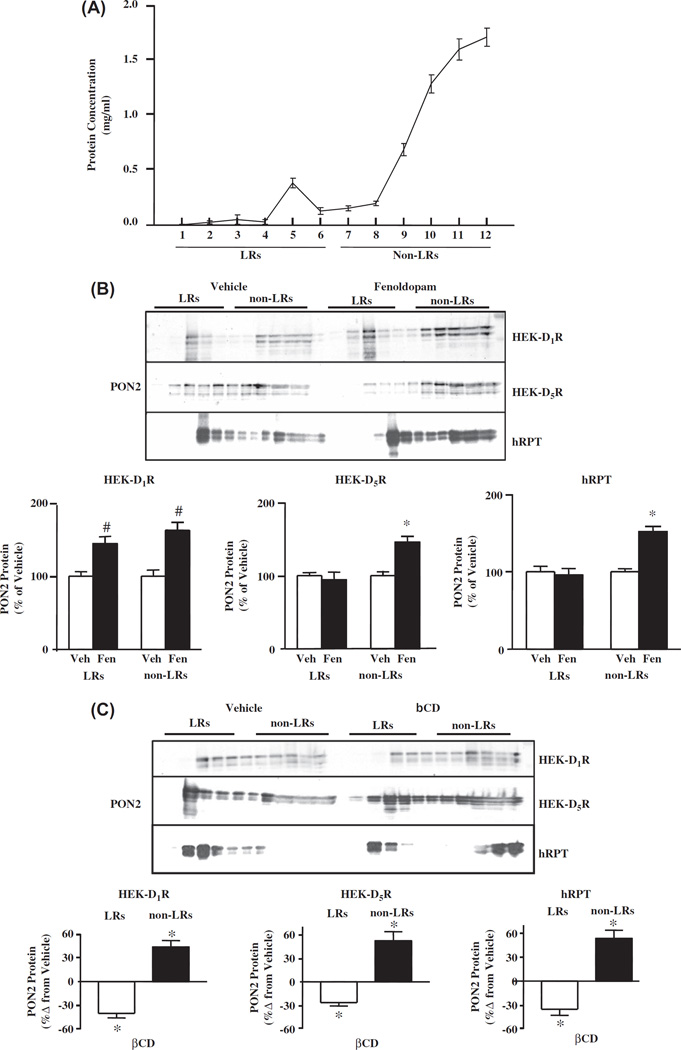
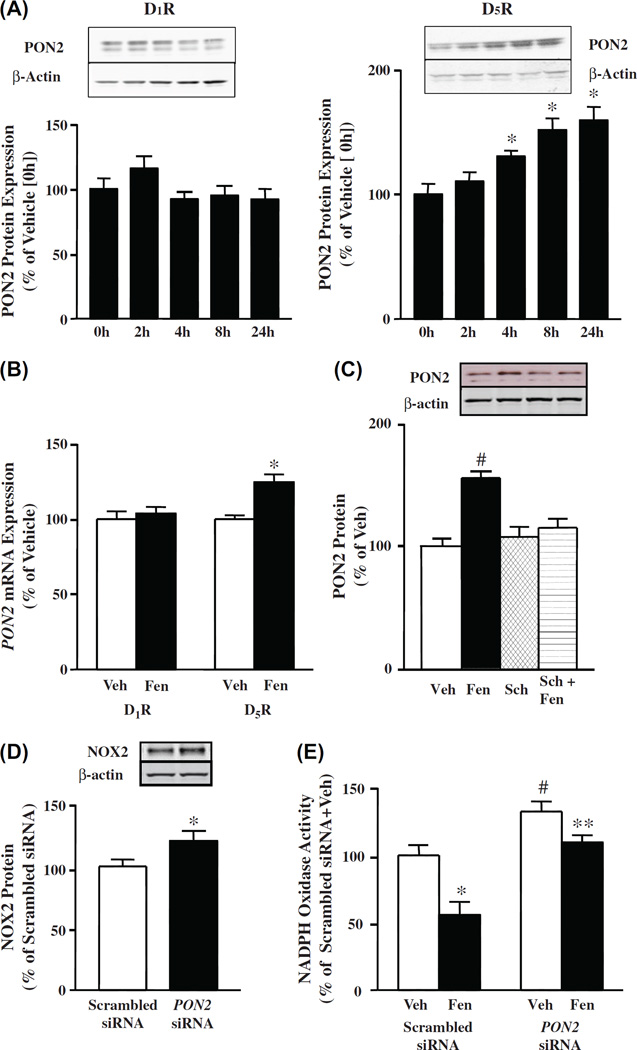
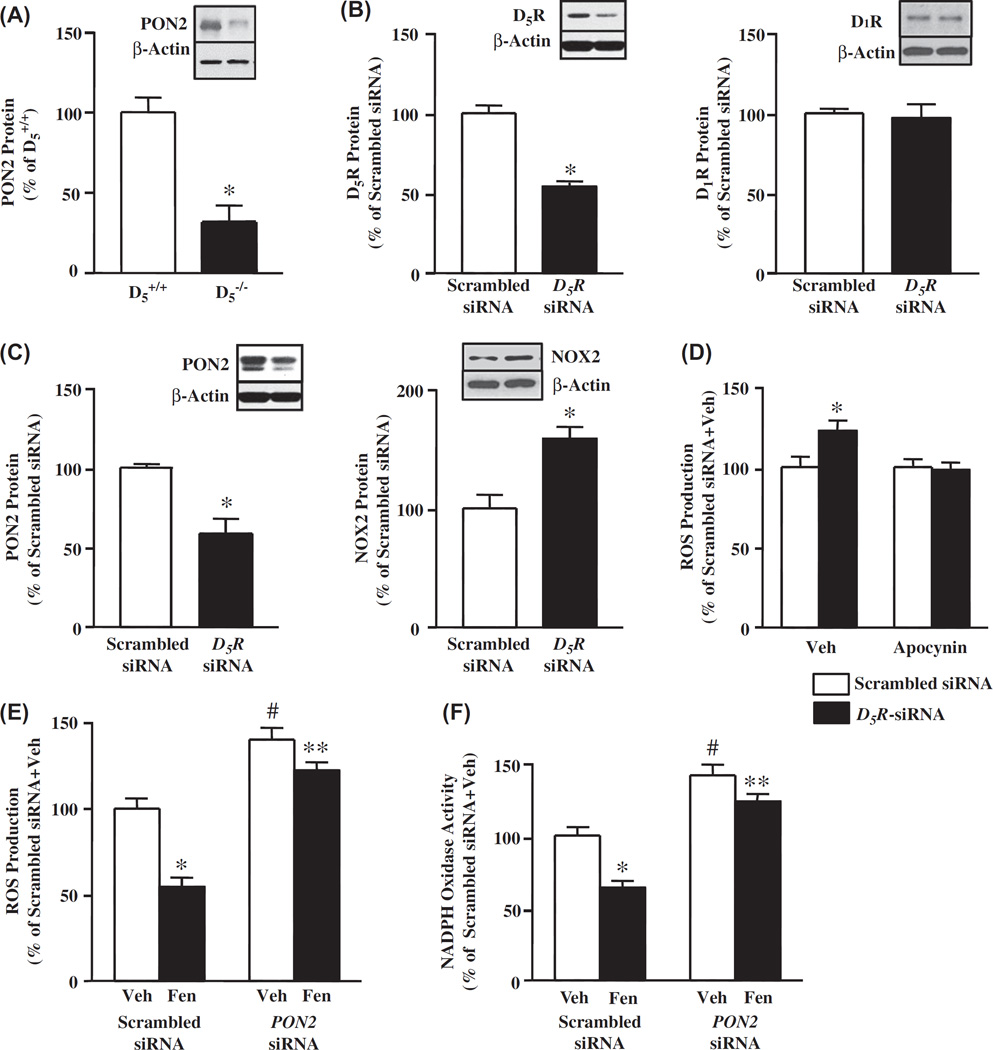
Methods and results: PON2 colocalized with D1R and D5R in mouse renal proximal tubules (RPTs), human RPT (hRPT) cells, and HEK293 cells heterologously expressing human D1R (HEK-hD1R) or D5R (HEK-hD5R). Fenoldopam, an agonist for both D1R and D5R, increased PON2 co-immunoprecipitation with D1R and D5R in HEK-hD1R and HEK-hD5R cells, respectively. Silencing PON2 increased ROS production and NADPH oxidase activity, and impaired the inhibitory effect of fenoldopam. Fenoldopam increased PON2 protein in both lipid rafts (LRs) and non-LRs in HEK-hD1R cells, but only in non-LRs in HEK-hD5R and hRPT cells. Long-term (hrs) fenoldopam stimulation increased PON2 protein in a time-dependent manner in HEK-hD5R, but not in HEK-hD1R cells. Because the effects of fenoldopam on non-LR and total PON2 expressions were similar in HEK-hD5R and hRPT cells, additional studies were performed to determine the relationship between D5R and PON2. Renal PON2 protein was decreased in D5(-/-) mice. In hRPT cells, silencing D5R decreased PON2 expression and increased ROS production.

Conclusions: We conclude that D1-like receptors inhibit ROS production by altering PON2 distribution in membrane microdomains in the short-term, and by increasing PON2 expression in the long-term.

Keywords: NADPH oxidase; dopamine receptors; lipid rafts; paraoxonase 2; reactive oxygen species.


Figures

Figure 1
Figure 1
Colocalization of and interaction between PON2 and D1R or D5R. (A). D1-like receptors, D1R and D5R, colocalize with PON2 in the mouse kidney. Formalin-fixed, paraffin-embedded mouse kidney sections were studied for the colocalization of D1R (red) and PON2 (green), as well as D5R (red) and PON2 (green), by confocal microscopy. The colocalization is shown as yellow in brush border membranes (BB) in the merge images. DIC = differential interference contrast. (B). D1-like receptors, D1R and D5R, colocalize with PON2 in hRPT cells. D1R (red) and D5R (red) are expressed at the plasma membrane and cytosol, while PON2 (green) is mainly distributed in the cytosol. Fenoldopam treatment (1 µM, 15 min) increased the colocalization of D1R and PON2, as well as D5R and PON2, primarily in the cytosol, shown as yellow in the merge images. Images are representative of three separate experiments. (C). D1R and PON2 and D5R and PON2 physically interact in HEK-hD1R and HEK-hD5R cells, respectively. The cells were treated with vehicle (Veh) or fenoldopam (Fen, 1 µM) for 15 min. The cell lysates were immunoprecipitated with anti-D1R, anti-D5R, and anti-PON2 (positive control) antibodies and normal rabbit IgG (negative control). The immunocomplexes were then immunoblotted with PON2 antibody. The blots are representative of one of four separate experiments. Values are mean ± SEM, *P < 0.05 vs Veh (control), #P < 0.05 vs others, the one-way factorial ANOVA, and the Newman–Keuls test.
Figure 1
Figure 1
Colocalization of and interaction between PON2 and D1R or D5R. (A). D1-like receptors, D1R and D5R, colocalize with PON2 in the mouse kidney. Formalin-fixed, paraffin-embedded mouse kidney sections were studied for the colocalization of D1R (red) and PON2 (green), as well as D5R (red) and PON2 (green), by confocal microscopy. The colocalization is shown as yellow in brush border membranes (BB) in the merge images. DIC = differential interference contrast. (B). D1-like receptors, D1R and D5R, colocalize with PON2 in hRPT cells. D1R (red) and D5R (red) are expressed at the plasma membrane and cytosol, while PON2 (green) is mainly distributed in the cytosol. Fenoldopam treatment (1 µM, 15 min) increased the colocalization of D1R and PON2, as well as D5R and PON2, primarily in the cytosol, shown as yellow in the merge images. Images are representative of three separate experiments. (C). D1R and PON2 and D5R and PON2 physically interact in HEK-hD1R and HEK-hD5R cells, respectively. The cells were treated with vehicle (Veh) or fenoldopam (Fen, 1 µM) for 15 min. The cell lysates were immunoprecipitated with anti-D1R, anti-D5R, and anti-PON2 (positive control) antibodies and normal rabbit IgG (negative control). The immunocomplexes were then immunoblotted with PON2 antibody. The blots are representative of one of four separate experiments. Values are mean ± SEM, *P < 0.05 vs Veh (control), #P < 0.05 vs others, the one-way factorial ANOVA, and the Newman–Keuls test.
Figure 2
Figure 2
Role of PON2 in the inhibitory effect of D1R and D5R on oxidative stress. (A). Fenoldopam decreases ROS production in HEK-hD1R and HEK-hD5R cells. The cells were treated with vehicle, which served as control, or fenoldopam (1 µM, 15 min). ROS production was measured using DCFDA, normalized by protein concentration. The vehicle was assigned a value of 100%. Data are mean ± SEM, n = 4/group, *P < 0.05 vs vehicle, t-test. (B). Decrease in PON2 protein, normalized by β-actin, in HEK-hD1R and HEK-hD5R cells transfected with PON2-siRNA (10 nM), but not scrambled siRNA (10 nM), for 48 h; Scrambled non-silencing siRNA was assigned a value of 100%. The data, normalized by β-actin, are shown as mean ± SEM, n = 3/group, *P < 0.05 vs scrambled siRNA, t-test. The inserted blots are representative one of three immunoblots. (C). Decreasing PON2 expression increases ROS production, via an increase in NOX activity, in HEK-hD1R and HEK-hD5R cells, (i) PON2 silencing increases ROS production that is blocked by the NOX inhibitor apocynin. HEK-hD1R and HEK-hD5R cells transfected with PON2-siRNA (10 nM) or scrambled siRNA (10 nM) for 48 h were treated with apocynin (10 µM) or vehicle for 60 min. ROS production was measured using DCFDA. Scrambled siRNA was assigned a value of 100%. The data, normalized by protein concentration, are shown as mean ± SEM, n = 6/group. *P < 0.05 vs others, one-way factorial ANOVA, Newman–Keuls test, (ii) PON2 silencing increases NOX activity and impairs the inhibitory effect of fenoldopam. HEK-hD1R and HEK-hD5R cells, transfected with PON2-siRNA (10 nM) and scrambled non-silencing siRNA (10 nM, 48 h), were treated with vehicle (Veh), fenoldopam (Fen, 1 µM, 15 min), or DPI (5 µM, 60 min). NOX activity in the cell membrane was measured in the presence of 5 µM lucigenin and 100 µM NADPH. Veh + scrambled siRNA was assigned a value of 100%. The data, normalized by protein concentration, are shown as mean ± SEM, n = 6–8/group. *P < 0.05 vs. Veh + scrambled siRNA, #P < 0.05 vs others, **P < 0.05 vs Fen + scrambled siRNA, one-way factorial ANOVA, Newman–Keuls test. DPI = diphenyleneiodonium chloride.
Figure 2
Figure 2
Role of PON2 in the inhibitory effect of D1R and D5R on oxidative stress. (A). Fenoldopam decreases ROS production in HEK-hD1R and HEK-hD5R cells. The cells were treated with vehicle, which served as control, or fenoldopam (1 µM, 15 min). ROS production was measured using DCFDA, normalized by protein concentration. The vehicle was assigned a value of 100%. Data are mean ± SEM, n = 4/group, *P < 0.05 vs vehicle, t-test. (B). Decrease in PON2 protein, normalized by β-actin, in HEK-hD1R and HEK-hD5R cells transfected with PON2-siRNA (10 nM), but not scrambled siRNA (10 nM), for 48 h; Scrambled non-silencing siRNA was assigned a value of 100%. The data, normalized by β-actin, are shown as mean ± SEM, n = 3/group, *P < 0.05 vs scrambled siRNA, t-test. The inserted blots are representative one of three immunoblots. (C). Decreasing PON2 expression increases ROS production, via an increase in NOX activity, in HEK-hD1R and HEK-hD5R cells, (i) PON2 silencing increases ROS production that is blocked by the NOX inhibitor apocynin. HEK-hD1R and HEK-hD5R cells transfected with PON2-siRNA (10 nM) or scrambled siRNA (10 nM) for 48 h were treated with apocynin (10 µM) or vehicle for 60 min. ROS production was measured using DCFDA. Scrambled siRNA was assigned a value of 100%. The data, normalized by protein concentration, are shown as mean ± SEM, n = 6/group. *P < 0.05 vs others, one-way factorial ANOVA, Newman–Keuls test, (ii) PON2 silencing increases NOX activity and impairs the inhibitory effect of fenoldopam. HEK-hD1R and HEK-hD5R cells, transfected with PON2-siRNA (10 nM) and scrambled non-silencing siRNA (10 nM, 48 h), were treated with vehicle (Veh), fenoldopam (Fen, 1 µM, 15 min), or DPI (5 µM, 60 min). NOX activity in the cell membrane was measured in the presence of 5 µM lucigenin and 100 µM NADPH. Veh + scrambled siRNA was assigned a value of 100%. The data, normalized by protein concentration, are shown as mean ± SEM, n = 6–8/group. *P < 0.05 vs. Veh + scrambled siRNA, #P < 0.05 vs others, **P < 0.05 vs Fen + scrambled siRNA, one-way factorial ANOVA, Newman–Keuls test. DPI = diphenyleneiodonium chloride.
Figure 3
Figure 3
Localization of PON2 in membrane LRs and non-LRs (A). Protein concentrations of sucrose gradient fractions of hRPT cells. LRs are in fractions 1 to 6, and non-LRs are in fractions 7 to 12. (B). Effect of fenoldopam on the expression of PON2 protein in LRs and non-LRs of HEK-hD1R, HEK-hD5R and hRPT cells. HEK-hD1R, HEK-hD5R and hRPT cells were treated with vehicle (Veh, which served as control) or fenoldopam (Fen, 1 µM, 15 min), and then subjected to sucrose gradient centrifugation, as described in “Methods”. The blots are representative of one of five to six separate experiments. Veh was assigned a value of 100%. The data are mean ± SEM, n = 5–6/group, #P < 0.05 vs Veh, HEK-D1R, *P < 0.05 vs others, one-way factorial ANOVA, Newman–Keuls test. (C). Effect of methyl-β-cyclodextrin (βCD) on PON2 protein in LRs and non-LRs of HEK-hD1R, HEK-hD5R and hRPT cells. HEK-hD1R, HEK-hD5R and hRPT cells were treated with vehicle (which served as control) or βCD (2%) for 1 h, then subjected to sucrose gradient centrifugation, as described in “Methods”. The blots are representative of three to four separate experiments. The percent change from vehicle was assigned a value of 0%. The data are shown as mean ± SEM, n = 3–4/group, *P < 0.05 vs vehicle, one-way factorial ANOVA, Newman–Keuls test.
Figure 4
Figure 4
Effect of long-term stimulation of D1R and D5R on PON2 protein in HEK-hD1R and HEK-hD5R cells. (A). Time course of the effect of fenoldopam on PON2 protein in HEK-hD1R and HEK-hD5R cells. The cells were treated with fenoldopam (1 µM) at varying durations (0, 2, 4, 8, 24 h) as described in “Methods”. Zero h (0 h) time was assigned a value of 100%. The data, normalized by β-actin, are shown as mean ± SEM, n = 4–6/group; *P < 0.05 vs control (0 h), one-way factorial ANOVA, Newman–Keuls test. (B). Effect of fenoldopam on PON2 mRNA expression in HEK-hD1R and HEK-hD5R cells. The cells were treated with fenoldopam (Fen, 1 µM) for 24 h. mRNA was prepared from the cell pellets, as described in “Methods”. Vehicle (Veh, control) was assigned a value of 100%. The data, normalized by GAPDH, are shown as mean ± SEM, n = 6/group, *P < 0.05 vs Veh, one-way factorial ANOVA, Newman–Keuls test. (C). Effect of fenoldopam and D1-like receptor antagonist Sch 23390 on PON2 protein in HEK-hD5R cells. The cells were treated with vehicle (Veh, which served as control, 24 h), fenoldopam (Fen, 1 µM, 24 h), Sch23390 (Sch, 1 µM, 24 h), or pretreated with Sch (1 µM, 1 h) and then incubated with Fen (1 µM, 24 h) (Sch + Fen). Veh was assigned a value of 100%. The data, normalized by β-actin, are shown as mean ± SEM, n = 4/group, #P < 0.05 vs others, one-way factorial ANOVA, Newman–Keuls test. (D). Effect of silencing PON2 on NOX2 protein in HEK-hD5R cells. Cells were transfected with PON2-siRNA (10 nM) or scrambled siRNA (10 nM) for 48 h. Scrambled siRNA was assigned a value of 100%. The data, normalized by β-actin, are shown as mean ± SEM, n = 3/group, compared with scrambled siRNA assigned a value of 100%, *P < 0.05 vs scrambled siRNA, t-test. (E). Effect of silencing of PON2 on NOX activity in HEK-hD5R cells. Cells were transfected with PON2-siRNA (10 nM) or scrambled non-silencing siRNA (10 nM) for 48 h. The cells were then treated with fenoldopam (Fen, 1 µM) or vehicle (Veh) for 24 h. Membrane NOX activity was measured in the presence of 5 µM lucigenin and 100 µM NADPH. Veh + scrambled siRNA was assigned a value of 100%. Data, normalized by protein concentration, are shown as mean ± SEM, n = 6/group, *P < 0.05 vs Veh + scrambled siRNA, #P < 0.05 vs others, **P < 0.05 vs Fen + scrambled siRNA, one-way factorial ANOVA, Newman–Keuls test.
Figure 5
Figure 5
Effect of disruption of the D5R gene (Drd5) in mice, or silencing of Drd5 in hRPT cells, on PON2 and NOX2 protein and ROS production. (A). Renal PON2 protein is decreased in D5−/− mice relative to their wild-type (D5+/+) littermates. Renal cortical homogenates were immunoblotted with PON2 antibody. Data from D5+/+ mice were given a value of 100%. Data, normalized by β-actin, are shown as mean ± SEM, n = 4–6/group; *P < 0.05 vs D5+/+ mice, t-test. The blot is representative of four to six experiments. (B). Effect of silencing Drd5 on D5R and D1R proteins in hRPT cells. Cells were transfected with human D5R-siRNA (5 nM) or scrambled siRNA (5 nM) for 48 h. Scrambled siRNA was assigned a value of 100%. Data, normalized by β-actin, are shown as mean ± SEM, n = 3–4/group, *P < 0.05 vs scrambled siRNA, t-test. The blots are representative of three to four separate experiments. (C). Effect of silencing Drd5 on PON2 and NOX2 protein expression in hRPT cells. Cells were transfected with human D5R-siRNA (5 nM) or scrambled siRNA (5 nM) for 48 h. Scrambled siRNA was assigned a value of 100%. Data, normalized by β-actin, are shown as mean ± SEM of 3–4/groups, *P < 0.05, t-test vs scrambled siRNA. The blot is representative of three to four separate experiments. (D). Effect of silencing of Drd5 and apocynin on ROS production in hRPT cells. The cells were transfected with D5R-siRNA (5 nM) or scrambled siRNA (5 nM) for 48 h. The cells were then treated with vehicle (Veh) or apocynin (10 µM) for 30 min. ROS production was measured using DCFDA. Vehicle + scrambled siRNA was assigned a value of 100%. Data, normalized by protein concentration, are shown as mean ± SEM, n = 6/groups, *P < 0.05 vs others, one-way factorial ANOVA, Newman–Keuls test. (E). Effect of silencing PON2 on ROS production in hRPT cells. The cells were transfected with PON2-siRNA (10 nM) or scrambled siRNA (10 nM) for 48 h. The cells were then treated with fenoldopam (Fen, 1 µM) or vehicle (Veh) for 24 h. ROS production was measured using DCFDA. Veh + scrambled siRNA was assigned a value of 100%. Data, normalized by protein concentration, are shown as mean ± SEM, n = 6–9/group; *P < 0.05 vs Veh + scrambled siRNA, #P < 0.05 vs others, **P < 0.05 vs fenoldopam + scrambled siRNA, one-way factorial ANOVA, Newman–Keuls test. (F). Effect of silencing PON2 on NOX activity in hRPT cells. Cells were transfected with PON2-siRNA (10 nM) or scrambled siRNA (10 nM) for 48 h, then treated with fenoldopam (Fen, 1 µM) or vehicle (Veh) for 24 h. Membrane NOX activity was measured in the presence of 5 µM lucigenin and 100 µM NADPH. Veh + scrambled siRNA was assigned a value of 100%. Data, normalized by protein concentration, are shown as mean ± SEM, n = 6/group, *P < 0.05 vs Veh + scrambled siRNA, #P < 0.05 vs others, **P < 0.05 vs Fen + scrambled siRNA, one-way factorial ANOVA, Newman–Keuls test.

References

    1. Hussain T, Lokhandwala MF. Renal dopamine receptors and hypertension. Exp Biol Med. 2003;228:134–142. - PubMed
    1. Zeng C, Zhang M, Asico LD, Eisner GM, Jose PA. The dopaminergic system in hypertension. Clin Sci. 2007;112:583–597. - PubMed
    1. Armando I, Villar VA, Jose PA. Dopamine and renal function and blood pressure regulation. Compr Physiol. 2011;1:1075–1117. - PMC - PubMed
    1. Beaulieu JM, Gainetdinov RR. The physiology, signaling, and pharmacology of dopamine receptors. Pharmacol Rev. 2011;63:182–217. - PubMed
    1. Asghar M, Tayebati SK, Lokhandwala MF, Hussain T. Potential dopamine-1 receptor stimulation in hypertension management. Curr Hypertens Rep. 2011;13:294–302. - PubMed

Publication types

LinkOut - more resources