. 2015 Mar 4;35(9):3782-93.
doi: 10.1523/JNEUROSCI.4423-14.2015.

Early-onset epileptic encephalopathy caused by gain-of-function mutations in the voltage sensor of Kv7.2 and Kv7.3 potassium channel subunits

Affiliations

Early-onset epileptic encephalopathy caused by gain-of-function mutations in the voltage sensor of Kv7.2 and Kv7.3 potassium channel subunits

Francesco Miceli et al. J Neurosci. .

Abstract

Mutations in Kv7.2 (KCNQ2) and Kv7.3 (KCNQ3) genes, encoding for voltage-gated K(+) channel subunits underlying the neuronal M-current, have been associated with a wide spectrum of early-onset epileptic disorders ranging from benign familial neonatal seizures to severe epileptic encephalopathies. The aim of the present work has been to investigate the molecular mechanisms of channel dysfunction caused by voltage-sensing domain mutations in Kv7.2 (R144Q, R201C, and R201H) or Kv7.3 (R230C) recently found in patients with epileptic encephalopathies and/or intellectual disability. Electrophysiological studies in mammalian cells transfected with human Kv7.2 and/or Kv7.3 cDNAs revealed that each of these four mutations stabilized the activated state of the channel, thereby producing gain-of-function effects, which are opposite to the loss-of-function effects produced by previously found mutations. Multistate structural modeling revealed that the R201 residue in Kv7.2, corresponding to R230 in Kv7.3, stabilized the resting and nearby voltage-sensing domain states by forming an intricate network of electrostatic interactions with neighboring negatively charged residues, a result also confirmed by disulfide trapping experiments. Using a realistic model of a feedforward inhibitory microcircuit in the hippocampal CA1 region, an increased excitability of pyramidal neurons was found upon incorporation of the experimentally defined parameters for mutant M-current, suggesting that changes in network interactions rather than in intrinsic cell properties may be responsible for the neuronal hyperexcitability by these gain-of-function mutations. Together, the present results suggest that gain-of-function mutations in Kv7.2/3 currents may cause human epilepsy with a severe clinical course, thus revealing a previously unexplored level of complexity in disease pathogenetic mechanisms.

Keywords: Kv7 potassium channels; epileptic encephalopathies; gating; mutations; voltage-sensing domain.


Figures

Figure 1.
Figure 1.
Schematic drawing of a Kv7 subunit and location of the naturally-occurring mutations studied in the present work. A, Topological representation of a single Kv7 subunit. Arrows indicate the location of the mutations investigated (shaded in gray); the negatively charged residues E130 and E140 in S2, and D172 in S3, are boxed in white. A–D indicate the four putative α-helical domains identified in the Kv7 C-terminal region. B, Sequence alignment of the S2 and S4 segments of the indicated Kv subunits (www.ebi.ac.uk/Tools/psa/). Residues are colored according to the following scheme: magenta represents basic; blue represents acid; red represents nonpolar; green represents polar.
Figure 2.
Figure 2.
Functional properties of wild-type and mutant homomeric Kv7.2 channels. A, Macroscopic currents from Kv7.2, Kv7.2 R201C, Kv7.2 R201H, or Kv7.2 R144Q channels, in response to the indicated voltage protocol. The arrows on the voltage protocol indicate the time chosen for current analysis, as explained in the text. Current scale, 100 pA; time scale, 0.1 s. B, Conductance/voltage curves for the indicated channels. Continuous lines are Boltzmann fits to the experimental data. Each data point is the mean ± SEM of 7–20 cells recorded in at least three separate experimental sessions. C, Normalized and superimposed current traces from the indicated channels in response to the voltage protocol shown. Time scale, 0.1 s.
Figure 3.
Figure 3.
Functional properties of homomeric Kv7.3 and Kv7.3 R230C channels. A, Macroscopic currents from Kv7.3 and Kv7.3 R230C channels, in response to the indicated voltage protocol. Current scale, 50 pA; time scale, 0.1 s. B, Conductance/voltage curves. Continuous lines are Boltzmann fits to the experimental data. Each data point is the mean ± SEM of 13–18 cells recorded in at least three separate experimental sessions. C, Western blot analysis of proteins from total lysates (top) or streptavidin-purified biotinylated plasma membrane fractions (bottom) from nontransfected CHO cells (NT) or from CHO cells transfected with Kv7.3, Kv7.3 A315T, or Kv7.3 R230C plasmids. In each panel, the higher and lower blots were probed with anti-Kv7.3 or anti-α-tubulin antibodies, as indicated. NT (t.l.) and Kv7.3 (t.l.) indicate the lanes corresponding to total lysates from nontransfected or Kv7.3-expressing cells, loaded on the gel-containing biotinylated proteins to visualize the molecular mass of Kv7.3 and α-tubulin. Numbers on the left correspond to the molecular masses of the protein marker. Quantitative analysis of the data is given in the text.
Figure 4.
Figure 4.
Functional properties of heteromeric channels incorporating subunits carrying EE mutations. A, Macroscopic current traces from the indicated heteromeric channels in response to the indicated voltage protocol. Current scale, 200 pA; time scale, 0.1 s. Arrows indicate the threshold voltage (in mV) for current activation. Conductance/voltage curves for Kv7.2, Kv7.2+Kv7.3, Kv7.2+Kv7.2 R144Q+Kv7.3, Kv7.2+Kv7.2 R201C+Kv7.3, and Kv7.2+Kv7.2 R201H+Kv7.3 (B) or Kv7.3, Kv7.2+Kv7.3, and Kv7.2+Kv7.3 R230C+Kv7.3 (C). B, C, Continuous lines indicate Boltzmann fits of the experimental data. Current scale, 200 pA; time scale, 0.1 s. Each data point is the mean ± SEM of 6–12 cells recorded in at least three separate experimental sessions.
Figure 5.
Figure 5.
Structural modeling of Kv7.2 VSD in six gating states. The structural model of six gating states (activated, early deactivated, late deactivated, resting, early activated, and late activated) of Kv7.2 VSD is shown. Red represents negatively charged E130 (E1), E140 (E2), and D172 (D1) residues. Blue represents positively charged R201 (R2) residue. Yellow represents electrostatic interactions. For clarity, only the S2, S3, and S4 transmembrane segments, and the S3–S4 interconnecting loop, are shown.
Figure 6.
Figure 6.
Membrane expression of Kv7.2 D172R/R201D and D172C/R201C channels, and effects of reducing/oxidizing agents on Kv7.2 cysteine-substituted channels. A, Western blot analysis of proteins from total lysates (left) or streptavidin-purified biotinylated plasma membrane fractions (right) from untransfected CHO cells (NT) or from CHO cells expressing Kv7.2 (WT), Kv7.2 D172R/R201D (DR/RD), or D172C/R201C (DR/CC) subunits. In each panel, the higher and lower blots were probed with anti-Kv7.2 or anti-α-tubulin antibodies, as indicated. NT (t.l.) and WT (t.l.) indicate the lanes corresponding to total lysates from nontransfected (NT) or Kv7.2-expressing (WT) cells, loaded on the gel containing biotinylated proteins to visualize the molecular mass of Kv7.2 and α-tubulin. Numbers on the left correspond to the molecular masses of the protein marker. Quantitative analysis of the data is given in the text. B, Superimposed traces of current responses evoked by a 0 mV pulse from a CHO cell transfected with the plasmid encoding for Kv7.2 D172C/R201C subunits in control condition (CTL; black trace) or from another cell of the same experimental group after treatment with DTT (1 mm, red trace). Green trace represents the current response from the same DTT-treated Kv7.2 D172C/R201C-expressing cell shown in red during exposure to TEA (3 mm) and subsequent washout. Bar at bottom represents the duration of TEA exposure. Current scale, 20 pA; time scale, 0.5 s. C, Quantification of current densities and effect of DTT (1 mm), H2O2 (0.5 mm), and DTT + H2O2 from the indicated channels. *p < 0.05, significantly different from the respective control. N = 4–10 cells per group recorded in at least three separate experimental sessions.
Figure 7.
Figure 7.
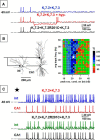
A computational model suggests the possible physiological mechanism for the increase in CA1 excitability following a GOF mutation of IKM. A, Increased Na+ channel availability may not account for the increase in excitability; traces are from simulations under control conditions, using wild-type IKM (Kv7.2+Kv7.3, blue), control conditions with a −4 nA hyperpolarizing current injection (red), and with mutant IKM channels (Kv7.2+Kv7.2 R201C+Kv7.3, black). Dashed line indicates the resting potential, set at −65 mV; the same synaptic stimulation pattern was used for all cases. B, Left, The microcircuit used to test the effects of a mutant IKM: an input activates excitatory synapses (closed circles) on the CA1 pyramidal neuron and, with a 3 ms delay, on the interneuron; somatic spikes of the interneuron activate an inhibitory synapse (open circle) on the soma of the CA1 cell. Right, Relative change in the number of CA1 action potentials elicited as a function of the average input frequency and the peak excitatory conductance on the interneuron. ★Case shown in detail in C. C, Somatic membrane potential for the two cells in the simulations indicated in B (☆). There is large hyperpolarization of the interneuron caused by the mutant IKM (green).

References

    1. Allen AS, Berkovic SF, Cossette P, Delanty N, Dlugos D, Eichler EE, Epstein MP, Glauser T, Goldstein DB, Han Y, Heinzen EL, Hitomi Y, Howell KB, Johnson MR, Kuzniecky R, Lowenstein DH, Lu YF, Madou MR, Marson AG, Mefford HC, et al. De novo mutations in epileptic encephalopathies. Nature. 2013;501:217–221. doi: 10.1038/nature12439. - DOI - PMC - PubMed
    1. Ascoli GA, Gasparini S, Medinilla V, Migliore M. Local control of postinhibitory rebound spiking in CA1 pyramidal neuron dendrites. J Neurosci. 2010;30:6434–6442. doi: 10.1523/JNEUROSCI.4066-09.2010. - DOI - PMC - PubMed
    1. Barcia G, Fleming MR, Deligniere A, Gazula VR, Brown MR, Langouet M, Chen H, Kronengold J, Abhyankar A, Cilio R, Nitschke P, Kaminska A, Boddaert N, Casanova JL, Desguerre I, Munnich A, Dulac O, Kaczmarek LK, Colleaux L, Nabbout R. De novo gain-of-function KCNT1 channel mutations cause malignant migrating partial seizures of infancy. Nat Genet. 2012;44:1255–1259. doi: 10.1038/ng.2441. - DOI - PMC - PubMed
    1. Battefeld A, Tran BT, Gavrilis J, Cooper EC, Kole MH. Heteromeric Kv7.2/7.3 channels differentially regulate action potential initiation and conduction in neocortical myelinated axons. J Neurosci. 2014;34:3719–3732. doi: 10.1523/JNEUROSCI.4206-13.2014. - DOI - PMC - PubMed
    1. Bertrand S, Lacaille JC. Unitary synaptic currents between lacunosum-moleculare interneurones and pyramidal cells in rat hippocampus. J Physiol. 2001;532:369–384. doi: 10.1111/j.1469-7793.2001.0369f.x. - DOI - PMC - PubMed

Publication types

Supplementary concepts