. 2015 Mar 4;35(9):4025-39.
doi: 10.1523/JNEUROSCI.2593-14.2015.

Extracellular pH regulates excitability of vomeronasal sensory neurons

Affiliations

Extracellular pH regulates excitability of vomeronasal sensory neurons

Annika Cichy et al. J Neurosci. .

Abstract

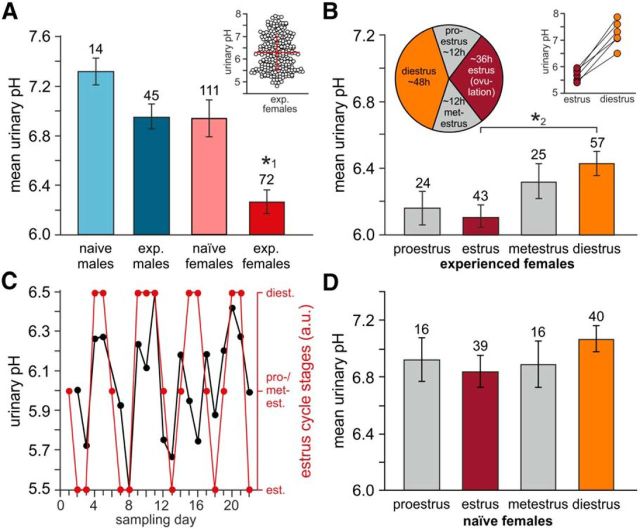
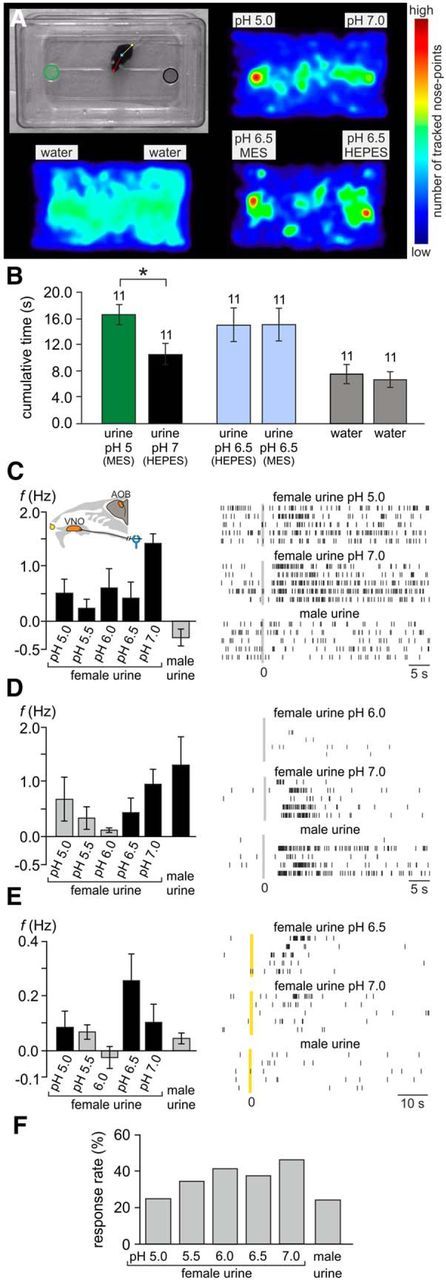
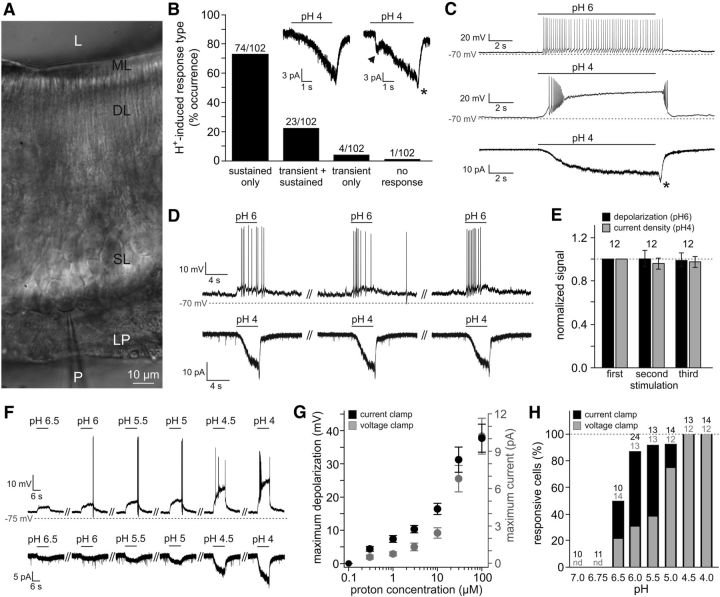
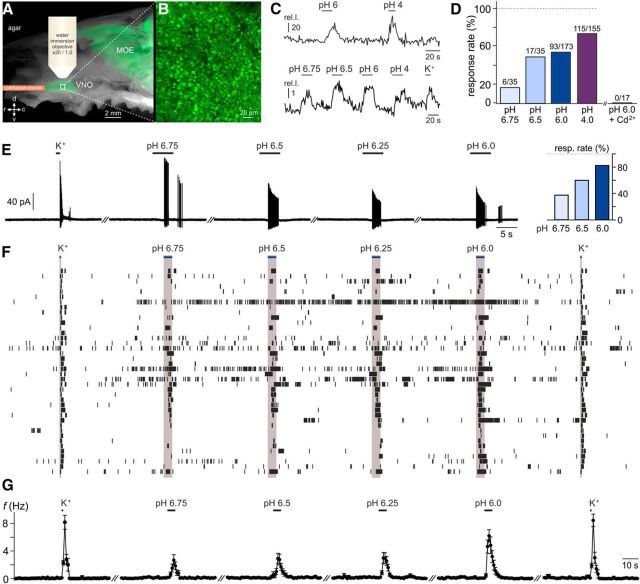
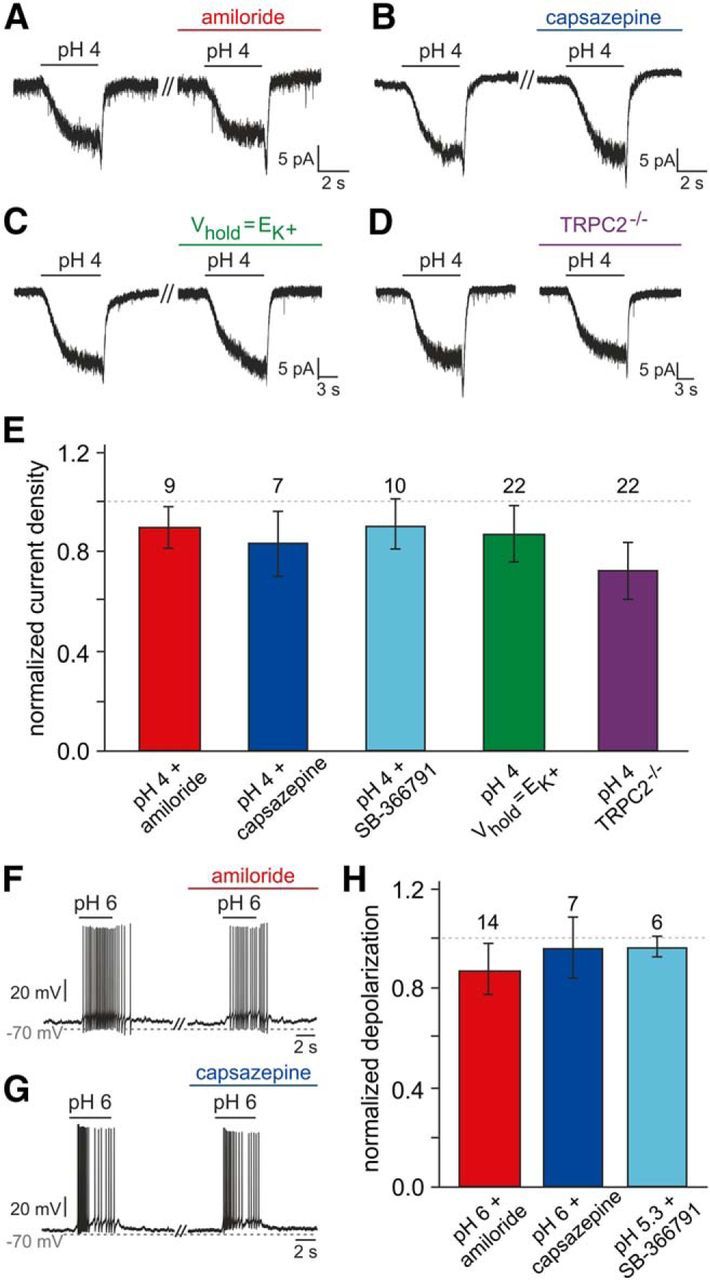
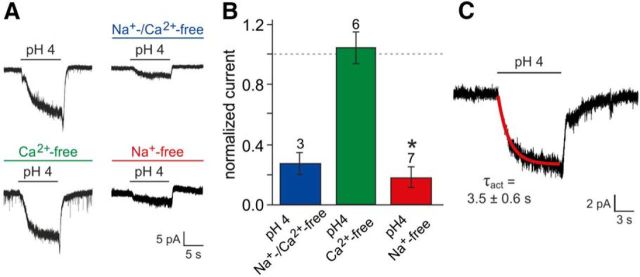
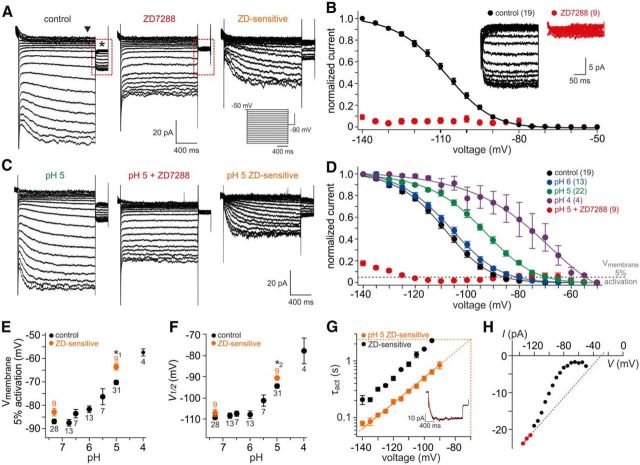
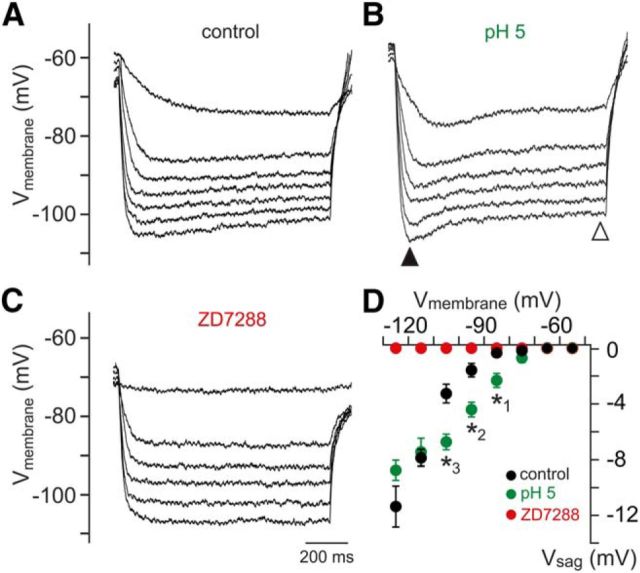
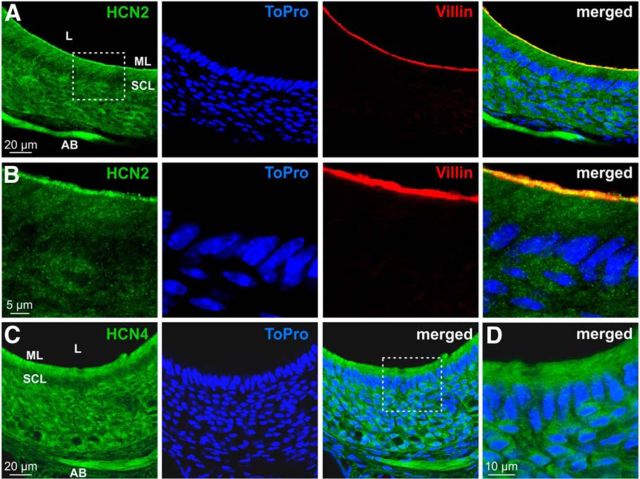
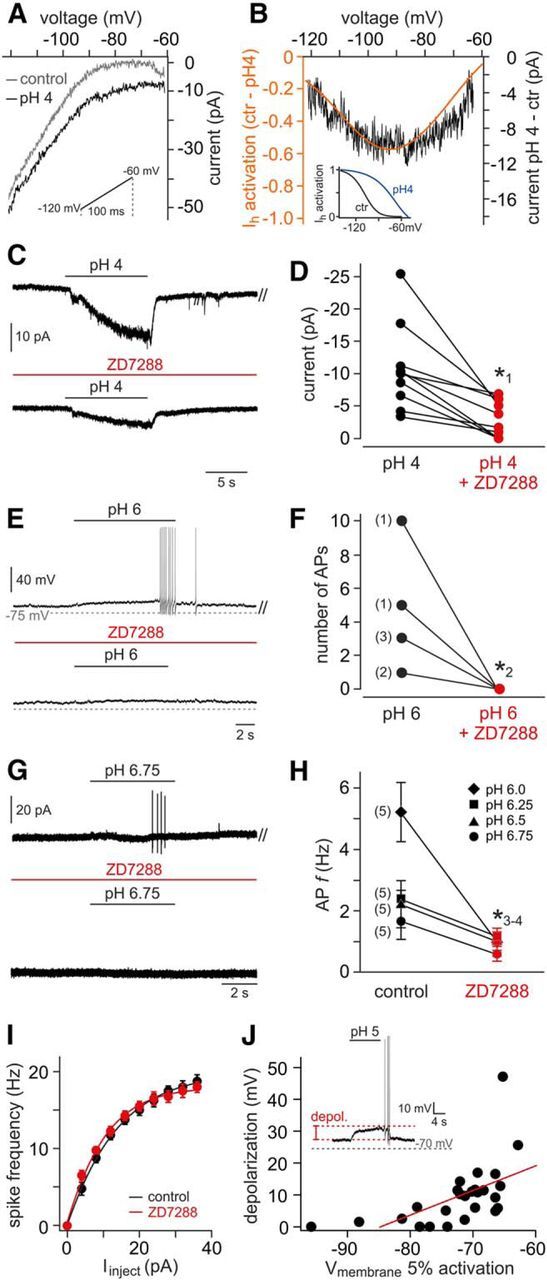
The mouse vomeronasal organ (VNO) plays a critical role in semiochemical detection and social communication. Vomeronasal stimuli are typically secreted in various body fluids. Following direct contact with urine deposits or other secretions, a peristaltic vascular pump mediates fluid entry into the recipient's VNO. Therefore, while vomeronasal sensory neurons (VSNs) sample various stimulatory semiochemicals dissolved in the intraluminal mucus, they might also be affected by the general physicochemical properties of the "solvent." Here, we report cycle stage-correlated variations in urinary pH among female mice. Estrus-specific pH decline is observed exclusively in urine samples from sexually experienced females. Moreover, patch-clamp recordings in acute VNO slices reveal that mouse VSNs reliably detect extracellular acidosis. Acid-evoked responses share the biophysical and pharmacological hallmarks of the hyperpolarization-activated current Ih. Mechanistically, VSN acid sensitivity depends on a pH-induced shift in the voltage-dependence of Ih activation that causes the opening of HCN channels at rest, thereby increasing VSN excitability. Together, our results identify extracellular acidification as a potent activator of vomeronasal Ih and suggest HCN channel-dependent vomeronasal gain control of social chemosignaling. Our data thus reveal a potential mechanistic basis for stimulus pH detection in rodent chemosensory communication.

Keywords: HCN; ion channel; signaling; vomeronasal organ.


Figures

Figure 1.
Figure 1.
Cycle-dependent changes in mouse urinary pH. A, Average pH measured in urine samples from sexually naive and sexually experienced males (7.32 ± 0.11 vs 6.96 ± 0.1) as well as sexually naive and sexually experienced females (6.94 ± 0.16 vs 6.27 ± 0.1, respectively). Data are plotted as mean ± SEM. Numbers of experiments are indicated above bars. Urinary pH was significantly reduced in samples from sexually experienced females (one-way ANOVA with Tukey's HSD post hoc test; *1p < 0.001). Inset, Scatter dot plot of individual pH measurements from experienced females (248 samples, 26 animals, 10 consecutive days). Red bars indicate mean ± SD (6.29 ± 0.75). B, Average urinary pH in experienced females during the four stages of the mouse estrous cycle. The pie chart indicates approximate stage duration. Numbers of individual measurements are indicated above bars. Results (6.16 ± 0.1, proestrus; 6.11 ± 0.07, estrus; 6.32 ± 0.11, metestrus; 6.43 ± 0.07, diestrus) represent means ± SEM. Samples taken from six animals over 30 consecutive days (*2p = 0.01, one-way ANOVA with Tukey's HSD post hoc test). Inset, Maximum cycle-dependent pH differences in individual mice during estrus and diestrus, respectively. In all animals, pH values differ by at least one logarithmic unit (ΔpH range, 1.0–1.7). C, Representative time course of “pH cyclicity.” Over 3 weeks, urinary pH is determined on a daily basis (black). Corresponding cycle stages are superimposed (red). D, Average urinary pH in sexually naive female mice (n = 4; 30 consecutive days) during proestrus (6.92 ± 0.15), estrus (6.84 ± 0.11), metestrus (6.87 ± 0.16), and diestrus (7.07 ± 0.09). Numbers of individual measurements are indicated above bars. Data represent means ± SEM. No significant differences were observed (one-way ANOVA).
Figure 2.
Figure 2.
Urinary pH constitutes a chemosensory signaling parameter. A, B, Two-choice assay reveals male place preference for acidic female urine. A, Experimental setup (top left) and accumulated heat maps depicting the count of tracked nose points (normalized to the overall maximum value). Top left, Single video frame illustrating assay design. Dishes used for stimulus presentation on either side of the cage are marked as areas of interest (green and black circles). Markers on the mouse denote multiple software-defined body points (nose, center, tail base) used for automated (and manually verified/corrected) tracking. Other images show pseudocolor heat maps of normalized nose-point distribution under three different experimental conditions: urine/pH 5 (MES-buffered) versus urine/pH 7 (HEPES-buffered) (top right), water versus water (bottom left), and urine/pH 6.5 (MES-buffered) versus urine/pH 6.5 (HEPES-buffered) (bottom right). B, Behavioral assay quantification. The bar graph shows the average cumulative duration (mean ± SEM) that an animal's nose point was detected within each area of interest. The asterisk denotes statistical significance; p < 0.001 (paired-sample t test). C–E, Stimulus-induced firing rate changes of three individual representative AOB units. Left, Bar charts depicting average changes in spike frequency (mean ± SEM; across all repeated presentations of the same stimulus) in response to female urine at five different pH values (5.0–7.0) and male urine, respectively. Black bars indicate firing rate changes that are statistically significant (see Materials and Methods). Gray bars correspond to rate variations that were not statistically significant from prestimulation baseline activity. The inset in C shows a schematic of the experimental in vivo preparation. Right, Raster displays of unit activity in response to three of the six stimuli. For each unit, discharge in response to male urine, neutral female urine (pH 7.0), and either of four acidic female urine stimuli is shown. Within each panel, each row indicates spike times during a single stimulus presentation. Per panel, all five rows display responses to the same stimulus. Time 0 indicates sympathetic nerve stimulation (C, D) or stimulus application to the nostril (E). F, Percentage of significant stimulation-induced responses (p < 0.05; Kruskal–Wallis one-way ANOVA) for female urine at different pHs and for male urine. Units included in this analysis were those responding to at least one of the female stimuli (n = 133).
Figure 3.
Figure 3.
Extracellular acidification stimulates VSNs. A, IR-DIC photomicrograph showing part of the sensory neuroepithelium of an acute coronal VNO section (250 μm). The patch pipette (P), lamina propria (LP), somata layer (SL), dendritic layer (DL), microvillar layer (ML), and lumen (L) are indicated. The patch pipette targets a VSN in the most basal layer of the sensory epithelium. B, Bar chart illustrating the response type distribution when VSNs are challenged with an increased extracellular proton concentration (pH 4). Most neurons display a gradually developing H+-induced current, either exclusively (sustained only; 72.5%) or preceded by a transient instantaneous current (transient + sustained; 22.5%). Inset, Representative recordings illustrating the two most common response types (Vhold = −70 mV). The arrow indicates transient current, and the asterisks (B, C) mark “off”/rebound currents. C, Representative original traces depicting nondesensitizing responses to prolonged extracellular acidification. Frequently, mild acidification (pH 6) triggers continuous action potential discharge (top; n = 9), whereas more pronounced changes (pH 4) induce transient high-frequency firing followed by a lasting plateau potential (middle; n = 25). Consequently, the underlying H+-dependent currents show no signs of desensitization (bottom; n = 58; Vhold = −70 mV). D, E, Highly reproducible responses to repeated stimulation. D, Repetitive exposure to acidic pH (ISI, 30 s) triggers robust signals recorded in current-clamp (pH 6; top) and voltage-clamp (pH 4; bottom) modes. E, Quantification of data shown in D. Bar chart depicting normalized response amplitudes (n = 12; current density and depolarization, respectively; mean ± SEM). F–H, Dose–response relationship for acidic stimuli ≥pH 4.0. F, Representative membrane potential changes (top) and whole-cell inward currents (bottom) recorded from the same VSN challenged with increasing proton concentrations (pH 6.5–pH 4.0). G, Quantification of data shown in F. Both maximum depolarization and current amplitude are plotted as functions of proton concentration. Data indicate mean ± SEM (n = 12). H, Dose-dependent increase in VSN response frequency. Bar chart shows the percentage of responding cells depending on stimulus strength (pH 6.5–pH 4.0) and recording mode (voltage/current clamp). The number of cells tested under each condition is indicated above individual bars. nd, Not determined.
Figure 4.
Figure 4.
Subtle changes in extracellular pH induce vomeronasal responses under physiological conditions. A–D, Luminal acidification is sufficient to stimulate VSNs. A, Merged macroscopic bright-field and fluorescence image of the hemisected rostral head of an OMP-GFP mouse illustrating the en face confocal Ca2+-imaging approach. The schematic depicts the position of the perfusion pencil and microscope objective. The white box delimits a region of the sensory epithelium shown at a higher magnification in B. MOE, Main olfactory epithelium. B, Three-dimensional reconstruction of a confocal z-stack scan of the VNO dendritic knob surface (epithelial area shown in A). Note that individual knobs are readily discernible. C, Top, Representative original recording of cytosolic Ca2+ signals in a VSN dendritic knob in response to acidic solutions (pH 6, pH 4). Bottom, Average trace from 17 individual knobs stimulated with decreasing pH values (6.75, 6.5, 6.0, and 4.0) and elevated extracellular potassium (K+; 100 mm). The integrated relative fluorescence intensities in user-defined regions of interest are displayed in arbitrary units and viewed as a function of time. D, Bar graph showing the percentage of proton-sensitive VSNs. Data are normalized to the proportion of neurons responding to K+-mediated membrane depolarization. While threshold Ca2+ signals are observed upon relatively mild acidification (pH 6.75), the percentage of pH-sensitive neurons increases dose dependently. Numbers of individual VSN knobs are indicated above bars (n = 35–173; 14 animals). Note that dendritic Ca2+ elevations in response to both the acidic solution (pH 6) and K+-dependent depolarization are abolished after Cd2+ incubation (200 μm; 4 min; n = 17; 5 animals). E–G, pH-dependent AP discharge recorded in a loose-seal cell-attached configuration, a recording mode that keeps the intracellular milieu intact and does not perturb VSN input resistance and resting potential. E, Original representative recordings from a single neuron challenged successively with elevated K+ (50 mm) and increasing extracellular proton concentrations (pH 6.75–pH 6.0). Horizontal black bars indicate stimulation (K+, 1 s; pH, 5 s). Inset (right), Bar chart depicting response rate versus proton concentration. Data are normalized to the K+-sensitive VSN population. F, Spike raster plot of 40 VSNs stimulated as in E. Stimulus exposure is indicated by the horizontal blue bars and gray columnar shading. G, Peristimulus time histogram (PSTH) illustrating K+-/pH-dependent changes in spike frequency over time. Individual data points in a given PSTH depict the average firing rates of all tested VSNs (means ± SEM; 1 s bin width; n = 40). Stimulus-evoked mean firing rates up to 6.2 ± 0.9 Hz were recorded (pH 6.0).
Figure 5.
Figure 5.
Addressing the mechanistic basis of vomeronasal proton sensitivity. A, B, Representative original recordings of acid-induced currents (pH 4; Vhold = −70 mV) under control conditions and during pharmacological treatment (preincubation, ≥120 s). No obvious changes are detected in presence of either amiloride (100 μm; A) or capsazepine (10 μm; B). C, Representative acid-evoked currents (pH 4; Vhold = −70 mV) under control conditions (EK+ = −86 mV) and at a set K+ equilibrium potential (EK+ = Vhold). Eliminating the driving force on K+ does not alter pH sensitivity. D, Original recordings of acid-induced responses in VSNs from both wild-type animals (left) and mice with homozygous deletions of the trpc2 gene (TRPC2−/−; right). E, Bar graph (mean ± SEM) quantitatively summarizing the experimental results exemplified in A–D [additionally including data obtained using the TRPV1 inhibitor SB-366791 (10 μm; 90 ± 10%)]. Neither experimental condition nor animal genotype causes significant differences in response current density (one-way ANOVA). Data are normalized to results obtained from the same neurons before pharmacological treatment (amiloride, 90 ± 8%; capsazepine, 83 ± 13%) or a different sample of neurons comparable in size (Vhold = EK+, n = 17, 87 ± 12%; TRPC2−/−, n = 23, 72 ± 11%). The number of cells tested under each condition is indicated above individual bars. The dashed line denotes 100%. F–H, Acidification-dependent membrane depolarization and AP discharge under control conditions and during pharmacological treatment. F, G, Representative original recordings of acid-induced depolarizations and superimposed spikes (pH 6; drug preincubation, ≥120 s) in the absence and presence of either amiloride (100 μm; F) or capsazepine (10 μm; G). H, Bar chart (mean ± SEM) describing the quantitative analysis of experiments exemplified in F and G (including additional data obtained using SB-366791, 10 μm).
Figure 6.
Figure 6.
Biophysical properties of proton-mediated signals. A, Representative original traces of acid-evoked whole-cell currents recorded under control conditions versus in a modified ionic environment. Extracellular Na+ and/or Ca2+ was replaced by the largely impermeable cation NMDG+ (preincubation, ≥120 s). B, Bar chart (mean ± SEM) quantitatively summarizing the results exemplified in A. Data are normalized to current densities recorded from the same neurons before cation exchange. The dashed line denotes 100%. Numbers of experiments are indicated above individual bars. The asterisk denotes statistical significance; p = 0.003 (paired-sample t test). While selective replacement of Ca2+ did not change pH-dependent currents (109 ± 9%), substitution of Na+, either alone (19 ± 6%) or together with Ca2+ (28 ± 7%), strongly reduced acid-evoked signals. C, Original recording illustrating the time course of acid-evoked currents. Activation kinetics are well fit by a single exponential function (red curve).
Figure 7.
Figure 7.
Vomeronasal HCN channels are modulated by extracellular protons. A, Ih recorded from a representative VSN (whole-cell voltage clamp). The cell was held at −50 mV and hyperpolarized for 1.5 s in steps of 5 mV from −50 to −140 mV before stepping back to −90 mV for 300 ms. Traces represent recordings under control conditions (pH 7.3; left) and in the presence of the specific HCN channel antagonist ZD7288 (100 μm; middle). When data recorded during drug treatment are digitally subtracted from control recordings, the ZD7288-sensitive current becomes apparent (right). Inset, Pulse protocol for HCN channel activation. B, Normalized Ih activation curve. Steady-state current amplitudes are measured upon stepping back to −90 mV (asterisk in A) and plotted as a function of prepulse hyperpolarization. The solid black line represents a sigmoidal fit to the data points (mean ± SEM; V0.5 = −108.8 ± 0.3 mV; slope constant, 11.3 ± 0.3). The numbers of neurons analyzed under control conditions (black) as well as during treatment (red) are shown in parentheses. Inset, Expanded view of steady-state currents shown in A (dashed red rectangles) under control conditions and in the presence of ZD7288, respectively. C, D, Ih activation at different extracellular pH values. C, Hyperpolarization-evoked currents under acidic conditions (pH 5; left), in the presence of ZD7288 (100 μm; middle) and after off-line subtraction (right). D, Normalized Ih activation curves at different extracellular proton concentrations. Solid lines represent sigmoidal fits to the data points (mean ± SEM). Note that acidification shifts activation curves toward more positive potentials. The numbers of neurons analyzed are shown in parentheses. The dashed horizontal gray line marks an arbitrary threshold of 5% current activation. E, F, Effect of extracellular acidification on Ih activation threshold (5%; E) and half-maximal activation (V0.5; F). Data are derived from individual activation curve fits and presented as means ± SEM. The numbers of neurons analyzed are shown adjacent to each data point. Orange dots indicate results from ZD7288-sensitive currents obtained by off-line subtraction. Note that pharmacological isolation of Ih suggests an even stronger impact of extracellular pH. G, Semilogarithmic plot of Ih activation time constants versus hyperpolarizing membrane potential. Average τact values (±SEM) are derived from monoexponential fits (inset) to ZD7288-sensitive current traces under control conditions (pH 7.3; black; n = 3) and during acidification (pH 5; orange; n = 8). An estimate for τact under acidic conditions (pH 5) at rest (−70 mV) can be obtained by linear extrapolation (dashed orange lines). H, Representative Ih current–voltage relationship. ZD7288-sensitive plateau currents (arrowhead in A) are plotted against a hyperpolarizing step pulse. Erev is calculated by linear regression of data points corresponding to full activation (red dots; derived from individual activation curves).
Figure 8.
Figure 8.
Hyperpolarization-evoked sag potentials vary with [H+]e. AC, Example membrane-voltage traces highlighting the effects of acidosis (pH 5) and ZD7288 on hyperpolarization-evoked sag potentials (Vsag). Responses to hyperpolarizing current injections (0 to −24 pA, −4 pA increments) show the voltage-dependence of Vsag amplitude. For quantification, Vsag is determined as the voltage difference between the peak hyperpolarization and the steady-state membrane potential (filled and open triangles, respectively; B). D, Vsag amplitude versus peak hyperpolarization (10 mV bins). Data represent the means ± SEM (control/pH 7.3, n = 11; pH 5, n = 11; pH 7.3 + ZD7288, n = 7). Note that, under acidic conditions, Vsag is significantly larger at hyperpolarizations ranging from −80 to −110 mV (unpaired t test; *1p = 0.0014; *2p = 0.0003; *3p = 0.0003). Moreover, no sag is observed in presence of ZD7288.
Figure 9.
Figure 9.
Expression of HCN2 and HCN4 in the VNO sensory epithelium. A–D, Confocal laser-scanning microscopic images of the vomeronasal neuroepithelium. A, B, Double immunofluorescence labeling for HCN2 (green) and villin (red) and nuclear staining with ToPro (blue). B, High-magnification single optical section images from the boxed area in A. Note the colabeling of HCN2 and villin in the merged image (right). C, Confocal images showing the VNO sensory epithelium stained with an antibody against HCN4 (green). Nuclear staining with ToPro (blue) is also shown. D, High-magnification merged optical sections from the boxed area in C. AB, Axon bundles; SCL, sustentacular cell layer; ML, microvillar layer; L, lumen.
Figure 10.
Figure 10.
Acid-evoked VSN responses are mediated by HCN channels. A, Original voltage ramp recordings from a representative VSN. Traces represent currents across a hyperpolarized voltage range (inset; −120 to −60 mV; ramp duration, 100 ms) recorded under control (pH 7.3, gray) and acidic conditions (pH 4, black). B, Acid-sensitive current (black) revealed by off-line subtraction of traces shown in A. Superimposed is a model I–V curve (orange) derived from subtraction of Ih activation curve fits (inset; pH 7.3 to pH 4.0). Ctr, Control. C, Representative recordings of pH 4-induced VSN responses. ZD7288 treatment (100 μm; preincubation, ≥400 s) strongly reduced current amplitude. D, Quantification of data shown in C. Data points correspond to peak current measurements in the absence (black) and presence (red) of ZD7288, respectively. Data from individual VSNs are connected by black lines. When normalized to control responses, average current densities are significantly reduced (39 ± 10%; n = 10). The asterisk (*1) denotes statistical significance; p = 0.018 (paired-sample t test). EH, Acid-evoked firing is diminished by HCN channel inhibition. E, Membrane voltage deflections and action potential discharge elicited by acidic solution (pH 6) in the absence and presence of ZD7288 (100 μm; preincubation, ≥400 s). F, Quantification of data shown in E. The action potential counts before and after HCN channel block are compared. The numbers of neurons corresponding to each data point are shown in parentheses. The asterisk (*2) denotes statistical significance; p = 0.019 (paired-sample t test). G, Representative original recordings (loose-seal cell-attached configuration) of action potential firing, or the lack thereof, from a single neuron in response to mild acidification (pH 6.75) in the absence (top) and presence (bottom) of ZD7288 (100 μm; preincubation, ≥400 s). H, Spike frequency quantification of discharge data obtained from VSNs exposed to variable levels of acidification (pH 6.75 to pH 6.0; mean ± SEM). VSN numbers corresponding to each pair of data points are shown in parentheses. The asterisks (*3-4) denote statistical significance (paired-sample t test); *3p = 0.02 (pH 6.0); *4p = 0.03 (pH 6.25). I, Plot of mean firing rate versus stationary current input (f–I curve) in the absence (black) and presence (red) of ZD7288 (n = 4). Data represent mean ± SEM. J, Scatter plot depicting the relationship between Ih activation thresholds (i.e., 5% current activation) and amplitudes of evoked depolarizations (inset) under acidic conditions (pH 5). Linear regression indicates correlation of the parameters (Pearson's correlation coefficient, r = 0.576; n = 28 cells).

References

    1. Achiraman S, Archunan G, Ponmanickam P, Rameshkumar K, Kannan S, John G. 1-Iodo-2 methylundecane [1I2MU]: an estrogen-dependent urinary sex pheromone of female mice. Theriogenology. 2010;74:345–353. doi: 10.1016/j.theriogenology.2010.01.027. - DOI - PubMed
    1. Andreolini F, Jemiolo B, Novotny M. Dynamics of excretion of urinary chemosignals in the house mouse (Mus musculus) during the natural estrous cycle. Experientia. 1987;43:998–1002. doi: 10.1007/BF01952217. - DOI - PubMed
    1. Angelo K, London M, Christensen SR, Häusser M. Local and global effects of I(h) distribution in dendrites of mammalian neurons. J Neurosci. 2007;27:8643–8653. doi: 10.1523/JNEUROSCI.5284-06.2007. - DOI - PMC - PubMed
    1. Aron C. Mechanisms of control of the reproductive function by olfactory stimuli in female mammals. Physiol Rev. 1979;59:229–284. - PubMed
    1. Barry PH. JPCalc, a software package for calculating liquid junction potential corrections in patch-clamp, intracellular, epithelial and bilayer measurements and for correcting junction potential measurements. J Neurosci Methods. 1994;51:107–116. doi: 10.1016/0165-0270(94)90031-0. - DOI - PubMed

Publication types

LinkOut - more resources