. 2015 Mar 4;35(9):4081-91.
doi: 10.1523/JNEUROSCI.3350-14.2015.

A direct descending pathway informing locomotor networks about tactile sensor movement

Affiliations

A direct descending pathway informing locomotor networks about tactile sensor movement

Jan M Ache et al. J Neurosci. .

Abstract

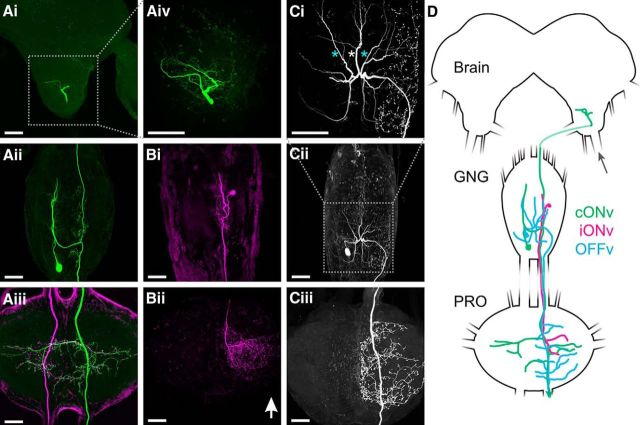
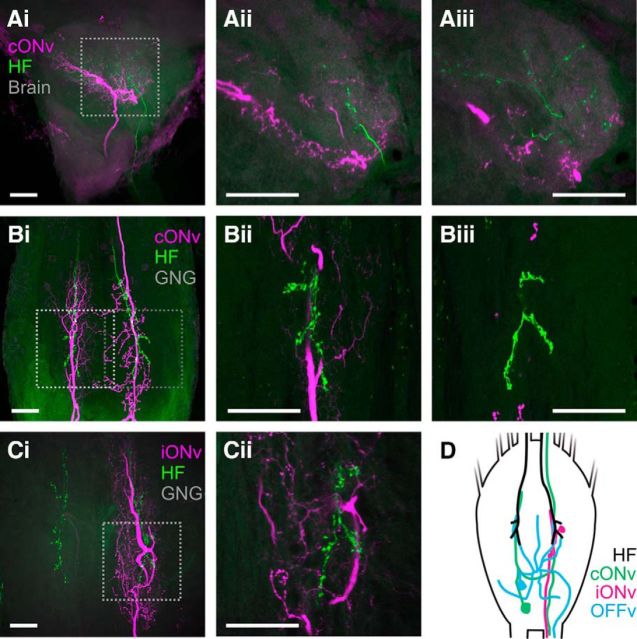
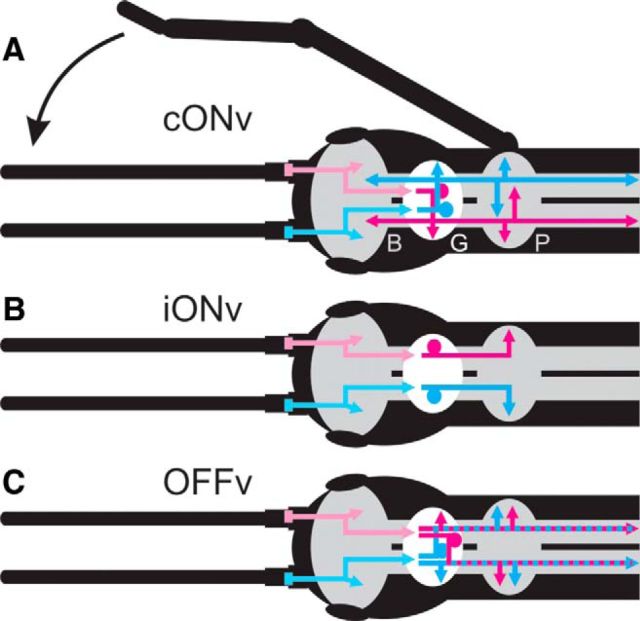
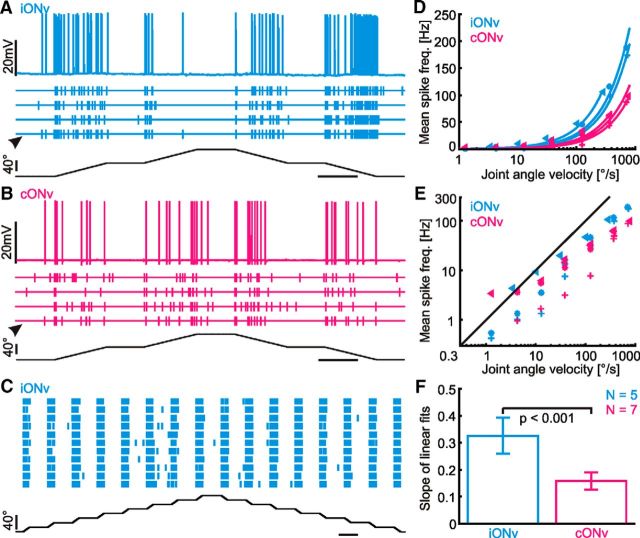
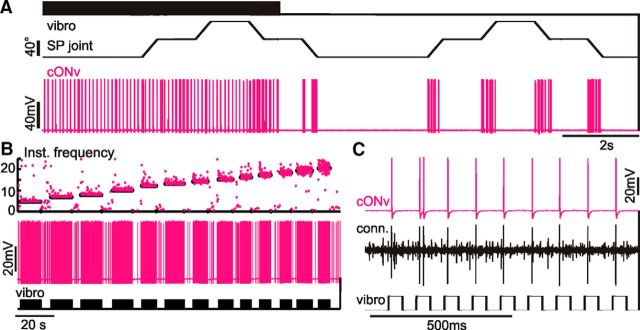
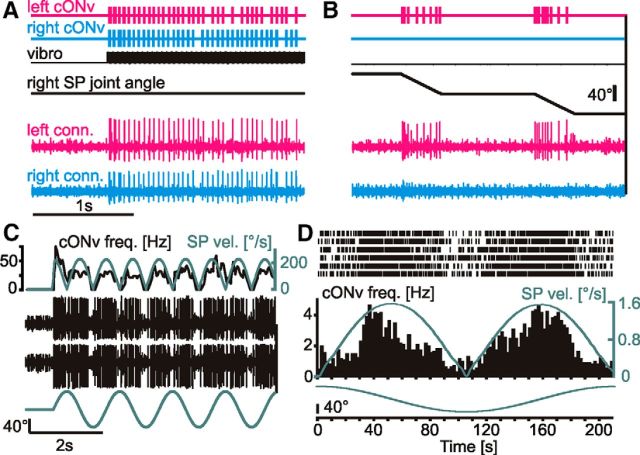
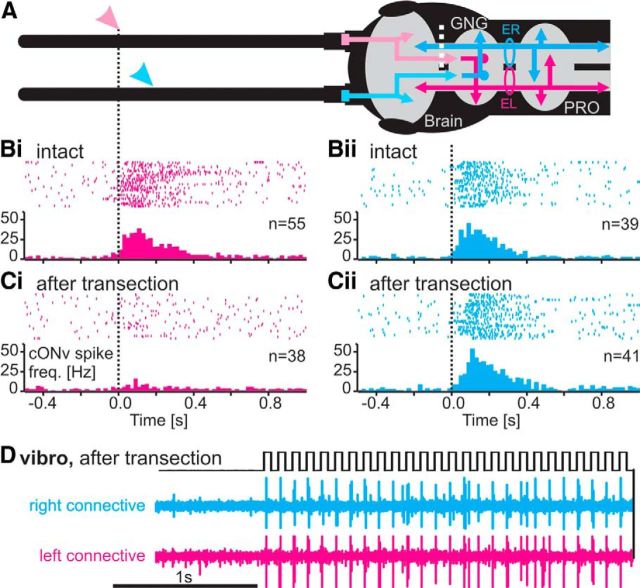
Much like visually impaired humans use a white-cane, nocturnal insects and mammals use antennae or whiskers for near-range orientation. Stick insects, for example, rely heavily on antennal tactile cues to find footholds and detect obstacles. Antennal contacts can even induce aimed reaching movements. Because tactile sensors are essentially one-dimensional, they must be moved to probe the surrounding space. Sensor movement is thus an essential cue for tactile sensing, which needs to be integrated by thoracic networks for generating appropriate adaptive leg movements. Based on single and double recordings, we describe a descending neural pathway comprising three identified ON- and OFF-type neurons that convey complementary, unambiguous, and short-latency information about antennal movement to thoracic networks in the stick insect. The neurons are sensitive to the velocity of antennal movements across the entire range covered by natural movements, regardless of movement direction and joint angle. Intriguingly, none of them originates from the brain. Instead, they descend from the gnathal ganglion and receive input from antennal mechanoreceptors in this lower region of the CNS. From there, they convey information about antennal movement to the thorax. One of the descending neurons, which is additionally sensitive to substrate vibration, feeds this information back to the brain via an ascending branch. We conclude that descending interneurons with complementary tuning characteristics, gains, input and output regions convey detailed information about antennal movement to thoracic networks. This pathway bypasses higher processing centers in the brain and thus constitutes a shortcut between tactile sensors on the head and the thorax.

Keywords: adaptive locomotion; descending control; identified neurons; invertebrates; tactile sensing.


Figures

Figure 1.
Figure 1.
Morphology of identified velocity-sensitive DINs. A, cONv (green) in the ipsilateral deutocerebrum of the brain (Ai), the GNG (Aii), and the prothoracic ganglion (Aiii). The contralateral cONv was stained in the same animal (magenta). The cONvs of both sides appear perfectly symmetrical. The green (magenta) cONv responded to movement of the left (right) antenna. Aiv, cONv branches in the ipsilateral deutocerebrum of the brain (indicated in Ai). The posterior part of the axon is not included in the stack. Bi, iONv branching pattern in the GNG. The right iONv responded to movement of the right antenna only. Bii, iONv branching pattern in the prothoracic ganglion. Ci, Cii, OFFv branching pattern in the GNG (location of Ci indicated in Cii). OFFv has three smooth main dendrites that run anteriorly in the GNG (asterisks) and bleb-like, putative presynaptic sites in the ipsilateral half of the GNG. OFFv responded to stimulation of both antennae. Ciii, OFFv branching pattern in the prothoracic ganglion. Scale bars, 100 μm. Arrow points anteriorly along the neuraxis. D, Schematic of the brain, GNG, and the prothoracic ganglion with drawings of cONv (green), iONv (magenta), and OFFv (cyan). Arrow indicates the antennal nerve. Connectives and axons are shortened.
Figure 2.
Figure 2.
DIN neurites overlap with projections from antennal hair field afferents in the GNG. All double labelings of antennal hair field afferents (HF, green) and DINs (magenta) were obtained in the same individuals. Scale bars, 50 μm. Ai, Projections of antennal hair field afferents and cONv in the deutocerebrum of the brain. For localization and orientation, see Figure 1D. Aii, Aiii, 10 μm thin stacks of the region indicated by the box in Ai, imaged at two different depths. Bi, Projections of antennal hair field afferents and the main cONv branches in the GNG. Bii, Biii, 10 μm thin stacks of the regions indicated in Bi, imaged at the same depth. Bii, Left hair field afferents and smooth cONv branch, left box in Bi. Biii, Right hair field afferents and cONv branch with bleb-like protrusions, right box in Bi. Ci, Projections of antennal hair field afferents and the main iONv branches in the GNG. Cii, 10 μm thin stack showing the region indicated by the box in Ci. D, Schematic of the projection sites of antennal hair field afferents and the main arborizations of cONv, iONv, and OFFv in the GNG.
Figure 3.
Figure 3.
Parallel DINs with complementary properties convey the velocity of antennal movement to the prothoracic ganglion. Schematics of the identified velocity-sensitive DINs in the stick insect CNS, with afferent pathways from both antennae to the GNG (G). Magenta represents information from the right antenna. Cyan represents information from the left antenna. A, cONv receives contralateral input in the GNG and mediates it to both sides of the prothoracic ganglion (P), which controls front leg movement. cONv also innervates the brain (B) and ganglia downstream from the prothoracic. Black arrow indicates the behavioral results: stick insects use antennal cues to guide reaching movements. B, iONv receives ipsilateral input in the GNG and mediates it to the ipsilateral half of the prothoracic ganglion. C, OFFv receives bilateral input in the GNG and mediates it to the ipsilateral half of the prothoracic ganglion. All DINs have their soma (filled circles) and antennal mechanosensory input regions in the GNG. Arrows indicate output branches in the respective hemiganglia.
Figure 4.
Figure 4.
iONv and cONv are highly sensitive to antennal movement and encode the antennal joint angle velocity over a wide velocity range. A, Response of iONv (5 top traces, cyan) to SP joint stimulation (bottom trace, black). Arrowhead indicates the sweep shown as the membrane potential (top). B, cONv response to the same stimulus as for iONv in A. Details as in A. C, Vertical lines (cyan) indicate iONv spikes during 11 consecutive sweeps of SP joint stimulation with 16 low-amplitude ramps (bottom). D, Mean spike frequencies of iONv und cONv during stimulation at different velocities in three different animals each (different symbols), shown on a log/lin scale. Frequencies were averaged across all four ramps of each staircase stimulus. The lines show linear fits (R ≥ 0.98 for all fits). iONv had a higher mean spike rate than cONv for a given velocity. E, Velocity response characteristics of iONv (cyan) and cONv shown on a log/log scale. Different symbols represent data from three different animals. Black line indicates spike frequency (in Hz) = joint angle velocity (in °/s), for reference. The spike frequency was proportional to the velocity even at slow joint angle velocities between 1°/s and 40°/s. F, Slopes of iONv and cONv velocity sensitivity (D, mean ± SD). A–C, Horizontal scale bars indicate 1 s; ramp velocities were 40°/s.
Figure 5.
Figure 5.
cONv is sensitive to substrate vibration and is the largest unit in extracellular neck-connective recordings. A, The sequence shows the cONv response to substrate taps (vibro) alone (left), taps with simultaneous SP joint stimulation (first staircase), and SP joint stimulation only (second staircase). B, Intracellular cONv recording during different substrate tapping frequencies. The instantaneous spike frequency plot (top) shows that cONv (magenta) closely followed the substrate tapping frequency (black). C, Intracellular cONv recording and whole-nerve neck-connective recording (conn.) during substrate tapping. Vibrator contact was induced on the rising edge of the stimulus monitor (bottom). cONv was the largest unit in whole-nerve recordings.
Figure 6.
Figure 6.
cONv exclusively receives contralateral antennal input and is sensitive to sinusoidal movement of the SP joint, even at very slow velocities. A, B, Bottom, Simultaneous recordings of the left (magenta) and right (cyan) neck-connectives. cONv was the largest unit in both recordings. Top two traces represent the timing of cONv spikes, extracted by thresholding the extracellular recordings of the neck connectives. Middle two traces represent the tapping stimulus (vibro) and the right SP joint angle. The left and right cONv responded to the tapping stimulus (A), but only the left cONv responded to stimulation of the right SP joint (B). C, cONv response to sinusoidal movement of the SP joint at 0.69 Hz (bottom), with simultaneous neck-connective recordings at two different positions on the same side (middle black traces). cONv was the largest unit in both recordings. The spike frequency of cONv (top black line) followed the time course of the SP joint angle velocity (top gray line). D, Same type of experiment as in C, but with very low stimulus velocity. cONv spiked reliably (raster plot with PSTH below) during 6 consecutive cycles of sinusoidal SP joint movement at 0.0047 Hz. Bottom gray trace represents SP joint angle. Middle gray trace represents stimulus velocity. The spike frequency of cONv follows the time course of SP joint angle velocity at velocities exceeding 0.4°/s. C, D, Velocity traces were averaged, using a 50 ms time window. C, The mean spike frequency was averaged, using a 100 ms time window.
Figure 7.
Figure 7.
The cONv collateral in the contralateral brain hemisphere is an output branch. cONv receives input exclusively in the GNG. A, Schematic of the antennae, brain, GNG, and prothoracic ganglion (PRO), with the right (cyan) and left (magenta) cONv as well as the left (cyan) and right (magenta) afferent antennal pathways. Circles represent the sites of neck-connective recordings. ER, Electrode recording right connective; EL, electrode recording left connective. White dotted line indicates the site of transection of the right circumoesophageal connective. All data are from one continuous experiment. B, Side specificity of cONv responses to antennal stimulation and site of antennal input. Bi, Spike trains and PSTH of the left cONv during SP joint movement of the right antenna (magenta arrowhead in A, vertical dotted line). Both antennae were manually moved about the SP joint, using a fine paintbrush. Bii, Response of the right cONv to SP joint movement of the left antenna (A, cyan arrowhead). In both cases, antennal movement elicited a strong response in the contralateral cONv in the intact animal. Ci, Cii, Response of both cONvs to contralateral antennal movement after transection of the right circumoesophageal connective (A, white dotted line). The antennal response of the left, intact cONv was diminished (Ci), whereas the response of the right cONv, where the GNG-brain connection was transected, remained unaffected (Cii). D, Vibration stimulus (black), and right (cyan) and left (magenta) neck-connective recordings of cONv responses after transection of the right circumoesophageal connective (A, white dotted line). The vibration response of both cONvs remained unaffected.
Figure 8.
Figure 8.
cONv and OFFv deliver synchronous output to prothoracic networks. All data are from one continuous experiment. A, Intracellular cONv and neck-connective recordings during SP joint movement (bottom). B, Spike-triggered average of the intracellular cONv recording using either the intracellular (magenta) or the extracellular cONv spike (black) as the trigger. Right, Both averages were overlaid, revealing identical time courses. cONv spikes can be extracted from the neck-connective recording with >99% reliability. C, Intracellular OFFv recording (top), with the simultaneous neck-connective recording (middle, magenta) showing cONv spikes in response to antennal deflection (bottom). D, Mean spike rate of OFFv during ramps with different velocities. E, Mean spike rates of OFFv (black) and cONv (magenta) with the respective spike trains (vertical lines in the middle traces) and the stimulus (bottom). Spike rates were averaged within a 33 ms sliding window. F, Cross-correlation of cONv and OFFv spike rates, as shown in E, within a 145-s-long time window. Spike rates were normalized by subtracting the median rate.

References

    1. Ache JM, Dürr V. Encoding of near-range spatial information by descending interneurons in the stick insect antennal mechanosensory pathway. J Neurophysiol. 2013;110:2099–2112. doi: 10.1152/jn.00281.2013. - DOI - PubMed
    1. Alstermark B, Lindström S, Lundberg A, Sybirska E. Integration in descending motor pathways controlling the forelimb in the cat: 8. Ascending projection to the lateral reticular nucleus from C3–C4 propriospinal also projecting to forelimb motoneurones. Exp Brain Res. 1981;42:282–298. - PubMed
    1. Azim E, Jiang J, Alstermark B, Jessell TM. Skilled reaching relies on a V2a propriospinal internal copy circuit. Nature. 2014;508:357–363. doi: 10.1038/nature13021. - DOI - PMC - PubMed
    1. Bacon JP, Strausfeld NJ. The dipteran giant fibre pathway: neurons and signals. J Comp Physiol A Neuroethol Sens Neural Behav Physiol. 1986;158:529–548. doi: 10.1007/BF00603798. - DOI
    1. Bender JA, Pollack AJ, Ritzmann RE. Neural activity in the central complex of the insect brain is linked to locomotor changes. Curr Biol. 2010;20:921–926. doi: 10.1016/j.cub.2010.03.054. - DOI - PubMed

Publication types

LinkOut - more resources