. 2015 Apr 1;194(7):3065-78.
doi: 10.4049/jimmunol.1401896. Epub 2015 Mar 4.

B cell Rab7 mediates induction of activation-induced cytidine deaminase expression and class-switching in T-dependent and T-independent antibody responses

Affiliations

B cell Rab7 mediates induction of activation-induced cytidine deaminase expression and class-switching in T-dependent and T-independent antibody responses

Egest J Pone et al. J Immunol. .

Abstract

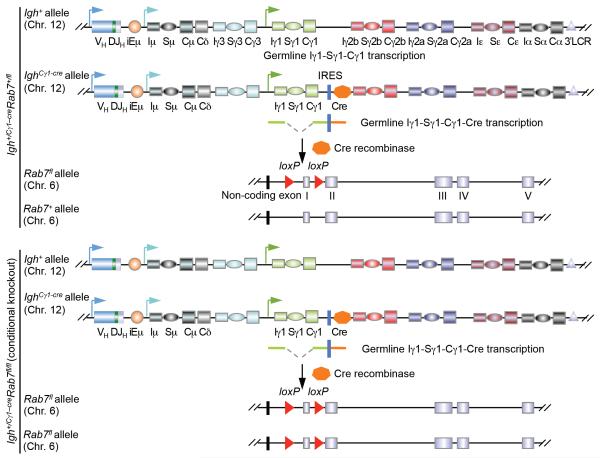
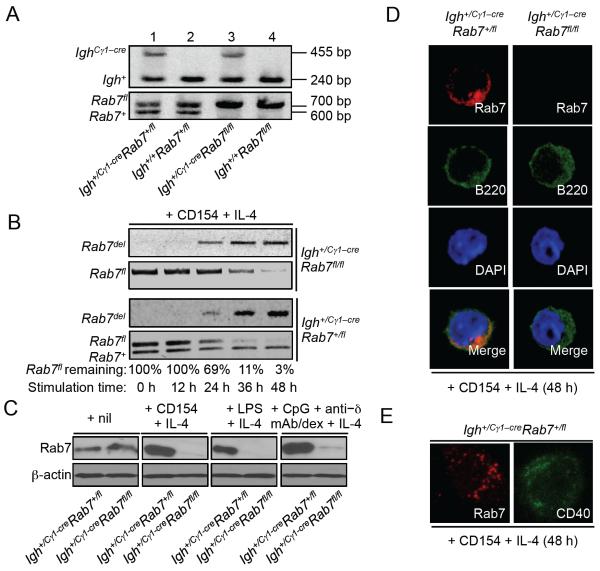
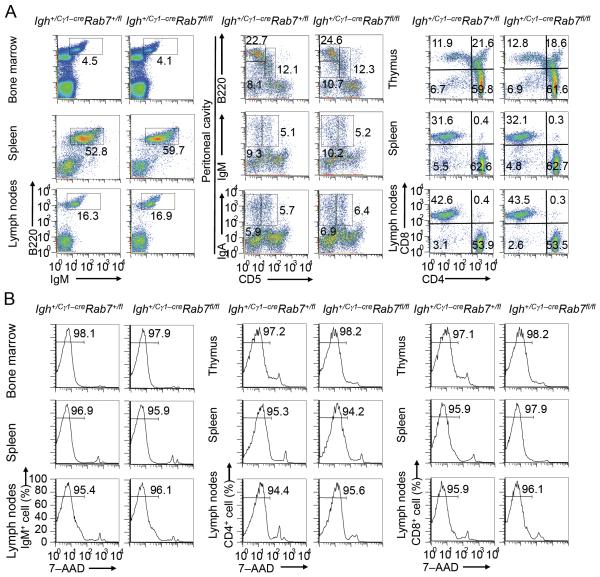
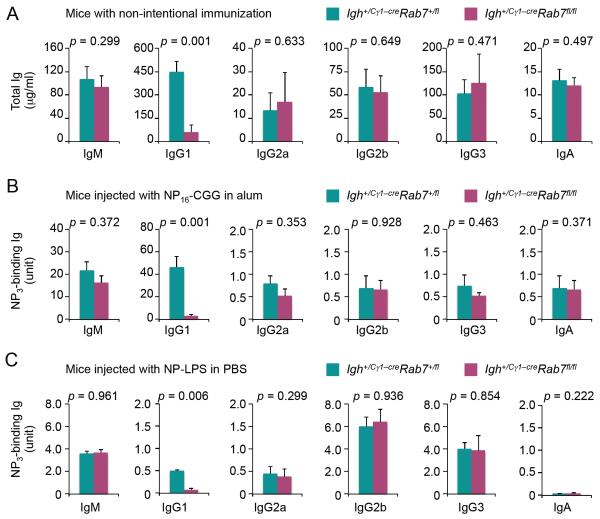
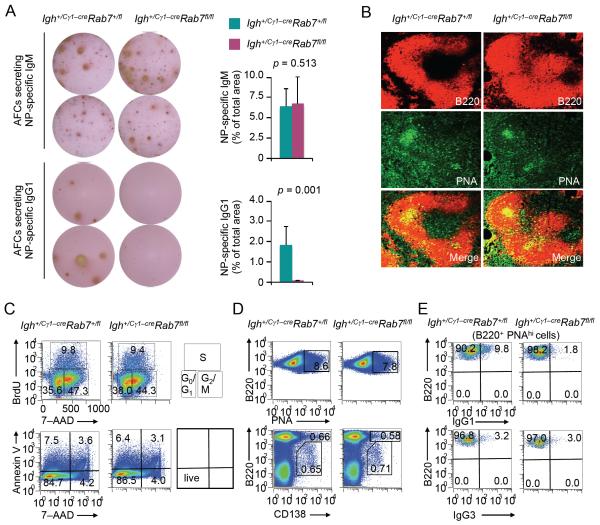
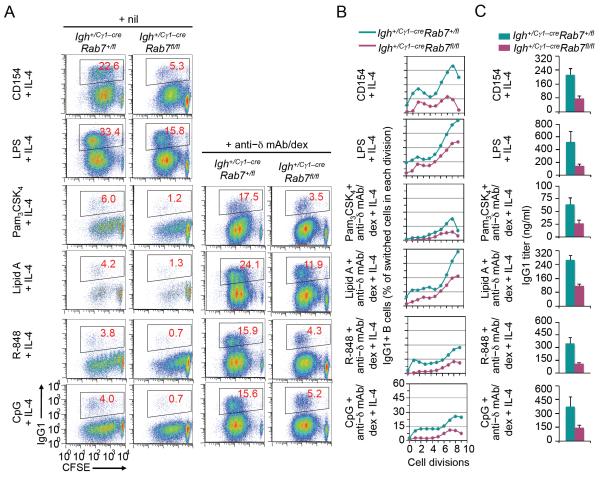
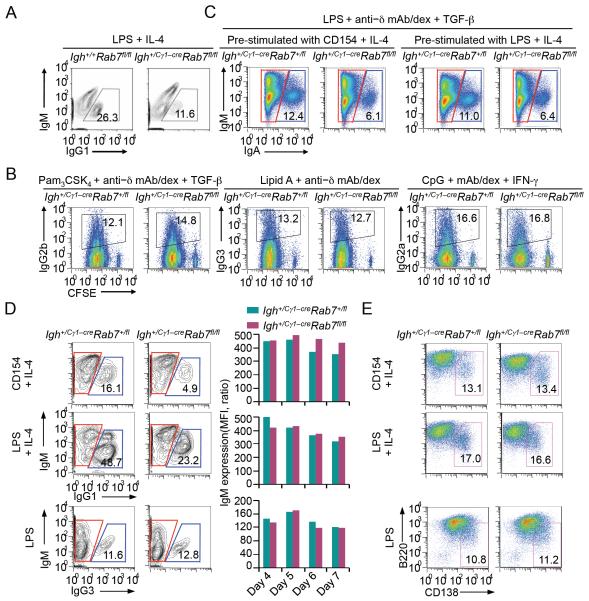
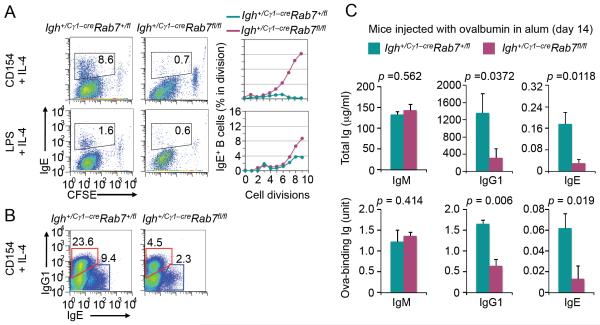
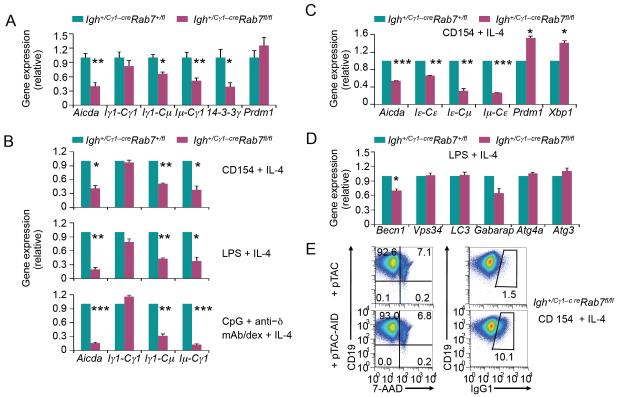
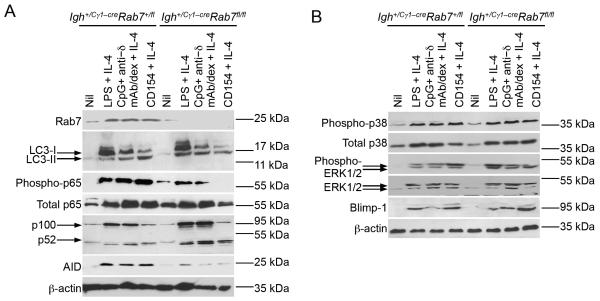
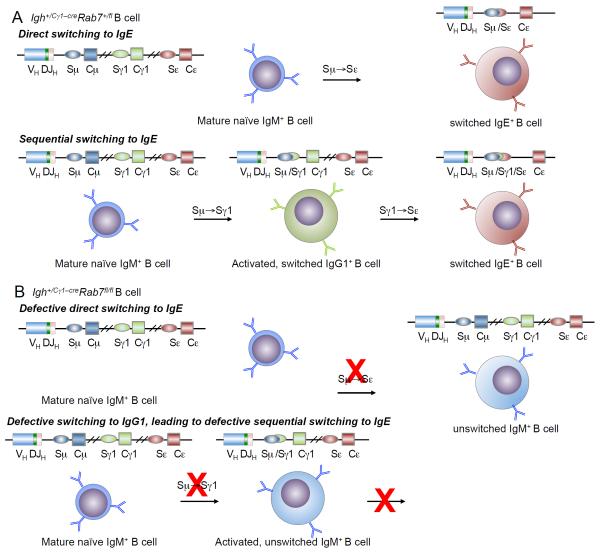
Class switch DNA recombination (CSR) is central to the maturation of the Ab response because it diversifies Ab effector functions. Like somatic hypermutation, CSR requires activation-induced cytidine deaminase (AID), whose expression is restricted to B cells, as induced by CD40 engagement or dual TLR-BCR engagement (primary CSR-inducing stimuli). By constructing conditional knockout Igh(+/C)γ(1-cre)Rab7(fl/fl) mice, we identified a B cell-intrinsic role for Rab7, a small GTPase involved in intracellular membrane functions, in mediating AID induction and CSR. Igh(+/C)γ(1-cre)Rab7(fl/fl) mice displayed normal B and T cell development and were deficient in Rab7 only in B cells undergoing Igh(C)γ(1-cre) Iγ1-Sγ1-Cγ1-cre transcription, as induced--like Igh germline Iγ1-Sγ1-Cγ1 and Iε-Sε-Cε transcription--by IL-4 in conjunction with a primary CSR-inducing stimulus. These mice could not mount T-independent or T-dependent class-switched IgG1 or IgE responses while maintaining normal IgM levels. Igh(+/C)γ(1-cre)Rab7(fl/fl) B cells showed, in vivo and in vitro, normal proliferation and survival, normal Blimp-1 expression and plasma cell differentiation, as well as intact activation of the noncanonical NF-κB, p38 kinase, and ERK1/2 kinase pathways. They, however, were defective in AID expression and CSR in vivo and in vitro, as induced by CD40 engagement or dual TLR1/2-, TLR4-, TLR7-, or TLR9-BCR engagement. In Igh(+/C)γ(1-cre)Rab7(fl/fl) B cells, CSR was rescued by enforced AID expression. These findings, together with our demonstration that Rab7-mediated canonical NF-κB activation, as critical to AID induction, outline a novel role of Rab7 in signaling pathways that lead to AID expression and CSR, likely by promoting assembly of signaling complexes along intracellular membranes.


Figures

FIGURE 1
FIGURE 1. Generation of Igh+/Cγ1-creRab7fl/fl mice
Schematics of expression of the Cre recombinase in “induced” Igh+/Cγ1-creRab7fl/fl B cells (bottom panel) through germline Iγ1-Sγ1-Cγ1-cre transcription in the IghCγ1-cre allele and IRES-dependent translation (germline Iγ1-Sγ1-Cγ1 transcription in the Igh+ allele is also indicated), as well as the consequent Cre-mediated deletion of the first coding exon of the two Rab7 alleles (47) – one Rab7 allele will remain intact in induced Igh+/Cγ1-creRab7+/fl B cells (top panel). This Rab7fl allele is different from a recently reported Rab7 mutant allele in which the second and third exons are floxed (51). In all of our experiments, Igh+/Cγ1-creRab7fl/fl mice were used as conditional knockout mice and Igh+/Cγ1-creRab7+/fl mice were used as their “wildtype” littermate controls, as these mice did not display hypomorphism in the Rab7 protein expression. Igh+/+Rab7fl/fl mice were not chosen as “wildtype” controls because they have two Igh+ alleles capable of encoding IgG1, while Igh+/Cγ1-creRab7fl/fl mice have only one.
FIGURE 2
FIGURE 2. Abrogation of Rab7 protein expression in Igh+/Cγ1-creRab7fl/fl B cells stimulated by a primary stimulus plus IL-4
(A) DNA electrophoresis of PCR products from the genotyping of four littermates born from breeding of an Igh+/Cγ1-creRab7+/fl mouse with an Igh+/+Rab7fl/fl mouse. (B) PCR analysis of the kinetics of Cre-mediated genomic DNA deletion in the Rab7fl allele and appearance of post-deletion Rab7del allele in Igh+/Cγ1-creRab7fl/fl B cells (top panels) and their Igh+/Cγ1-creRab7+/fl B cell counterparts (bottom panels) after stimulation with CD154 plus IL-4 for 0, 12, 24, 36 and 48 h – in Igh+/Cγ1-creRab7+/fl B cells, the Rab7+ allele should remain constant. The proportion of remaining Rab7fl allele DNA was analyzed by the ratio of band intensity of Rab7fl allele DNA (quantified by the ImageJ software) to that of Rab7+ allele DNA (used as the internal loading control) in Igh+/Cγ1-creRab7+/fl B cells, and was expressed as percentages of the value at 0 h (set as 100%). (C) Immunoblotting analysis of Rab7 expression in Igh+/Cγ1-creRab7fl/fl B cells stimulated with CD154, LPS, or CpG plus anti–δ/dex (as indicated) plus IL-4 for 48 h and their Igh+/Cγ1-creRab7+/fl B cell counterparts. (D) Immunofluorescence staining and confocal microscopy analysis of Rab7 and B220 expression (pseudo-colored) in Igh+/Cγ1-creRab7fl/fl B cells stimulated with CD154 plus IL-4 for 48 h and their Igh+/Cγ1-creRab7+/fl B cell counterparts. (E) Stimulated emission depletion (STED) confocal microscopy analysis of Rab7 and CD40 distribution (pseudo-colored) in Igh+/Cγ1-creRab7+/fl B cells stimulated with CD154 plus IL-4 for 48 h (two different cells are shown). Data are representative of three independent experiments.
FIGURE 3
FIGURE 3. Igh+/Cγ1-creRab7fl/fl mice show normal B and T lymphocyte development and survival
(A) Flow cytometry analysis of expression of B220 and IgM (B cell markers) in bone marrow, spleen and lymph node cells (left panels), expression of CD5, a B1 cell marker in humans and mice (83), and B220 in peritoneal cavity cells (B2 cells were CD5B220hi, B1a cells were CD5+B220+ and B1b cells were CD5 B220+) as well as that of CD5 and IgM or IgA (middle panels), and expression of CD4 and CD8 in CD3+ T cells from the thymus, spleen and lymph nodes (right panels) in Igh+/Cγ1-creRab7fl/fl and Igh+/Cγ1-creRab7+/fl littermate mice. (B) Flow cytometry analysis of the viability (7–AAD) of IgM+ B cells in the bone marrow, spleen and lymph nodes (left panels), as well as that of CD4+ (middle panels) and CD8+ (right panels) T (CD3+) cells in the thymus, spleen and lymph nodes in Igh+/Cγ1-creRab7fl/fl and Igh+/Cγ1-creRab7+/fl mice. Data are representative of three independent experiments.
FIGURE 4
FIGURE 4. Igh+/Cγ1-creRab7fl/fl mice display reduced titers of overall IgG1 and antigen-specific IgG1
(A) ELISA of serum titers of IgM, IgG1, IgG2a, IgG2b, IgG3 and IgA in Igh+/Cγ1-creRab7fl/fl mice (plum) and their Igh+/Cγ1-creRab7+/fl littermates (teal) (mean and s.e.m. of data from five pairs of mice). (B) ELISA of serum titers of high-affinity NP-specific (NP3-binding) IgG1, IgG2a, IgG2b, IgG3 and IgA as well as NP3-binding IgM (due to the high-avidity) in Igh+/Cγ1-creRab7fl/fl (plum) and their Igh+/Cγ1-creRab7+/fl littermate mice (teal) 9 d after injection with NP-CGG (mean and s.e.m. of data from five pairs of mice). (C) ELISA of serum titers of NP3-binding IgM, IgG1, IgG2a, IgG2b, IgG3 and IgA in Igh+/Cγ1-creRab7fl/fl (plum) and their Igh+/Cγ1-creRab7+/fl littermate mice (teal) 9 d after injection with NP-LPS (mean and s.e.m. of data from three pairs of mice). p values, as calculated by paired student t test, less than 0.05 were considered significant.
FIGURE 5
FIGURE 5. Igh+/Cγ1-creRab7fl/fl mice show decreased IgG1+ B cells and IgG1-secreting AFCs
(A) ELISPOT analysis and quantification ((mean and s.e.m. of data from three pairs of mice) of AFCs that produced NP-specific IgM or IgG1 in spleens of Igh+/Cγ1-creRab7fl/fl mice (plum) and their Igh+/Cγ1-creRab7+/fl littermates (teal) 9 d after injection with NP-CGG. p values, as calculated by paired student t test, less than 0.05 were considered significant. (B) Immunofluorescence staining and confocal microscopy analysis of germinal centers (PNAhi) within B220+ follicles in spleens of Igh+/Cγ1-creRab7+/fl and Igh+/Cγ1-creRab7fl/fl littermate mice 9 d after injection with NP-CGG. (C) Cell cycle analysis (top panels; the quadrant corresponding to the G0/G1, S or G2/M phase of the cell cycle was also depicted) and viability analysis (bottom panels; live cells were Annexin V7–AAD) of spleen B cells isolated ex vivo from Igh+/Cγ1-creRab7fl/fl mice and their Igh+/Cγ1-creRab7+/fl littermates 9 d after injection with NP-CGG. (D) Proportion of germinal centers (PNAhi) cells among (B220+) B cells (top panels) and proportion of (CD138+B220hi) plasmablasts and (CD138+B220lo) plasma cells in spleens of Igh+/Cγ1-creRab7fl/fl mice and their Igh+/Cγ1-creRab7+/fl littermates 9 d after injection with NP-CGG. (E) Proportion of IgG1+ (top panels) and IgG3+ (bottom panels) cells among (B220+PNAhi) germinal center B cells in spleens of Igh+/Cγ1-creRab7fl/fl mice and their Igh+/Cγ1-creRab7+/fl littermates 9 d after injection with NP-CGG. Data are representative of three independent experiments.
FIGURE 6
FIGURE 6. Rab7 deficiency in B cells results in defective CSR to IgG1 in vitro
(A) Flow cytometry analysis of proliferation and CSR to IgG1 in CFSE-labeled Igh+/Cγ1-creRab7fl/fl B cells after stimulation by a primary stimulus (CD154, LPS, a TLR ligand, alone or together with anti–Igδ mAb/dex, as indicated) plus IL-4 for 4 d and their Igh+/Cγ1-creRab7+/fl B cell counterparts. (B) Depiction of the proportion of switched IgG1+ cells in CFSE-labeled Igh+/Cγ1-creRab7fl/fl B cells and their Igh+/Cγ1-creRab7+/fl B cell counterparts that had completed each cell division after stimulation by a primary stimulus (CD154, LPS, a TLR ligand or together with anti–Igδ mAb/dex, as indicated) plus IL-4 for 4 d. Data are representative of three independent experiments. (C) ELISA of titers of IgG1 secreted into culture supernatants by Igh+/Cγ1-creRab7fl/fl B cells and their Igh+/Cγ1-creRab7+/fl B cell counterparts after stimulation by the same stimuli as in (B) for 7 d (mean and s.e.m. of data from three independent experiments).
FIGURE 7
FIGURE 7. Igh+/Cγ1-creRab7fl/fl B cells are normal in IgM expression, class-switching to other IgG isotypes and plasma cell differentiation
(A) Flow cytometry analysis of CSR to IgG1 in B cells from Igh+/+Rab7fl/fl and Igh+/Cγ1-creRab7fl/fl littermate mice stimulated by LPS plus IL-4 for 96 h. (B) Flow cytometry analysis of proliferation and CSR to IgG2b, IgG3 or IgG2a in CFSE-labeled Igh+/Cγ1-creRab7fl/fl B cells and their counterparts from Igh+/Cγ1-creRab7+/fl littermates stimulated by a selected primary stimulus, as indicated, plus a cytokine (TGF-β, nil or IFN-γ, as indicated) for 4 d (left panels), and depiction of the proportion of switched (IgG2b+, IgG3+ or IgG2a+) cells in B cells that had completed each cell division (right panels). (C) Flow cytometry analysis of CSR to IgA in Igh+/Cγ1-creRab7fl/fl and Igh+/Cγ1-creRab7+/fl B cells pre-stimulated by CD154 (left panels) or LPS (right panels) plus IL-4 for 48 h and then stimulated by LPS plus TGF-β and anti–Igδ mAb/dex for 72 h to undergo CSR to IgA. (D) Flow cytometry analysis of CSR to IgG1 in Igh+/Cγ1-creRab7fl/fl B cells stimulated by CD154 or LPS plus IL-4 for 5 d and their Igh+/Cγ1-creRab7+/fl B cell counterparts and analysis of CSR to IgG3 after those B cells were stimulated by LPS for 4 d (left panels; cells within red gates were unswitched IgM+IgG1 or IgM+IgG3 cells, and those within blue gates were switched IgG1+IgM or IgG3+IgM cells), quantification of IgM expression levels in unswitched IgM+IgG1 or IgM+IgG3 cells (middle panels). (E) Proportion of (CD138+B220lo) plasma cells after Igh+/Cγ1-creRab7fl/fl B cells and their counterparts from Igh+/Cγ1-creRab7+/fl littermates were stimulated by CD154 or LPS plus IL-4 or by LPS alone for 4 d. Data are representative of three independent experiments.
FIGURE 8
FIGURE 8. Igh+/Cγ1-creRab7fl/fl mice/B cells display impairment in CSR to IgE in vivo and in vitro
(A) Intracellular staining and flow cytometry analysis of CSR to IgE in CFSE-labeled Igh+/Cγ1-creRab7fl/fl B cells and their counterparts from Igh+/Cγ1-creRab7+/fl littermates stimulated by CD154 or LPS plus IL-4 for 5 d (left panels) and depiction of the proportion of switched IgE+ cells in B cells that had completed each cell division (right panels). (B) Intracellular staining and flow cytometry analysis of CSR to IgE and IgG1 in Igh+/Cγ1-creRab7fl/fl B cells stimulated by CD154 plus IL-4 for 5 d and their Igh+/Cγ1-creRab7+/fl B cell counterparts (cells within red gates were switched IgE+IgG1 cells, and those within blue gates were switched IgG1+IgE cells). Data are representative of three independent experiments. (C) ELISA of titers of total (top panels) and ovalbumin-binding (bottom panels) IgM, IgG1 and IgE in Igh+/Cγ1-creRab7fl/fl mice (plum) and their Igh+/Cγ1-creRab7+/fl littermates (teal) 14 d after injection with ovalbumin (mean and s.e.m. of data from three pairs of mice). p values, as calculated by paired student t test, less than 0.05 were considered significant.
FIGURE 9
FIGURE 9. Igh+/Cγ1-creRab7fl/fl B cells are defective in the induction of AID in vivo and in vitro
(A) qRT-PCR analysis of levels of Aicda, IgH germline Iγ1-Sγ1-Cγ1 transcripts, circle Iγ1-Cμ transcript, post-recombination Iμ-Cγ1 transcripts, 14-3-3γ transcripts and Pdrm1 transcripts in B cells isolated ex vivo from Igh+/Cγ1-creRab7fl/fl mice (plum) and their Igh+/Cγ1-creRab7+/fl littermates (teal) 9 d after injection with NP-CGG. Data were normalized to the level of Cd79b and are expressed as ratios of values in Igh+/Cγ1-creRab7+/fl B cells to those in Igh+/Cγ1-creRab7fl/fl B cells (mean and s.e.m. of data from three pairs of mice). (B) qRT-PCR analysis of levels of Aicda transcripts, IgH germline Iγ1-Cγ1 transcripts, circle Iγ1-Cμ transcripts and post-recombination Iμ-Cγ1 transcripts in Igh+/Cγ1-creRab7fl/fl B cells (plum) stimulated by CD154, LPS or CpG plus anti–δ mAb/dex in the presence of IL-4 for 48 h and in their Igh+/Cγ1-creRab7+/fl B cell counterparts (teal). (C) qRT-PCR analysis of levels of Aicda transcripts, IgH germline Iε-Cε transcripts, circle Iε-Cμ transcripts and post-recombination Iμ-Cε transcripts as well as those of Prdm1 and Xbp1 transcripts in Igh+/Cγ1-creRab7fl/fl B cells (plum) stimulated by CD154 plus IL-4 for 48 h and in their Igh+/Cγ1-creRab7+/fl B cell counterparts (teal). (D) qRT-PCR analysis of transcript levels of genes involved in autophagy, as indicated, in Igh+/Cγ1-creRab7fl/fl B cells (plum) stimulated by LPS plus IL-4 for 48 h and in their Igh+/Cγ1-creRab7+/fl B cell counterparts (teal). Data were normalized to the level of Cd79b transcripts and are expressed as ratios of values in Igh+/Cγ1-creRab7+/fl B cells to those in Igh+/Cγ1-creRab7fl/fl B cells (mean and s.e.m. of data from three independent experiments). ***, p < 0.005; **, p < 0.01; *, p < 0.05 (the p values were calculated by paired student t test). (E) Flow cytometry analysis of (CD19+) B cell viability (7-AAD, left panels) and CSR (IgG1+, right panels) in Igh+/Cγ1-creRab7fl/fl B cells pre-stimulated by CD154 plus IL-4 for 48 h, transduced by pTAC or pTAC-AID retrovirus, and then stimulated by CD154 plus IL-4 for 72 h.
FIGURE 10
FIGURE 10. Rab7 deficiency in B cells results in defective canonical NF-κB signaling in vitro
(A) Immunoblotting analysis of levels of Rab7, LC3-I (no processing) and LC3-II (processed and conjugated to phosphatidylethanolamine), phosphorylated and total p65 in the canonical NF-κB pathway, p100 and p52 in the non-canonical NF-κB pathway, AID and β-actin in Igh+/Cγ1-creRab7fl/fl B cells and their Igh+/Cγ1-creRab7+/fl control B cells stimulated by CD154, LPS or CpG plus anti–δ mAb/dex, as indicated, with IL-4 for 48 h. (B) Immunoblotting analysis of levels of phosphorylated and total p38 as well as phosphorylated and total ERK1/2 in MAPK pathways, Blimp-1 and β-actin in Igh+/Cγ1-creRab7fl/fl B cells and their Igh+/Cγ1-creRab7+/fl control B cells stimulated by CD154, LPS or CpG plus anti–δ mAb/dex, as indicated, with IL-4 for 48 h.
FIGURE 11
FIGURE 11. Depiction of defective CSR to IgE in Igh+/Cγ1–creRab7fl/fl B cells
(A) Depiction of direct switching from IgM to IgE (top) and sequential switching from IgM to IgG1 and then IgE in Igh+/Cγ1–creRab7fl/fl B cells. (B) Depiction of defective direct switching from IgM to IgE in Igh+/Cγ1–creRab7fl/fl B cells (top). As the generation of IgG1+ B cells is also impaired (bottom) due to defective CSR from IgM to IgG1, sequential switching from IgM to IgG1 and then IgE is blocked in these B cells.

References

    1. Casali P. Somatic recombination and hypermutation in the immune system. In: Krebs JE, Goldstein ES, Kilpatrick ST, editors. Lewin's Genes XI. Jones & Bartlett; Sudbury, MA: 2014. pp. 459–507.
    1. Xu Z, Zan H, Pone EJ, Mai T, Casali P. Immunoglobulin class-switch DNA recombination: induction, targeting and beyond. Nat. Rev. Immunol. 2012;12:517–531. - PMC - PubMed
    1. Kato L, Stanlie A, Begum NA, Kobayashi M, Aida M, Honjo T. An evolutionary view of the mechanism for immune and genome diversity. J. Immunol. 2012;188:3559–3566. - PubMed
    1. Xu Z, Fulop Z, Wu G, Pone EJ, Zhang J, Mai T, Thomas LM, Al-Qahtani A, White CW, Park SR, Steinacker P, Li Z, Yates JRI, Herron B, Otto M, Zan H, Fu H, Casali P. 14-3-3 adaptor proteins recruit AID to 5′-AGCT-3′-rich switch regions for class switch recombination. Nat. Struct. Mol. Biol. 2010;17:1124–1135. - PMC - PubMed
    1. Li G, White CA, Lam T, Pone EJ, Tran DC, Hayama KL, Zan H, Xu Z, Casali P. Combinatorial H3K9acS10ph histone modification in IgH locus S regions targets 14-3-3 adaptors and AID to specify antibody class-switch DNA recombination. Cell Rep. 2013;5:702–714. - PMC - PubMed

Publication types

MeSH terms