

METABOLISM OF IRON STORES
Abstract
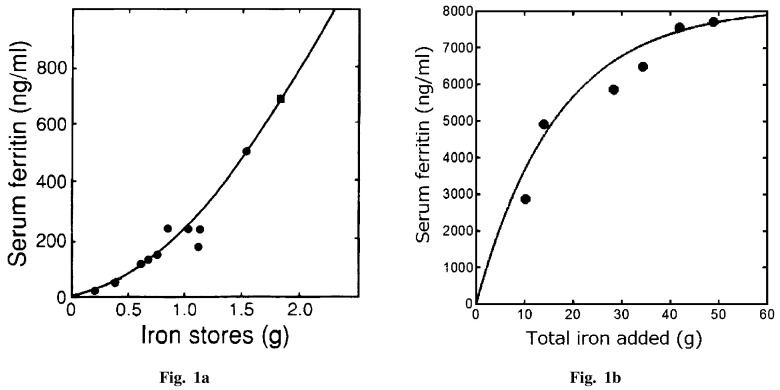
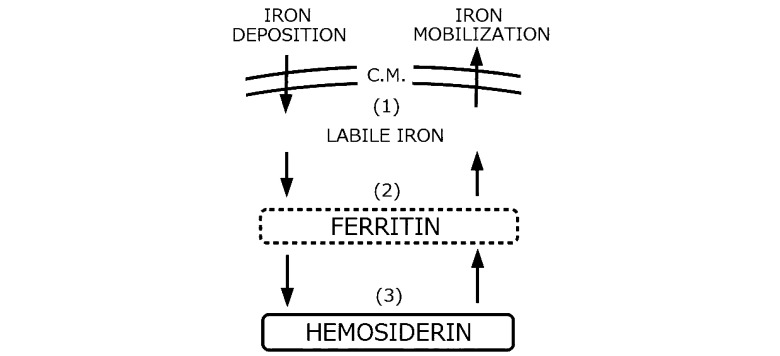
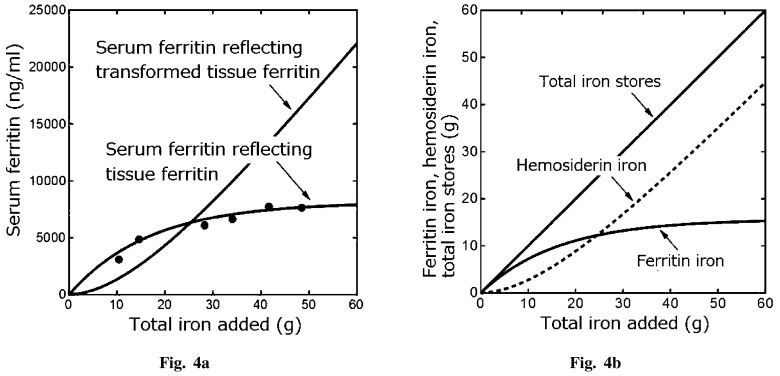
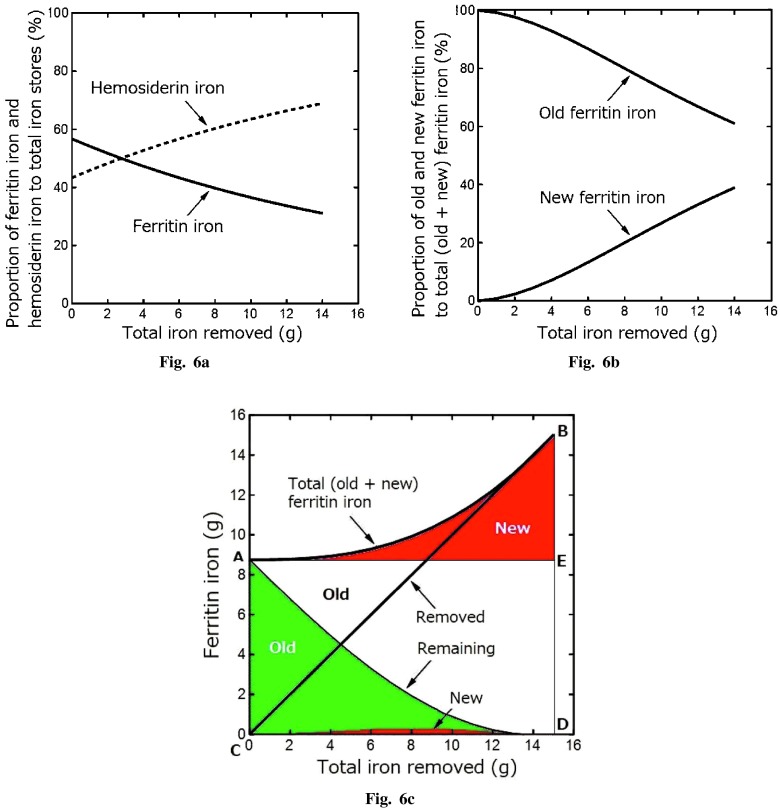
Remarkable progress was recently achieved in the studies on molecular regulators of iron metabolism. Among the main regulators, storage iron, iron absorption, erythropoiesis and hepcidin interact in keeping iron homeostasis. Diseases with gene-mutations resulting in iron overload, iron deficiency, and local iron deposition have been introduced in relation to the regulators of storage iron metabolism. On the other hand, the research on storage iron metabolism has not advanced since the pioneering research by Shoden in 1953. However, we recently developed a new method for determining ferritin iron and hemosiderin iron by computer-assisted serum ferritin kinetics. Serum ferritin increase or decrease curves were measured in patients with normal storage iron levels (chronic hepatitis C and iron deficiency anemia treated by intravenous iron injection), and iron overload (hereditary hemochromatosis and transfusion dependent anemia). We thereby confirmed the existence of two iron pathways where iron flows followed the numbered order (1) labile iron, (2) ferritin and (3) hemosiderin in iron deposition and mobilization among many previously proposed but mostly unproven routes. We also demonstrated the increasing and decreasing phases of ferritin iron and hemosiderin iron in iron deposition and mobilization. The author first demonstrated here the change in proportion between pre-existing ferritin iron and new ferritin iron synthesized by removing iron from hemosiderin in the course of iron removal. In addition, the author disclosed the cause of underestimation of storage iron turnover rate which had been reported by previous investigators in estimating storage iron turnover rate of normal subjects.
Keywords: ferritin and hemosiderin; iron deficiency and overload; serum ferritin kinetics; storage iron turnover.
Figures


Similar articles
-
Transformation rate between ferritin and hemosiderin assayed by serum ferritin kinetics in patients with normal iron stores and iron overload.Nagoya J Med Sci. 2015 Nov;77(4):571-83. Nagoya J Med Sci. 2015. PMID: 26663936 Free PMC article.
-
Determination of ferritin and hemosiderin iron in patients with normal iron stores and iron overload by serum ferritin kinetics.Nagoya J Med Sci. 2012 Feb;74(1-2):39-49. Nagoya J Med Sci. 2012. PMID: 22515110 Free PMC article.
-
Increasing and decreasing phases of ferritin and hemosiderin iron determined by serum ferritin kinetics.Nagoya J Med Sci. 2013 Aug;75(3-4):213-23. Nagoya J Med Sci. 2013. PMID: 24640177 Free PMC article.
-
Storage Iron Turnover from a New Perspective.Acta Haematol. 2019;141(4):201-208. doi: 10.1159/000496324. Epub 2019 Apr 3. Acta Haematol. 2019. PMID: 30943466 Review.
-
Nature of storage iron turnover.Nagoya J Med Sci. 2024 Aug;86(3):361-369. doi: 10.18999/nagjms.86.3.361. Nagoya J Med Sci. 2024. PMID: 39355366 Free PMC article. Review.
Cited by
-
Quantification of Iron Release from Native Ferritin and Magnetoferritin Induced by Vitamins B2 and C.Int J Mol Sci. 2020 Aug 31;21(17):6332. doi: 10.3390/ijms21176332. Int J Mol Sci. 2020. PMID: 32878313 Free PMC article.
-
Clinical and Molecular Aspects of Iron Metabolism in Failing Myocytes.Life (Basel). 2022 Aug 8;12(8):1203. doi: 10.3390/life12081203. Life (Basel). 2022. PMID: 36013382 Free PMC article. Review.
-
Iron and zinc exploitation during bacterial pathogenesis.Metallomics. 2015 Dec;7(12):1541-54. doi: 10.1039/c5mt00170f. Epub 2015 Oct 26. Metallomics. 2015. PMID: 26497057 Free PMC article. Review.
-
Sex-Specific Associations between Serum Ferritin and Osteosarcopenic Obesity in Adults Aged over 50 Years.Nutrients. 2022 Sep 28;14(19):4023. doi: 10.3390/nu14194023. Nutrients. 2022. PMID: 36235680 Free PMC article.
-
Relationship between brain iron dynamics and blood-brain barrier function during childhood: a quantitative magnetic resonance imaging study.Fluids Barriers CNS. 2023 Aug 17;20(1):60. doi: 10.1186/s12987-023-00464-x. Fluids Barriers CNS. 2023. PMID: 37592310 Free PMC article. Clinical Trial.
References
-
- Bothwell TH et al. Clinical estimation of body iron stores. In: Iron metabolism in man. Clinical estimation of body iron stores; pp 88–93. Internal iron kinetics; pp 327–349, 1979. Edited by Bothwell TH, Charlton R, Cook JD and Finch CA. Blackwell Scientific Publications, Oxford London Edinburgh Melbourne.
-
- Shoden A, Gabrio BW, Finch CA. The relationship between ferritin and hemosiderin in rabbits and man. J Biol Chem, 1953; 204(2): 823–830. - PubMed
-
- Sturgeon P, Shoden A. Mechanism of iron storage. In: Iron metabolism. pp 121–146, 1964. An international symposium sponsored by CIBA at Aix-en-Provence, 1963. Edited by Gross F. Springer-Verlag Berlin, Göttingen, Heidelberg.
-
- Cook JD, Finch CA, Smith NJ. Evaluation of the iron status of a population. Blood, 1976; 48(3): 449–455. - PubMed
Publication types
LinkOut - more resources
Full Text Sources