Walking Speed and Brain Glucose Uptake are Uncoupled in Patients with Multiple Sclerosis
- PMID: 25741275
- PMCID: PMC4332285
- DOI: 10.3389/fnhum.2015.00084
Walking Speed and Brain Glucose Uptake are Uncoupled in Patients with Multiple Sclerosis
Abstract
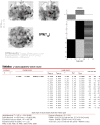
Motor impairments of the upper and lower extremities are common symptoms of multiple sclerosis (MS). While some peripheral effects like muscle weakness and loss of balance have been shown to influence these symptoms, central nervous system activity has not been fully elucidated. The purpose of this study was to determine if alterations in glucose uptake were associated with motor impairments in patients with multiple sclerosis. Eight patients with multiple sclerosis (four men) and eight sex matched healthy controls performed 15 min of treadmill walking at a self-selected pace, during which ≈322 MBq of the positron emission tomography (PET) glucose analog [(18)F]-fluorodeoxyglucose (FDG) was injected. Immediately after the cessation of walking, participants underwent PET imaging. Patients with MS had lower FDG uptake in ≈40% of the brain compared to the healthy controls (p FWE-corr < 0.001, q FDR-corr < 0.001, k e = 93851) and walked at a slower speed [MS, 1.1 (0.2), controls 1.4 (0.1), m/s, P = 0.014]. Within the area of lower FDG uptake 15 regions were identified. Of these 15 regions, 13 were found to have strong to moderate correlations to walking speed within the healthy controls (r > -0.75, P < 0.032). Within patients with MS only 3 of the 15 regions showed significant correlations: insula (r = -0.74, P = 0.036), hippocampus (r = -0.72, P = 0.045), and calcarine sulcus (r = -0.77, P = 0.026). This data suggest that walking impairments in patients with MS may be due to network wide alterations in glucose metabolism. Understanding how brain activity and metabolism are altered in patients with MS may allow for better measures of disability and disease status within this clinical population.
Keywords: brain activity; glucose uptake; movement disorder; multiple sclerosis; positron emission tomography; walking.
Figures


Similar articles
-
Glucose uptake of the spinal cord in patients with multiple sclerosis detected by ¹⁸F-fluorodeoxyglucose PET/CT after walking.Spinal Cord. 2014 Nov;52 Suppl 3:S11-3. doi: 10.1038/sc.2014.130. Spinal Cord. 2014. PMID: 25376308
-
Asymmetric glucose uptake in leg muscles of patients with Multiple Sclerosis during walking detected by [18F]-FDG PET/CT.NeuroRehabilitation. 2014;35(4):813-23. doi: 10.3233/NRE-141179. NeuroRehabilitation. 2014. PMID: 25323085
-
Glucose uptake heterogeneity of the leg muscles is similar between patients with multiple sclerosis and healthy controls during walking.Clin Biomech (Bristol). 2015 Feb;30(2):159-65. doi: 10.1016/j.clinbiomech.2014.12.005. Epub 2014 Dec 17. Clin Biomech (Bristol). 2015. PMID: 25541392 Free PMC article.
-
Imaging of glucose uptake during walking in elderly adults.Curr Aging Sci. 2012 Feb;5(1):51-7. doi: 10.2174/1874609811205010051. Curr Aging Sci. 2012. PMID: 21762089 Review.
-
Performance and Capacity Measurement of the Lower Extremities in Multiple Sclerosis -How to Approach?Noro Psikiyatr Ars. 2018;55(Suppl 1):S84-S87. doi: 10.29399/npa.23352. Noro Psikiyatr Ars. 2018. PMID: 30692864 Free PMC article. Review.
Cited by
-
Brain mapping for long-term recovery of gait after supratentorial stroke: A retrospective cross-sectional study.Medicine (Baltimore). 2018 Apr;97(16):e0453. doi: 10.1097/MD.0000000000010453. Medicine (Baltimore). 2018. PMID: 29668613 Free PMC article.
-
Dietary Therapy in Secondary Progressive Multiple Sclerosis: A Case Report.Cureus. 2019 Aug 7;11(8):e5341. doi: 10.7759/cureus.5341. Cureus. 2019. PMID: 31428547 Free PMC article.
-
Multiple Sclerosis, Cannabis Use, and Clinical Disability: A Preliminary [18F]-Fluorodeoxyglucose Positron Emission Tomography Study.Cannabis Cannabinoid Res. 2018 Oct 13;3(1):213-218. doi: 10.1089/can.2018.0019. eCollection 2018. Cannabis Cannabinoid Res. 2018. PMID: 30324138 Free PMC article.
-
Calibrated imaging reveals altered grey matter metabolism related to white matter microstructure and symptom severity in multiple sclerosis.Hum Brain Mapp. 2017 Nov;38(11):5375-5390. doi: 10.1002/hbm.23727. Epub 2017 Aug 16. Hum Brain Mapp. 2017. PMID: 28815879 Free PMC article.
-
The Therapeutic Potential of the Ketogenic Diet in Treating Progressive Multiple Sclerosis.Mult Scler Int. 2015;2015:681289. doi: 10.1155/2015/681289. Epub 2015 Dec 29. Mult Scler Int. 2015. PMID: 26839705 Free PMC article. Review.
References
-
- Bakshi R., Miletich R. S., Kinkel P. R., Emmet M. L., Kinkel W. R. (1998). High-resolution fluorodeoxyglucose positron emission tomography shows both global and regional cerebral hypometabolism in multiple sclerosis. J. Neuroimaging 8, 228–234. - PubMed
Grants and funding
LinkOut - more resources
Full Text Sources
Other Literature Sources

