. 2015 Feb 18:6:30.
doi: 10.3389/fneur.2015.00030. eCollection 2015.

Drug resistance in cortical and hippocampal slices from resected tissue of epilepsy patients: no significant impact of p-glycoprotein and multidrug resistance-associated proteins

Affiliations

Drug resistance in cortical and hippocampal slices from resected tissue of epilepsy patients: no significant impact of p-glycoprotein and multidrug resistance-associated proteins

Nora Sandow et al. Front Neurol. .

Abstract

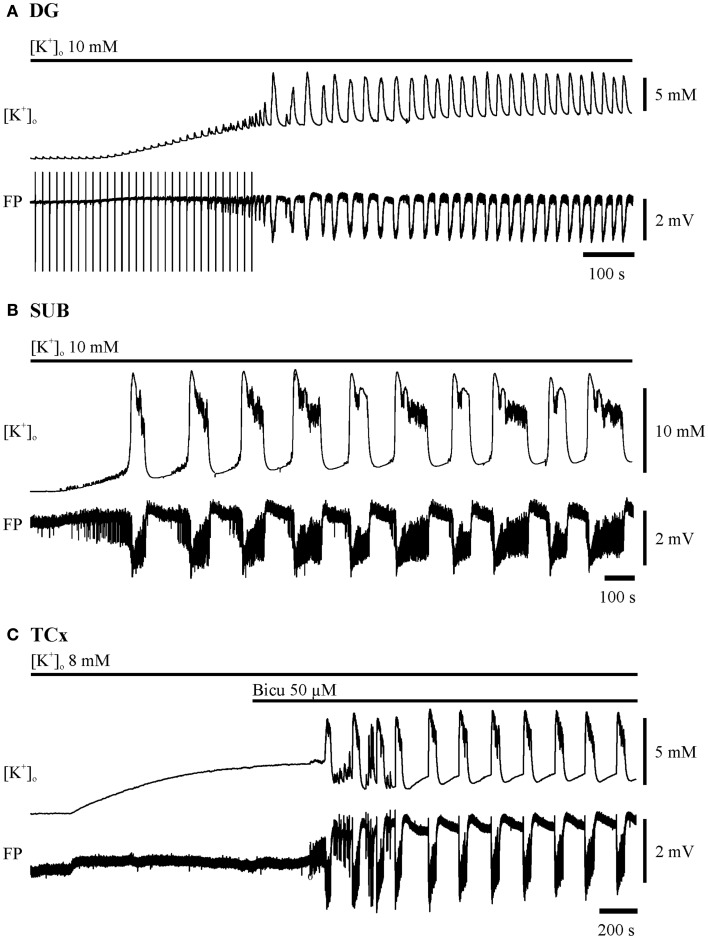
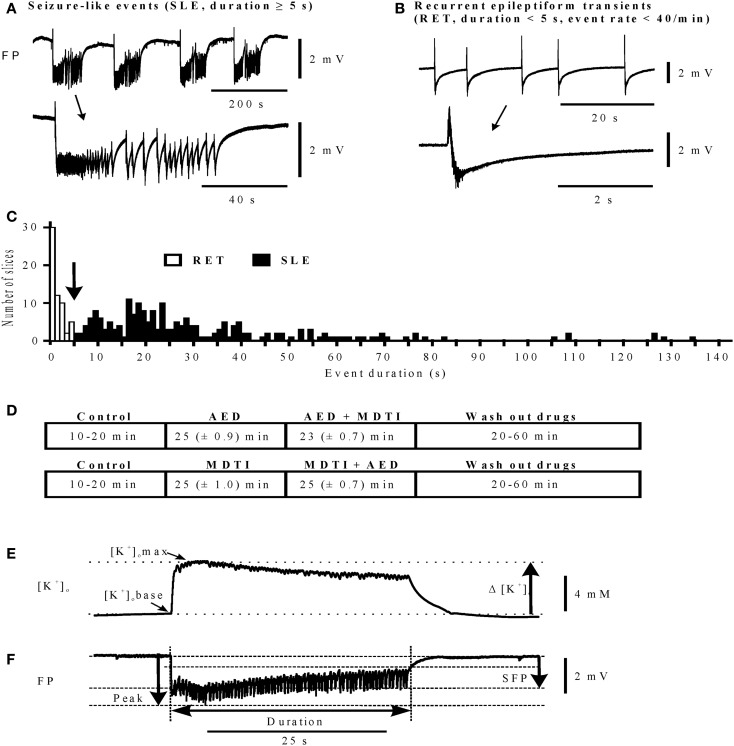
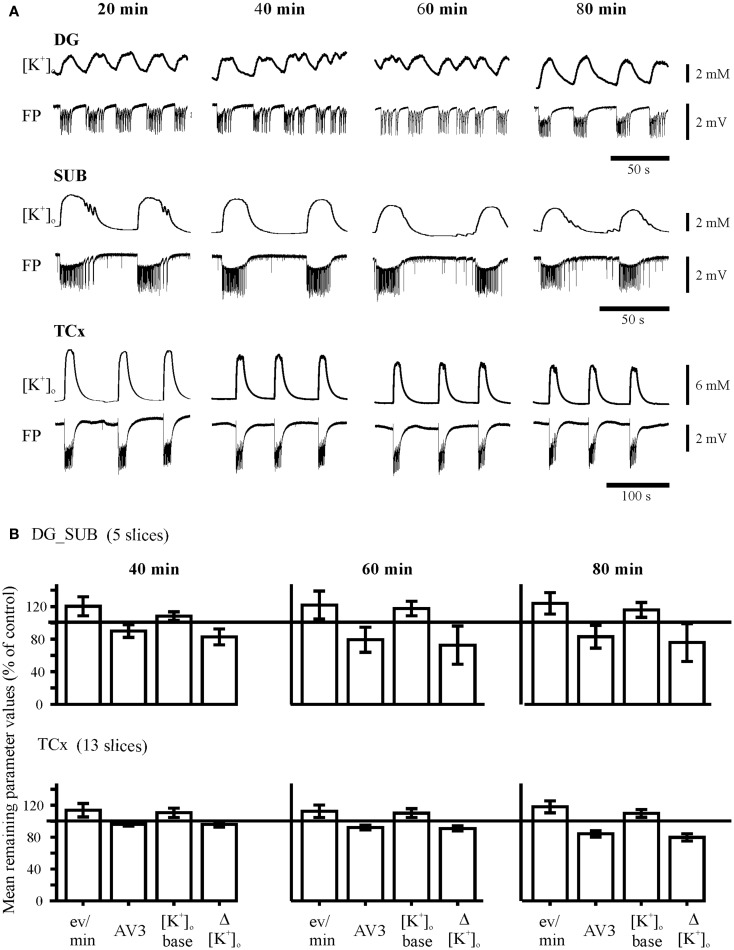
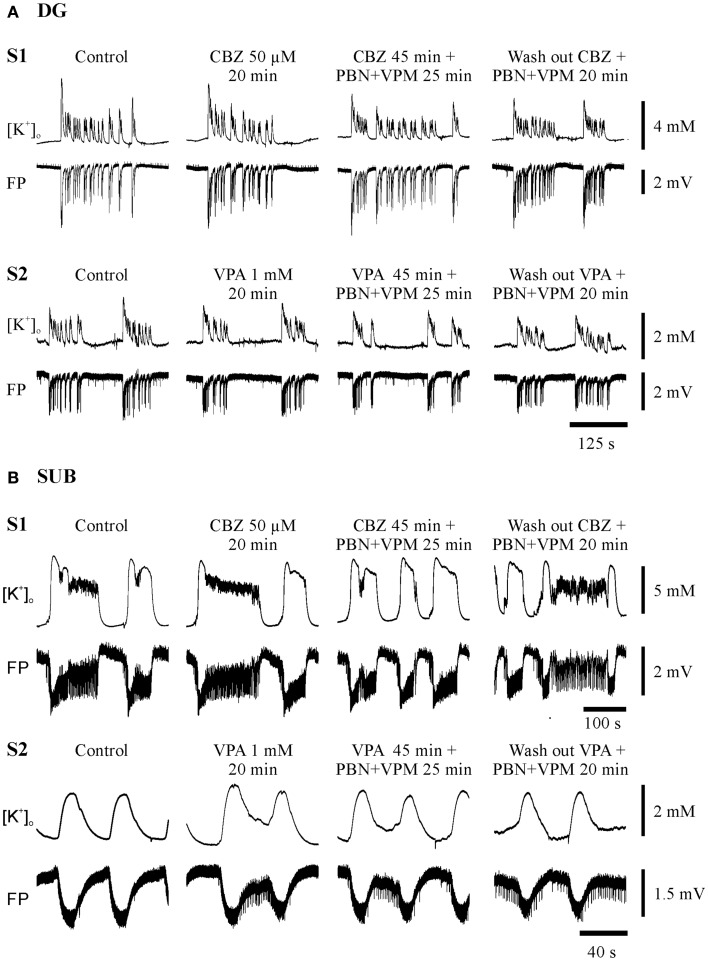
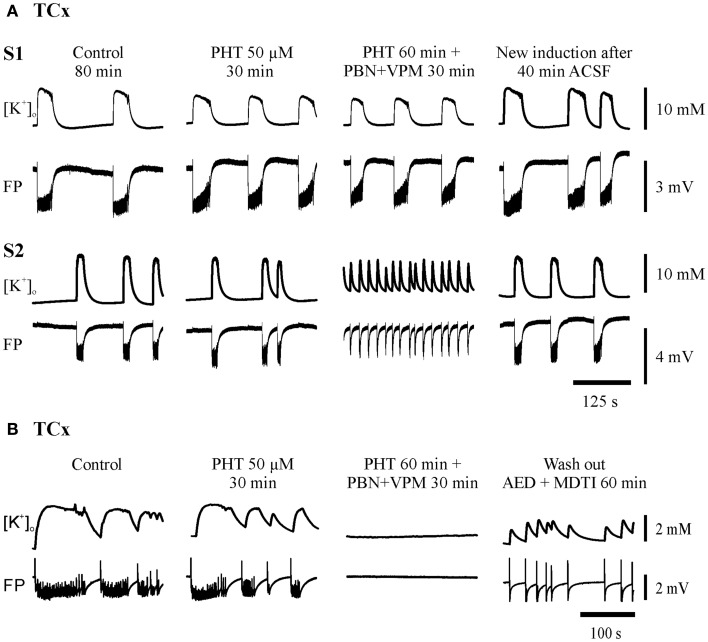
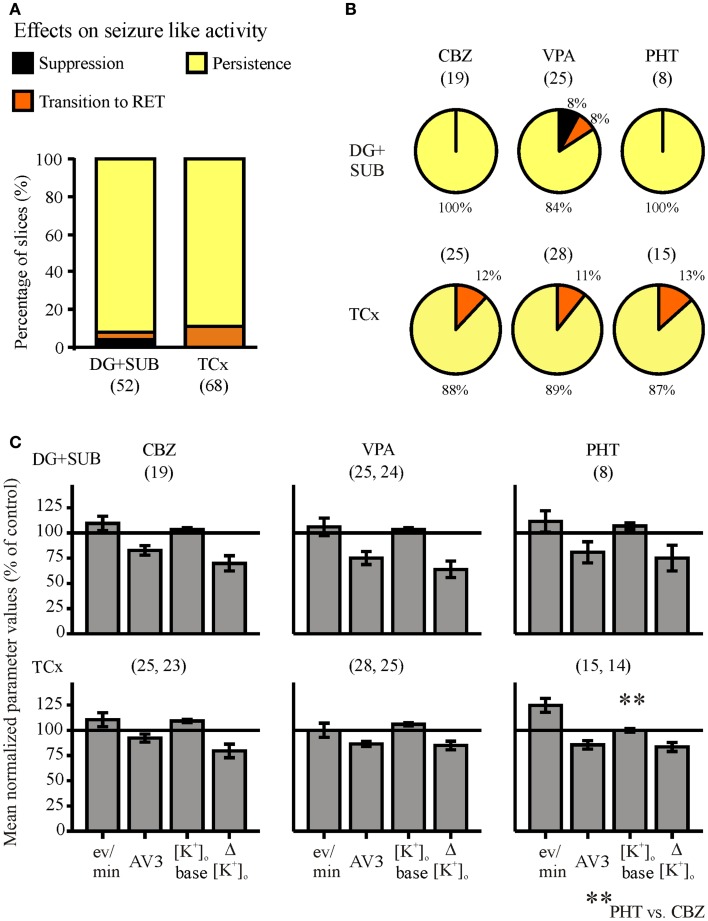
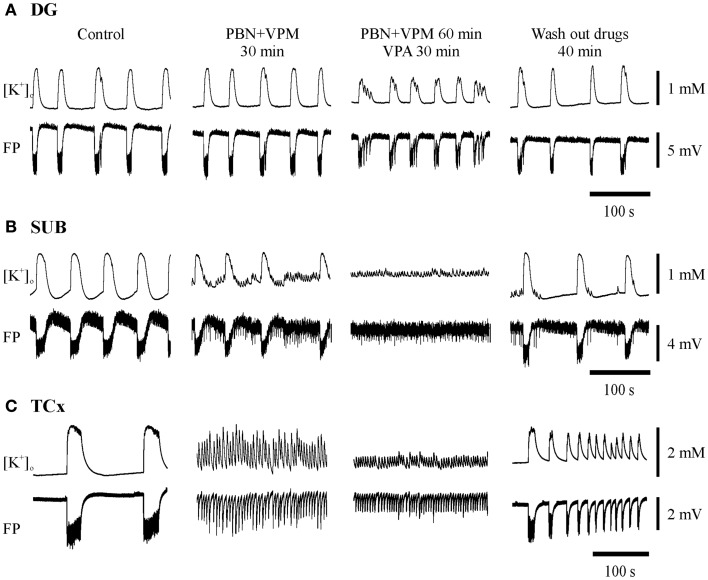
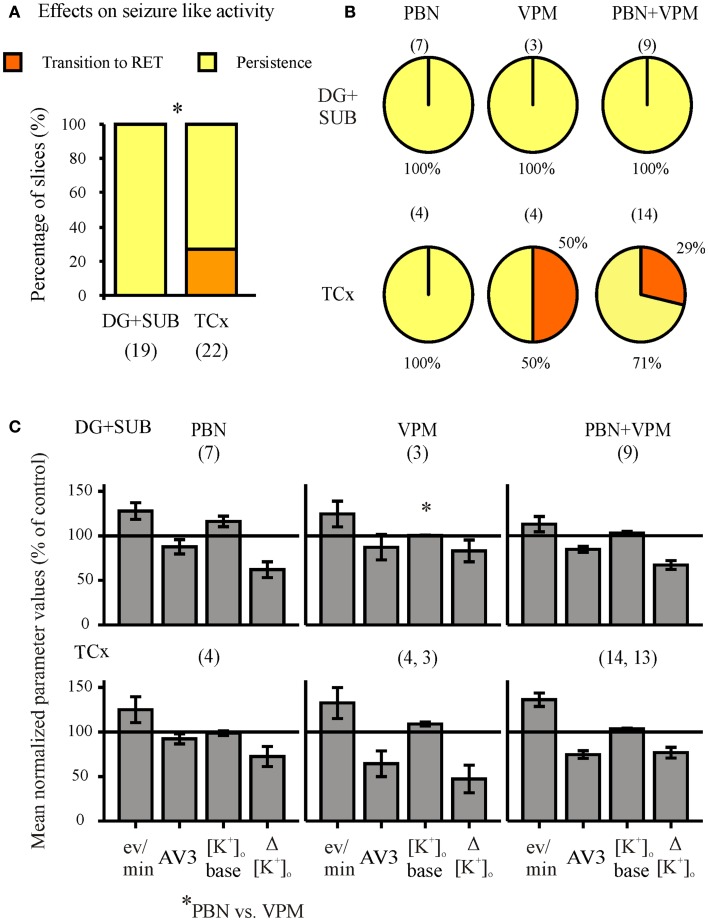
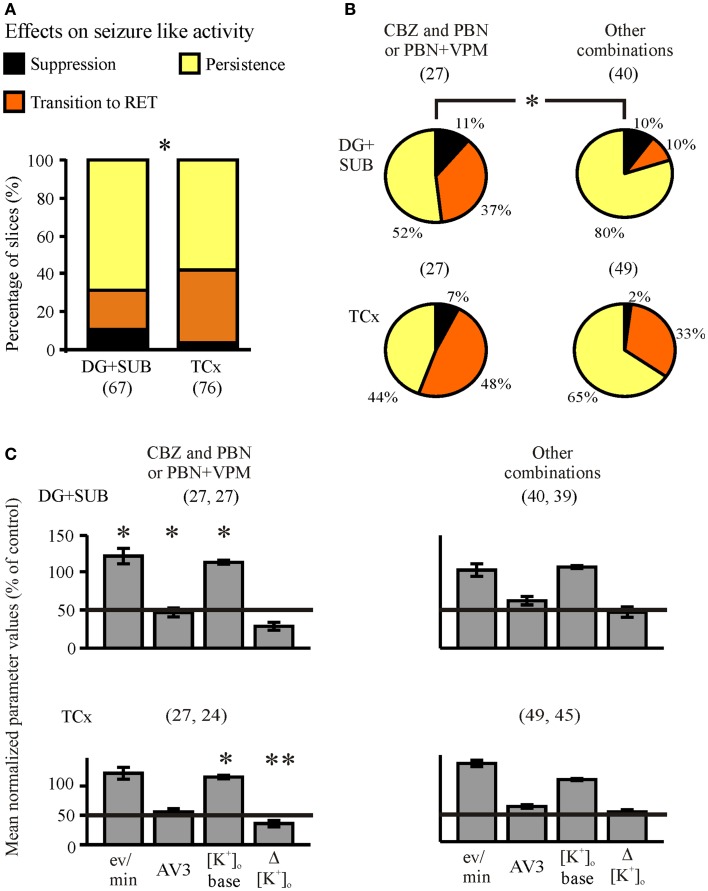
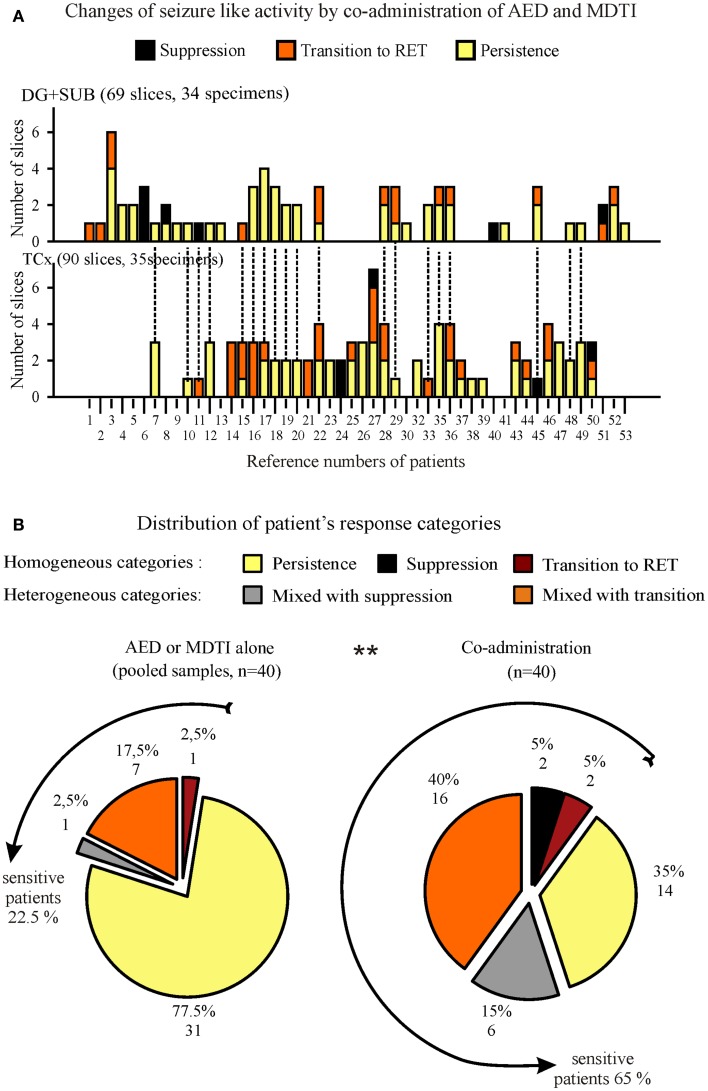
Drug resistant patients undergoing epilepsy surgery have a good chance to become sensitive to anticonvulsant medication, suggesting that the resected brain tissue is responsible for drug resistance. Here, we address the question whether P-glycoprotein (Pgp) and multidrug resistance-associated proteins (MRPs) expressed in the resected tissue contribute to drug resistance in vitro. Effects of anti-epileptic drugs [carbamazepine (CBZ), sodium valproate, phenytoin] and two unspecific inhibitors of Pgp and MRPs [verapamil (VPM) and probenecid (PBN)] on seizure-like events (SLEs) induced in slices from 35 hippocampal and 35 temporal cortex specimens of altogether 51 patients (161 slices) were studied. Although in slice preparations the blood brain barrier is not functional, we found that SLEs predominantly persisted in the presence of anticonvulsant drugs (90%) and also in the presence of VPM and PBN (86%). Following subsequent co-administration of anti-epileptic drugs and drug transport inhibitors, SLEs continued in 63% of 143 slices. Drug sensitivity in slices was recognized either as transition to recurrent epileptiform transients (30%) or as suppression (7%), particularly by perfusion with CBZ in PBN containing solutions (43, 9%). Summarizing responses to co-administration from more than one slice per patient revealed that suppression of seizure-like activity in all slices was only observed in 7% of patients. Patients whose tissue was completely or partially sensitive (65%) presented with higher seizure frequencies than those with resistant tissue (35%). However, corresponding subgroups of patients do not differ with respect to expression rates of drug transporters. Our results imply that parenchymal MRPs and Pgp are not responsible for drug resistance in resected tissue.

Keywords: TLE; carbamazepine; phenytoin; probenecid; seizure-like events; sodium valproate; surgically resected tissue; verapamil.


Figures

Figure 1
Figure 1
Induction of seizure-like events in the dentate gyrus (DG), subiculum (SUB), and in deep layers of the temporal neocortex (TCx). The two traces depicted for each region display recordings of [K+]o (top) and field potential (FP) bottom. Time and amplitude of signals are given by calibration bars on the right. Bars above each pair of traces mark the perfusion of the ictogenic buffer solution. (A) DG: hilar double pulse stimulation (pulse duration 0.1 ms, pulse interval 50 ms, stimulus intensity for pulses in the range of 80% of the maximal field potential amplitude, frequency 0.067 Hz). The stimulation was performed before and during elevation of [K+]o to 10 mM, and had been set off when epileptiform discharges appeared independent of electrical pulses. (B) SUB: elevation of [K+]o to 10 mM. (C) TCx: elevation of [K+]o to 8 mM and addition of 50 μM Bicuculline when [K+]o approximated the plateau of equilibration.
Figure 2
Figure 2
Differentiation of epileptiform activities and determination of characteristic parameters. (A,B) Traces of activity (top), single events marked by arrow are displayed on an expanded time scale (bottom), calibration bar for field potential amplitudes on the right. (A) Seizure-like events (SLEs); (B) recurrent epileptiform transients (RETs); (C) histogram of event durations for RETs and SLEs, bin width 1 s; (D) protocol sequences in main experiments: top (n = 120): control, AED, AED + MDTIs, and Wash out of drugs; bottom (n = 41): control, MDTIs, MDTIs + AED, and Wash out of drugs. For periods of Control and Wash out durations are given as Min and Max, and for the drug periods as Mean (±SEM). (E) Parameters determined for event-associated changes of extracellular potassium concentrations ([K+]o in mM): [K+]o base in the beginning of an event, [K+]o max at the maximum value, Δ [K+]o rise of [K+]o; (F) parameters determined for event-associated deviations of the field potential (FP): sfp (mV) maximum of the slow field potential amplitude, peak (mV) maximum of the peak amplitude, and duration (s) event duration (time from beginning of the event up to 2/3 recovery of the sfp deflection). (E,F) Calibration bar for [K+]o and FP on the right. Abscissa in (A,B,E,F): time in seconds (calibration bar below the FP traces).
Figure 3
Figure 3
Control experiments. (A) Time-matched experiments without any drug perfusion in the dentate gyrus (DG), subiculum (SUB), and the temporal neocortex (TCx). The recordings of [K+]o and field potential (FP) were taken from the end of each time interval, marked above traces. Calibration bars for amplitude and time are given on the right. (B) Time matched remaining parameter values (percent of control values). The remaining parameter values for event rate (eV/min), AV3 (averaged remaining normalized parameter values for sfp, peak, and duration), [K+]o base, and ([K+]o show variability or slight run down but no pattern change throughout time.
Figure 4
Figure 4
Typical experiments in sister-slices from the same hippocampal specimen show persistence of SLE at the end of each protocol sequences (control, AED, AED + MDTIs, washout). (A) In the dentate gyrus (DG), (B) in the subiculum (SUB), S1 slice 1 with application of CBZ, S2 slice 2 with application of VPA for both regions. The drugs applied are described above the pairs of traces, which display [K+]o (top), and field potential (FP) bottom. Amplitudes and time are given by calibration bars on the right.
Figure 5
Figure 5
Typical experiments in slices from TCx-specimens. The traces were taken at the end of all subsequent protocol sequences (control, AED, AED + MDTIs, washout). (A) In sister-slices from the same specimen: S1 displaying resistance of SLEs against PHT and PHT + PBN + VPM; S2 illustrates resistance against PHT but transition of SLE to RET during co-administration (PHT + PBN + VPM); (B) in another specimen also displaying resistance of SLE against PHT but suppression of SLE during co-administration (PHT + PBN + VPM). The drugs applied are described above each pair of traces, which display [K+]o (top) and field potential (FP) (bottom). Calibration bars for amplitude and time are given on the right.
Figure 6
Figure 6
Summarized effects of anti-epileptic drugs (AEDs) on seizure-like events. Categories of drug effects, marked by different colors, are shown on top of (A). (A) Proportional distribution of AED-effects in hippocampal and cortical slice-groups. (B) Effects of carbamazepine (CBZ), valproate (VPA), and phenytoin (PHT) in hippocampal (top) and neocortical slices (bottom). (C) Corresponding averaged remaining normalized parameter values for event rate (eV/min), AV3 (average of normalized values for sfp, peak, and duration), [K+]o base, and ([K+]o. Ordinates: (A) percentage of slices; (C) means ± SEM for remaining percentages of control values. Signs for significant differences between ranges of values for PHT vs. CBZ **p ≤ 0.01. Numbers in parenthesis give number of slices in sub-samples (A,B), or number of slices analyzed (C). The second numbers in parenthesis of (C) display the number of slices with reliable measurements of [K+]o.
Figure 7
Figure 7
Typical experiments with administration of probenecid (PBN) and verapamil (VPM) followed by addition of an AED in the three regions investigated. Substances applied are described above the pairs of traces displaying [K+]o (top) and FP (bottom). Traces were taken at the end of each protocol-sequence. (A,B) Synchronous recordings from one hippocampal specimen in DG and SUB display resistance of SLE against PBN + VPM in both regions while co-administration with VPA resulted in persistence of SLEs in the DG and in replacement of SLEs by RETs in the SUB; (C) recordings from a cortical specimen of another patient show transition to RET already after application of PBN + VPM, thereby indicating seizure modifying effects of MDTIs, which become more pronounced after co-administration with VPA. (A,C) Amplitudes and time are given by calibration bars on the right.
Figure 8
Figure 8
Summarized effects of unspecific inhibitors of P-glycoprotein (Pgp) and multi-drug resistance-associated proteins (MRPs). Categories of drug effects, marked by different colors, are shown on top of (A). (A) Proportional distribution of effects after administration of MDTIs in hippocampal and cortical slice-groups. (B) Circles representing the distribution of effects by probenecid (PBN), verapamil (VPM), and both PBN and VPM in hippocampal (top) and cortical slice-groups (bottom). (C) Corresponding averaged remaining normalized parameter values for event rate, AV3 (average of normalized values for sfp, peak, and duration), [K+]o base, and ([K+]o. Ordinates: (A) percentage of slices; (C) means ± SEM for percentages of control values. Signs for significant differences between proportional distributions *p ≤ 0.05, or ranges of values for PBN vs. PBN + VPM *p ≤ 0.05. Numbers in parenthesis give number of slices in sub-samples (A,B). The numbers in (B) also apply to (C).
Figure 9
Figure 9
Summarized effects of one AED and MDTIs (co-administration). Categories of drug effects, marked by different colors, are shown on top of (A). (A) Proportions of slices showing different effects of co-administration in hippocampal and cortical slice-groups. (B) Proportional distributions of effects by CBZ and PBN-containing solutions (CBZ + PBN, CBZ + PBN + VPM) and by other combinations (CBZ + VPM, VPA + PBN, VPA + VPM, VPA + PBN + VPM, and PHT + PBN + VPM), given in circles for hippocampal (top) and cortical slice-groups (bottom). (C) Corresponding averaged remaining normalized parameter values for event rate (eV/min), AV3 (average of normalized values for sfp, peak, and duration), [K+]o base, and ([K+]o. Ordinates: (A) percentage of slices; (C) means ± SEM for remaining percentages of control values. Signs for significant differences between proportional distributions of effects or between ranges of values in separate groups (treatment or regions) *p ≤ 0.05, **p ≤ 0.01. Numbers in parenthesis give number of slices in sub-samples (A,B) or number of slices analyzed (C). The second number in parenthesis of (C) displays the corresponding number of slices with reliable measurements of [K+]o.
Figure 10
Figure 10
Summarized responses to co-administration of AED and MDTIs in specimens and patients. (A) Effects in slices from hippocampal (top) and cortical (bottom) specimens, ordered by patient number for determination of the patient’s response category. Patients providing both, hippocampal and cortical specimens are marked by dotted lines on top of columns in (B). (B) Proportional distribution of different response categories for patients with at least two slices in the analysis. In order to evaluate the changes by co-administration, we present two circles, one for responses to AED or MDTIs alone (pooled sample, left) and another one for responses to co-administration (right). The lines around circles indicate subgroups of patients who were “sensitive” to the respective treatment in at least one slice. Numbers in parenthesis denote the number of slices/specimens (A) or the number of patients (B).

Similar articles

Cited by

References

    1. Semah F, Picot MC, Adam C, Broglin D, Arzimanoglou A, Bazin B, et al. Is the underlying cause of epilepsy a major prognostic factor for recurrence? Neurology (1998) 51(5):1256–62.10.1212/WNL.51.5.1256 - DOI - PubMed
    1. Schmidt D, Loscher W. New developments in antiepileptic drug resistance: an integrative view. Epilepsy Curr (2009) 9(2):47–52.10.1111/j.1535-7511.2008.01289.x - DOI - PMC - PubMed
    1. Loscher W, Schmidt D. Experimental and clinical evidence for loss of effect (tolerance) during prolonged treatment with antiepileptic drugs. Epilepsia (2006) 47(8):1253–84.10.1111/j.1528-1167.2006.00607.x - DOI - PubMed
    1. Remy S, Gabriel S, Urban BW, Dietrich D, Lehmann TN, Elger CE, et al. A novel mechanism underlying drug resistance in chronic epilepsy. Ann Neurol (2003) 53(4):469–79.10.1002/ana.10473 - DOI - PubMed
    1. Remy S, Beck H. Molecular and cellular mechanisms of pharmacoresistance in epilepsy. Brain (2006) 129(Pt 1):18–3510.1093/brain/awh682 - DOI - PubMed

LinkOut - more resources