. 2015 Feb 26:7:7.
doi: 10.1186/s13321-015-0055-9. eCollection 2015.

Systems biology approaches for advancing the discovery of effective drug combinations

Affiliations

Systems biology approaches for advancing the discovery of effective drug combinations

Karen A Ryall et al. J Cheminform. .

Abstract

Complex diseases like cancer are regulated by large, interconnected networks with many pathways affecting cell proliferation, invasion, and drug resistance. However, current cancer therapy predominantly relies on the reductionist approach of one gene-one disease. Combinations of drugs may overcome drug resistance by limiting mutations and induction of escape pathways, but given the enormous number of possible drug combinations, strategies to reduce the search space and prioritize experiments are needed. In this review, we focus on the use of computational modeling, bioinformatics and high-throughput experimental methods for discovery of drug combinations. We highlight cutting-edge systems approaches, including large-scale modeling of cell signaling networks, network motif analysis, statistical association-based models, identifying correlations in gene signatures, functional genomics, and high-throughput combination screens. We also present a list of publicly available data and resources to aid in discovery of drug combinations. Integration of these systems approaches will enable faster discovery and translation of clinically relevant drug combinations. Graphical abstractSpectrum of Systems Biology Approaches for Drug Combinations.

Keywords: Cancer; Computational modeling; Drug combinations; Drug discovery; Systems biology.


Figures
Graphical abstract
Graphical abstract
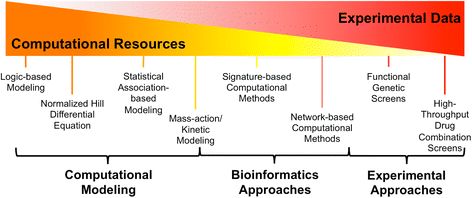
Spectrum of Systems Biology Approaches for Drug Combinations.
Figure 1
Figure 1
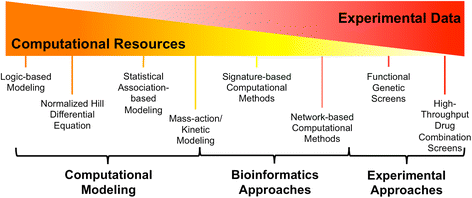
Diagram depicting estimated ratio of computational and experimental requirements for various methods in this review. For example, mass-action/kinetic modeling has higher experimental requirements than logic-based and normalized-Hill-based modeling due to its need for many abundance and rate parameters. Unbiased high-throughput screening of drug combinations has the highest experimental requirement. Many of the systems biology methods in this review aim to use publicly available data and computational approaches to reduce the need for exhaustive screens and prioritize combinations for experimental validation.
Figure 2
Figure 2
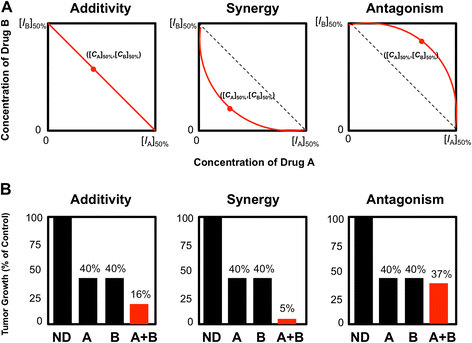
Examples of Loewe Additivity and Bliss Independence in defining drug interactions. A) Additivity, synergy and antagonism of drug combination as defined by Loewe Additivity. Let x and y-axes represent concentrations of drugs A and B to achieve a defined effect X% (e.g., X = 50% for half maximal inhibitory concentration (IC50) of [I A]50% and [I B]50%), respectively. The coordinates ([I A]50%,0) and (0, [I B]50%) represent the concentration for drugs A and B, respectively. The line of additivity is constructed by connecting these two points for a 50% effect isobologram plot. The concentrations of the two drugs used in combination to provide the same effect X% (e.g. X = 50%) will be denoted by point ([C A]50%,[C B]50%) and are placed in the same plot. Synergy, additivity, or antagonism will be determined when this point ([C A]50%,[C B]50%) is located below, on, or above the line, respectively. More generally, linear, concave, and convex isoboles represent non-interacting, synergy, and antagonistic drug combination, respectively. B) Additivity, synergy and antagonism of drug combination as defined by Bliss Independence. For example, if two non-interacting drugs (A and B) each result in 40% tumor growth compared to control (E A = 0.4, E B = 0.4), then the predicted tumor growth when combined would be E C = (0.4 x 0.4) = 0.16, (16% of control). If the observed combined (A + B, red bar) tumor growth is similar to, less than, or greater than 16% of control, then the combination would be deemed as additive, synergistic, or antagonistic, respectively. N.D. denotes no drug (control).
Figure 3
Figure 3
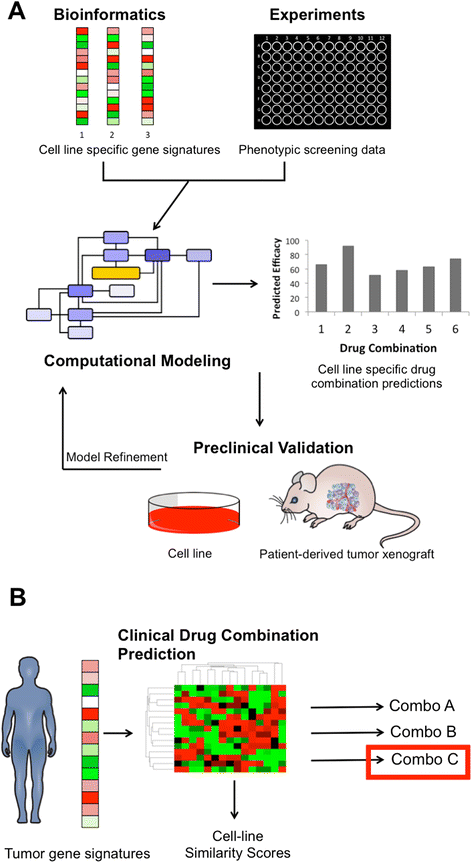
Future strategy for drug combination predictions with parallel integration of computational modeling, preclinical testing, and clinical trials. A) Future combinatorial drug discovery approaches will benefit from tighter integration of gene signatures and phenotypic screen data with computational models, tuning the models to specific cancer cell-lines. Model simulations enable prediction of effective drug combinations for preclinical validation. Preclinical data can then be used to further refine computational models. B) For clinical application, patient gene signatures can be clustered with gene expression signatures from previously modeled cell lines. Similarity scores can then be computed to find the most similar model to the patient’s tumor for selection of the appropriate drug combination.

Similar articles

Cited by

References

    1. Pammolli F, Magazzini L, Riccaboni M. The productivity crisis in pharmaceutical R&D. Nat Rev Drug Discov. 2011;10(6):428–38. doi: 10.1038/nrd3405. - DOI - PubMed
    1. Hopkins AL. Network pharmacology: the next paradigm in drug discovery. Nat Chem Biol. 2008;4(11):682–90. doi: 10.1038/nchembio.118. - DOI - PubMed
    1. Sams-Dodd F. Target-based drug discovery: is something wrong? Drug Discov Today. 2005;10(2):139–47. doi: 10.1016/S1359-6446(04)03316-1. - DOI - PubMed
    1. Heineke J, Molkentin JD. Regulation of cardiac hypertrophy by intracellular signalling pathways. Nat Rev Mol Cell Biol. 2006;7(8):589–600. doi: 10.1038/nrm1983. - DOI - PubMed
    1. Breitkreutz D, Hlatky L, Rietman E, Tuszynski JA. Molecular signaling network complexity is correlated with cancer patient survivability. Proc Natl Acad Sci U S A. 2012;109(23):9209–12. doi: 10.1073/pnas.1201416109. - DOI - PMC - PubMed

LinkOut - more resources