

Impacts of travel activity and urbanicity on exposures to ambient oxides of nitrogen and on exposure disparities
- PMID: 25741390
- PMCID: PMC4338342
- DOI: 10.1007/s11869-014-0275-6
Impacts of travel activity and urbanicity on exposures to ambient oxides of nitrogen and on exposure disparities
Abstract
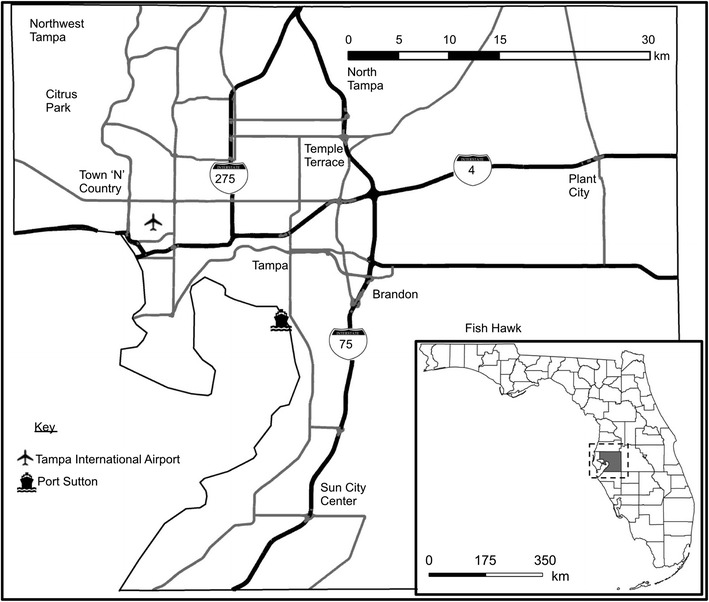
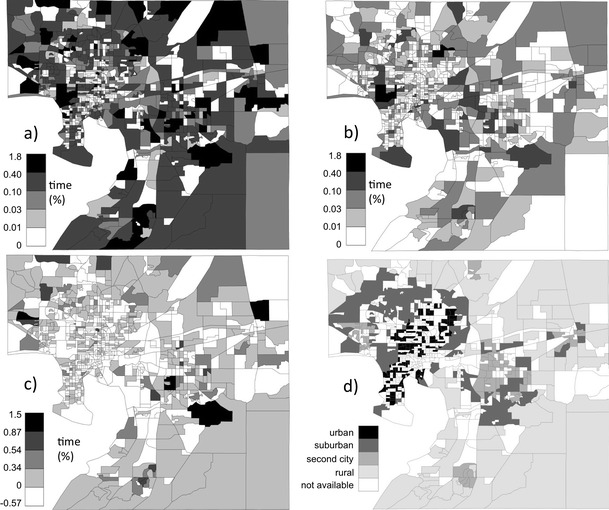
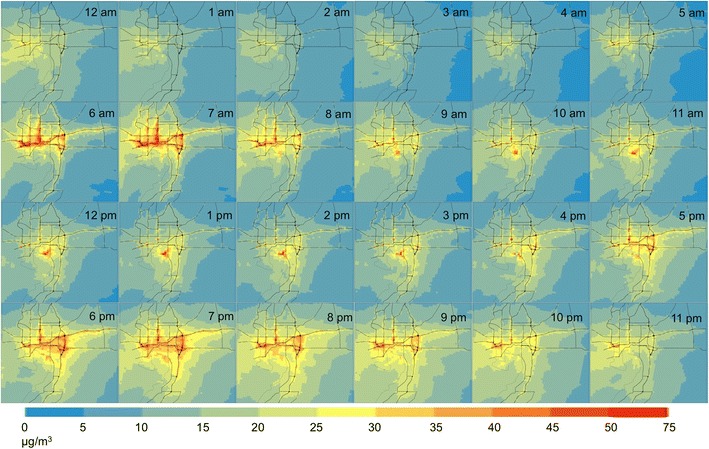
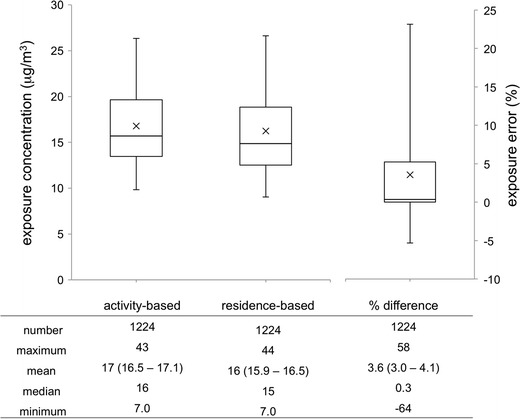
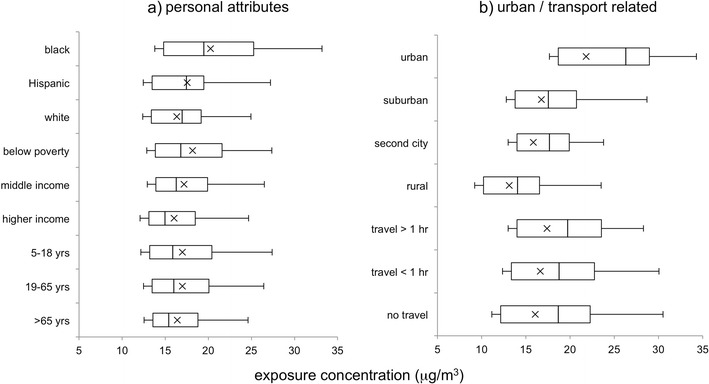
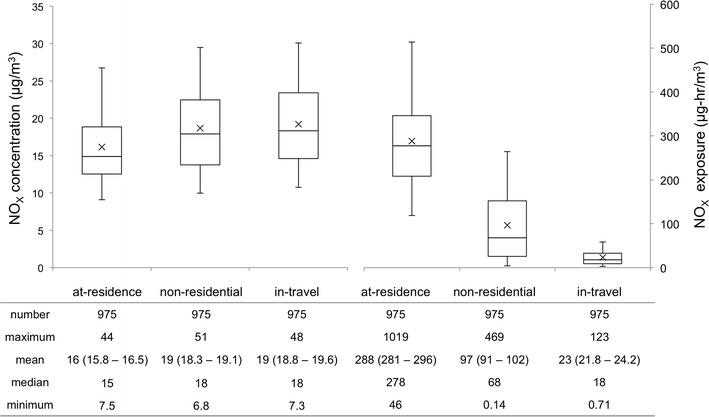
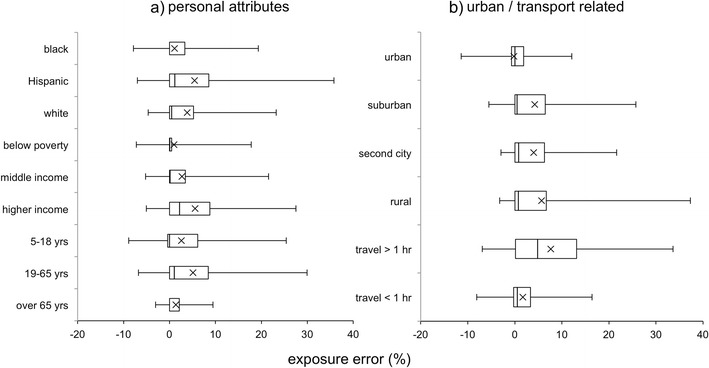
Daily exposures to ambient oxides of nitrogen were estimated here for residents of Hillsborough County, FL. The 2009 National Household Travel Survey provided geocoded data on fixed activity locations during each person-day sampled. Routes between activity locations were calculated from transportation network data, assuming the quickest travel path. To estimate daily exposure concentrations for each person-day, the exposure locations were matched with diurnally and spatially varying ambient pollutant concentrations derived from CALPUFF dispersion model results. The social distribution of exposures was analyzed by comparing frequency distributions of grouped daily exposure concentrations and by regression modeling. To investigate exposure error, the activity-based exposure estimates were also compared with estimates derived using residence location alone. The mean daily activity-based exposure concentration for the study sample was 17 μg/m3, with values for individual person-day records ranging from 7.0 to 43 μg/m3. The highest mean exposure concentrations were found for the following groups: black (20 μg/m3), below poverty (18 μg/m3), and urban residence location (22 μg/m3). Urban versus rural residence was associated with the largest increase in exposure concentration in the regression (8.3 μg/m3). Time in nonresidential activities, including travel, was associated with an increase of 0.2 μg/m3 per hour. Time spent travelling and at nonresidential locations contributed an average of 6 and 24 %, respectively, to the daily estimate. A mean error of 3.6 %, with range from -64 to 58 %, was found to result from using residence location alone. Exposure error was highest for those who travel most, but lowest for the sociodemographic subgroups with higher mean exposure concentrations (including blacks and those from below poverty households). This work indicates the importance of urbanicity to social disparities in activity-based air pollution exposures. It also suggests that exposure error due to using residence location may be smaller for more exposed groups.
Keywords: Environmental inequality; Exposure error; Human activity patterns; Traffic pollution; Urban form.
Figures
Similar articles
-
Effects of long-term exposure to traffic-related air pollution on respiratory and cardiovascular mortality in the Netherlands: the NLCS-AIR study.Res Rep Health Eff Inst. 2009 Mar;(139):5-71; discussion 73-89. Res Rep Health Eff Inst. 2009. PMID: 19554969
-
Effects of short-term exposure to air pollution on hospital admissions of young children for acute lower respiratory infections in Ho Chi Minh City, Vietnam.Res Rep Health Eff Inst. 2012 Jun;(169):5-72; discussion 73-83. Res Rep Health Eff Inst. 2012. PMID: 22849236
-
A population exposure model for particulate matter: case study results for PM(2.5) in Philadelphia, PA.J Expo Anal Environ Epidemiol. 2001 Nov-Dec;11(6):470-89. doi: 10.1038/sj.jea.7500188. J Expo Anal Environ Epidemiol. 2001. PMID: 11791164
-
Comparison of air pollution exposures in active vs. passive travel modes in European cities: A quantitative review.Environ Int. 2017 Feb;99:151-160. doi: 10.1016/j.envint.2016.12.023. Epub 2016 Dec 31. Environ Int. 2017. PMID: 28043651 Review.
-
Critical review of the human data on short-term nitrogen dioxide (NO2) exposures: evidence for NO2 no-effect levels.Crit Rev Toxicol. 2009;39(9):743-81. doi: 10.3109/10408440903294945. Crit Rev Toxicol. 2009. PMID: 19852560 Review.
Cited by
-
The Impact of Individual Mobility on Long-Term Exposure to Ambient PM2.5: Assessing Effect Modification by Travel Patterns and Spatial Variability of PM2.5.Int J Environ Res Public Health. 2021 Feb 23;18(4):2194. doi: 10.3390/ijerph18042194. Int J Environ Res Public Health. 2021. PMID: 33672290 Free PMC article.
-
Urban Form, Air Pollution, and Health.Curr Environ Health Rep. 2017 Dec;4(4):491-503. doi: 10.1007/s40572-017-0167-7. Curr Environ Health Rep. 2017. PMID: 29052114 Review.
-
Assessment of air pollution and air quality perception mismatch using mobility-based real-time exposure.PLoS One. 2024 Feb 27;19(2):e0294605. doi: 10.1371/journal.pone.0294605. eCollection 2024. PLoS One. 2024. PMID: 38412153 Free PMC article.
-
Enhancing Models and Measurements of Traffic-Related Air Pollutants for Health Studies Using Dispersion Modeling and Bayesian Data Fusion.Res Rep Health Eff Inst. 2020 Mar;2020(202):1-63. Res Rep Health Eff Inst. 2020. PMID: 32239871 Free PMC article.
-
Contribution of the in-vehicle microenvironment to individual ambient-source nitrogen dioxide exposure: the Multi-Ethnic Study of Atherosclerosis and Air Pollution.J Expo Sci Environ Epidemiol. 2018 Jun;28(4):371-380. doi: 10.1038/s41370-018-0025-1. Epub 2018 Mar 6. J Expo Sci Environ Epidemiol. 2018. PMID: 29511286 Free PMC article.
References
-
- American Lung Association (2011) State of the air 2011. Washington, DC. Accessed December 2, 2013. Available from http://stateoftheair.org/2011/assets/SOTA2011.pdf
-
- Anderson HR, Favarato G, Atkinson RW. Long-term exposure to air pollution and the incidence of asthma: meta-analysis of cohort studies. Air Qual Atmos Health. 2013;6:47–56. doi: 10.1007/s11869-011-0144-5. - DOI
-
- Beckx C, IntPanis L, Uljee I, Arentze T, Janssens D, Wets G. Disaggregation of nation-wide dynamic population exposure estimates in The Netherlands: applications of activity-based transport models. Atmos Environ. 2009;43:5454–5462. doi: 10.1016/j.atmosenv.2009.07.035. - DOI
LinkOut - more resources
Full Text Sources
Other Literature Sources