. 2015 Mar 5;6(3):e1669.
doi: 10.1038/cddis.2015.43.

T-cell intracellular antigens function as tumor suppressor genes

Affiliations

T-cell intracellular antigens function as tumor suppressor genes

C Sánchez-Jiménez et al. Cell Death Dis. .

Abstract

Knockdown of T-cell intracellular antigens TIA1 and TIAR in transformed cells triggers cell proliferation and tumor growth. Using a tetracycline-inducible system, we report here that an increased expression of TIA1 or TIAR in 293 cells results in reduced rates of cell proliferation. Ectopic expression of these proteins abolish endogenous TIA1 and TIAR levels via the regulation of splicing of their pre-mRNAs, and partially represses global translation in a phospho-eukaryotic initiation factor 2 alpha-dependent manner. This is accompanied by cell cycle arrest at G1/S and cell death through caspase-dependent apoptosis and autophagy. Genome-wide profiling illustrates a selective upregulation of p53 signaling pathway-related genes. Nude mice injected with doxycycline-inducible cells expressing TIA1 or TIAR retard, or even inhibit, growth of xenotumors. Remarkably, low expressions of TIA1 and TIAR correlate with poor prognosis in patients with lung squamous cell carcinoma. These findings strongly support the concept that TIA proteins act as tumor suppressor genes.


Figures

Figure 1
Figure 1
Expression patterns of GFP-tagged proteins in tetracycline-induced FT293 cells. (a) Fluorescence images from FT293 cells expressing indicated proteins by confocal microcopy. The middle panels are the sum of GFP and To-Pro-3 images (Merge). Phase contrast photographs are also shown. Scale bars represent 20 μm. The fluorescence levels were analyzed by flow cytometry (bd) Time-course and expression profiles of ectopic and endogenous TIA1, TIAR and HuR proteins in indicated FT293 cells by immunoblotting
Figure 2
Figure 2
Expression of TIA proteins suppresses cell proliferation leading to cell cycle arrest at the G1/S phase. (a) FT293 cells expressing indicated proteins were counted on the days indicated for 4 days (b) Cells grown for 4 days were monitored by methyl thiazolyl tetrazolium (MTT) assay. The represented values were normalized and expressed relative to control (c), whose value was fixed arbitrarily to 1 (c) Nascent translation rates of total proteins were determined by incubation of above FT293 cells in the presence of 35S-methionine/-cysteine (Met/Cys) mix. The relative translational rates were estimated as ratio 35S-Met/Cys label versus Coomassie Blue staining. The values are indicated as percentages referred to control (c) (d) Analysis of the phosphorylation status of Ser 51 on eukaryotic initiation factor 2 alpha subunit (eIF2α) (e) Analysis of cell cycle phases by flow cytometry (f) FT293 cells expressing TIA proteins showed cell cycle arrest at the G1/S phase. The indicated FT293 cells were synchronized at G1/S by hydroxyurea blockage for 30 h, released and quantified at 16 h post release. In all cases, the represented values are means±S.E.M. (n=3–6; *P<0.05; **P<0.01; ***P<0.001)
Figure 3
Figure 3
Expression of TIA proteins leads to slow cell death mediated by caspase-dependent apoptosis and late autophagy. (a) Analysis of cellular morphology and viability of FT293 cells for 3–7 days. Scale bars represent 20 μm (b) Quantification of cell death rates at 4 and 7 days. The represented values are means±S.E.M. (n=3–5; *P<0.01; **P<0.001) (c) Western blot analysis of cell death markers at 4 and 7 days (d) Cell death by apoptosis occurs in a caspase-dependent way. FT293 cells were grown for 4 days and then treated for 4 days further with DMSO or caspase inhibitor Z-VAD-FMK. The represented values are means±S.E.M. (n=2; *P<0.01)
Figure 4
Figure 4
Characterization of the transcriptomes associated to FT293 cells expressing TIA1, TIAR or HuR proteins. (a) MA plot representation of the distribution of up- (spots in red) and downregulated (spots in green) RNAs (−2 ⩾ fold-change ⩽ 2; FDR<0.05) in TIA1- or TIAR- versus HuR-expressing FT293 cells, respectively (b) Venn diagrams depicting the numbers of genes that were upregulated (red) or downregulated (green) as well as shared between both categories (c and d) Top-five categories of biological processes and pathways in TIA1- or TIAR- versus HuR-expressing FT293 cells, respectively. Histograms represent the numbers of up- (red) and downregulated (green) genes using the GO and the KEGG pathway databases (P<0.05), respectively (e) Quantification of relative expression levels of indicated mRNAs by qPCR. The represented values were normalized and expressed relative to GAPDH. The represented values are means±S.E.M. (n=2; *P<0.05; **P<0.01; ***P<0.001) (f and g) Western blot analysis from indicated FT293 cells at 0, 3 and 7 post-induction days (f) and FT293 cells either control or irradiated with ultraviolet light (g)
Figure 5
Figure 5
Expression of TIA proteins alters transcription, mRNA turnover, translation and protein stability. (a) DNA transcription was inhibited by the addition of Act D (5 μg/ml) to the indicated FT293 cells. Steady-state mRNA levels were quantified by qPCR and represented at indicated times. The represented values corresponding to half-lives (t1/2 in the hour range) of mRNAs calculated from semilogaritmic plots to the first-order rate kinetics of the decay of mRNA. Validation of relative expression levels for selected proteins by western blotting (b) Translation elongation was inhibited by the addition of CHX (50 μg/ml) to the indicated FT293 cells. Steady-state protein levels were analyzed by immunoblot and represented at indicated times. The resulting value corresponding to half-life (t1/2 in the min range) of CDKN1A protein was calculated as before (c) The relative expression levels of CDKN1A mRNA and protein in indicated FT293 cells were determined by qPCR and immunoblotting (d) Polysome profiling using sucrose gradients from indicated FT293 cells. The quality of polysomal preparations was verified by quantification of optical density at 254 nm and electrophoresis analysis in agarose gels of RNA content in each fraction. The fractions from top to bottom with increased density (15–40% sucrose) are identified as free-monosomes (fractions 1–5; identified as RNP, 40S, 60S and 80S), light polysomes (fractions 6–9) and heavy polysomes (fractions 10–12). Ribosomal 18S and 28S bands and initial input (I) are also shown. Distribution of CDKN1A and GAPDH mRNAs across sucrose gradients was verified by semiquantitative RT-PCR analysis
Figure 6
Figure 6
Expression of TIA proteins blocks in vivo tumor growth. (ac) Workflow (a): control FT293 cells and TIA1- (b) or TIAR- (c) expressing FT293 cells (5 × 10⁶) were injected s.c. into the hind legs of female nude mice. Five to six mice were used for each cell pair. These cells were allowed to form tumors for 3–7 weeks before introduction of Dox into drinking water. Animals were killed 8 weeks after initial tumor palpation. Progression of tumor size after inoculation and Dox treatment was plotted. Tumor size is shown as mean±S.E.M. (n=5–6; *P<0.05). Representative photographs are shown for mice cohorts and tumors arising in the same mice. Expression of GFP-tagged proteins into xenograft tumors was verified by immunoblotting (d) Histological sections and immunohistochemical characterization of above xenograft tumors. Sections were stained with HE and other were immunostained with anti-MIB1/Ki67 (as proliferation index), anti-caspase-3 (as apoptosis indicator) and anti-BCL-2 (as survival indicator) antibodies. Scale bar represents 25 μm. The number of stained cells as percentage in tumor cuts was quantified in at least 10 different cellular fields and represented values are the mean±S.E.M. (n=10; **P<0.001) (e and f) Workflow (e): control FT293 cells and TIAR- expressing FT293 cells (5 × 10⁶) were injected as before. These cells were allowed to form tumors for 1 week before introduction of Dox into drinking water. Animals were killed 7 weeks after inoculation (f) Progression of tumor size after inoculation and Dox treatment was plotted. Tumor size is shown as the mean±S.E.M. (n=5; *P<0.05). Representative photographs are shown for mice cohort and tumors arising in the same mice
Figure 7
Figure 7
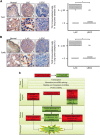
Downregulation of TIA proteins in human LSCC. (A and B) Quantification of relative expression levels of TIA1 and TIAR proteins in normal and tumor biopsies of lung cancer patients. Reduced lung TIA1 and TIAR immunoreactivity in LSCC tumors compared with non-tumor tissues (Normal) and LAC. Lung sections of patients were immunohistochemically stained with anti-TIA1 (a) or anti-TIAR (b) antibodies. Representative images of non-tumor (Normal) and lung tumor (LAC and LSCC) tissues are shown. Scale bars represent: 50 μm (a and b), 150 μm (c and e), 10 μm (d) and 50 μm (f), in each TIA1 (a) and TIAR (b) panels, respectively. Diagrams show values of the relatives percentages of TIA1 (a) or TIAR (b) immnunohistochemical staining cells in LAC and LSCC samples. Lung samples were provided by 74 lung cancer patients: 55 LAC and 19 LSCC. Statistical significance was determined from nonparametric testing (Mann–Whitney U-test, *P<0.0001) (C) A working model summarizing the molecular and cellular events linked to the ectopic expression of TIA proteins

Similar articles

Cited by

References

    1. Tian Q, Streuli M, Saito H, Schlossman SF, Anderson P. A polyadenylate binding protein localized to the granules of cytolytic lymphocytes induces DNA fragmentation in target cells. Cell. 1991;67:629–639. - PubMed
    1. Kawakami A, Tian Q, Duan X, Streuli M, Schlossman SF, Anderson P. Identification and functional characterization of a TIA-1-related nucleolysin. Proc Natl Acad Sci USA. 1992;89:8681–8685. - PMC - PubMed
    1. Ray D, Kazan H, Cook KB, Weirauch MT, Najafabadi HS, Li X, et al. A compendium of RNA-binding motifs for decoding gene regulation. Nature. 2013;499:172–177. - PMC - PubMed
    1. Suswam EA, Li YY, Mahtani H, King PH. Novel DNA-binding properties of the RNA-binding protein TIAR. Nucleic Acids Res. 2005;33:4507–4518. - PMC - PubMed
    1. McAlinden A, Liang L, Mukudai Y, Imamura T, Sandell LJ. Nuclear protein TIA1 regulates COL2A1 alternative splicing and interacts with precursor mRNA and genomic DNA. J Biol Chem. 2007;282:24444–24454. - PubMed

Publication types

MeSH terms