. 2015 Mar 4;85(5):942-58.
doi: 10.1016/j.neuron.2015.02.022.

Transgenic mice for intersectional targeting of neural sensors and effectors with high specificity and performance

Affiliations

Transgenic mice for intersectional targeting of neural sensors and effectors with high specificity and performance

Linda Madisen et al. Neuron. .

Abstract

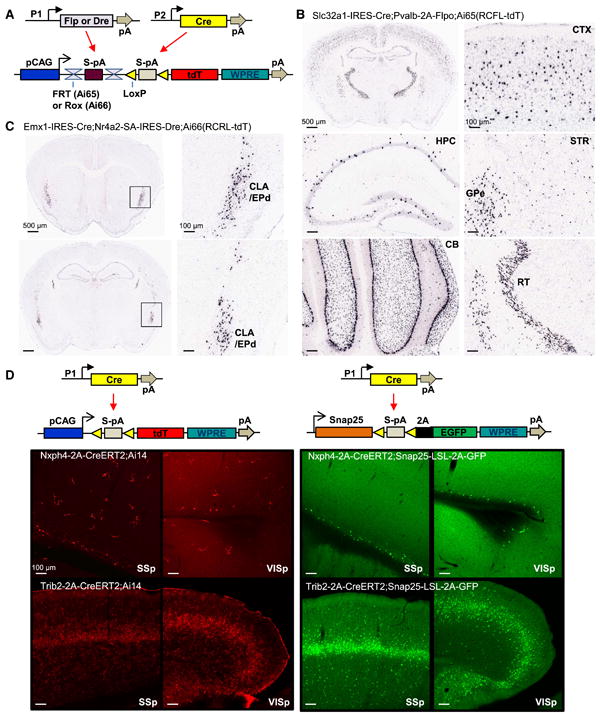
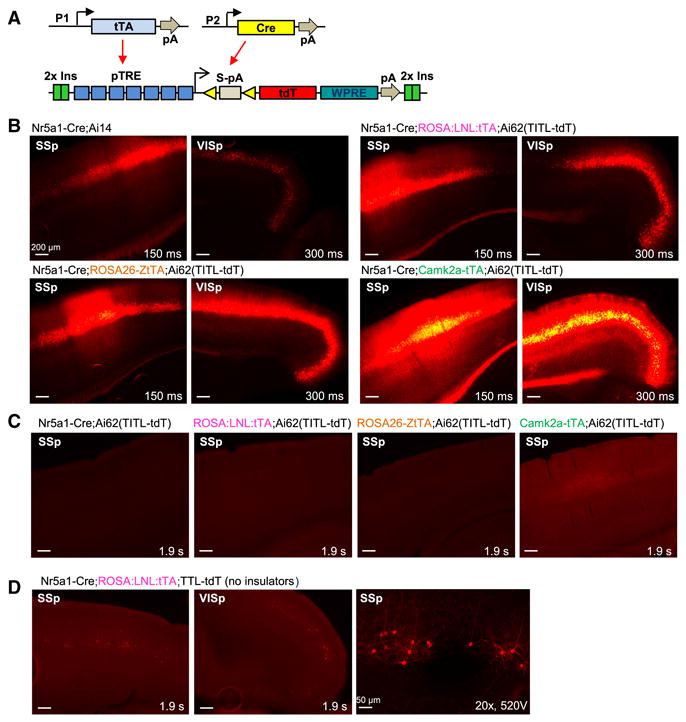
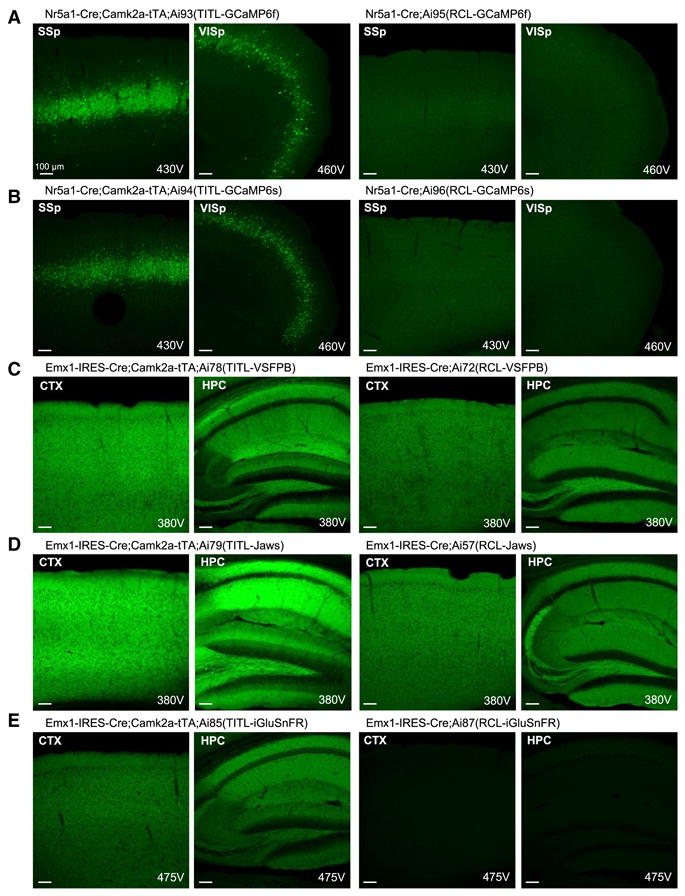
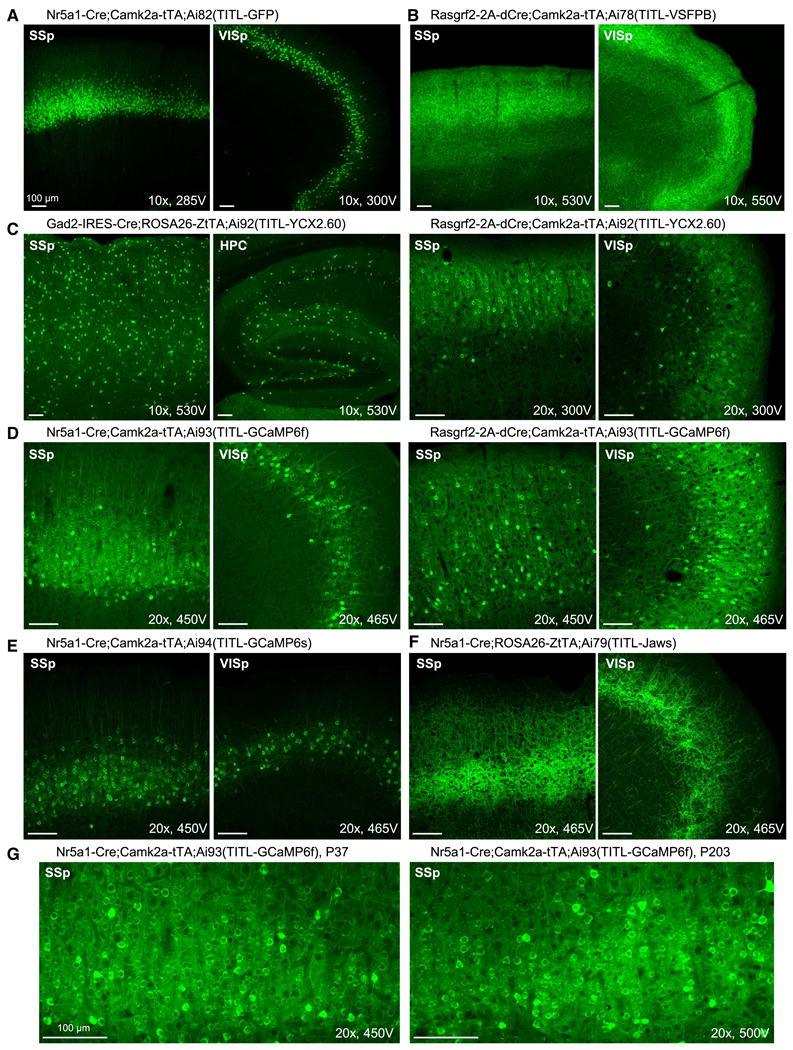
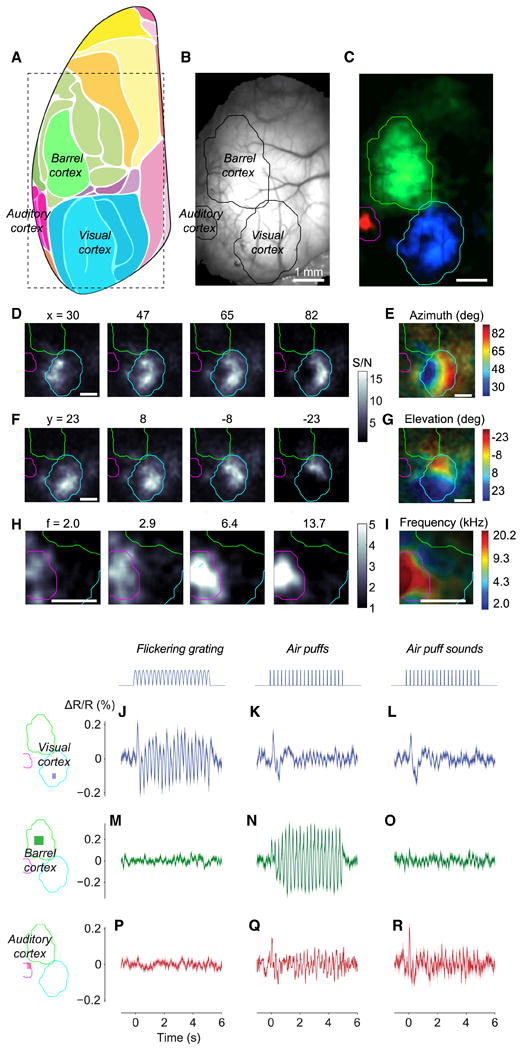
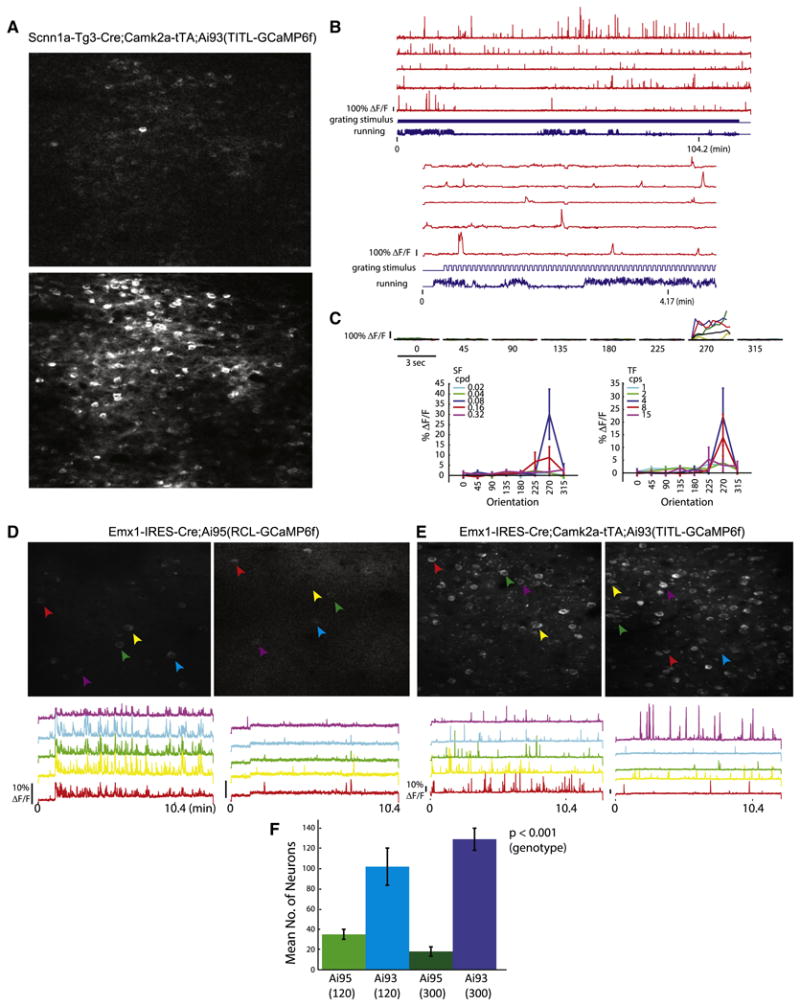
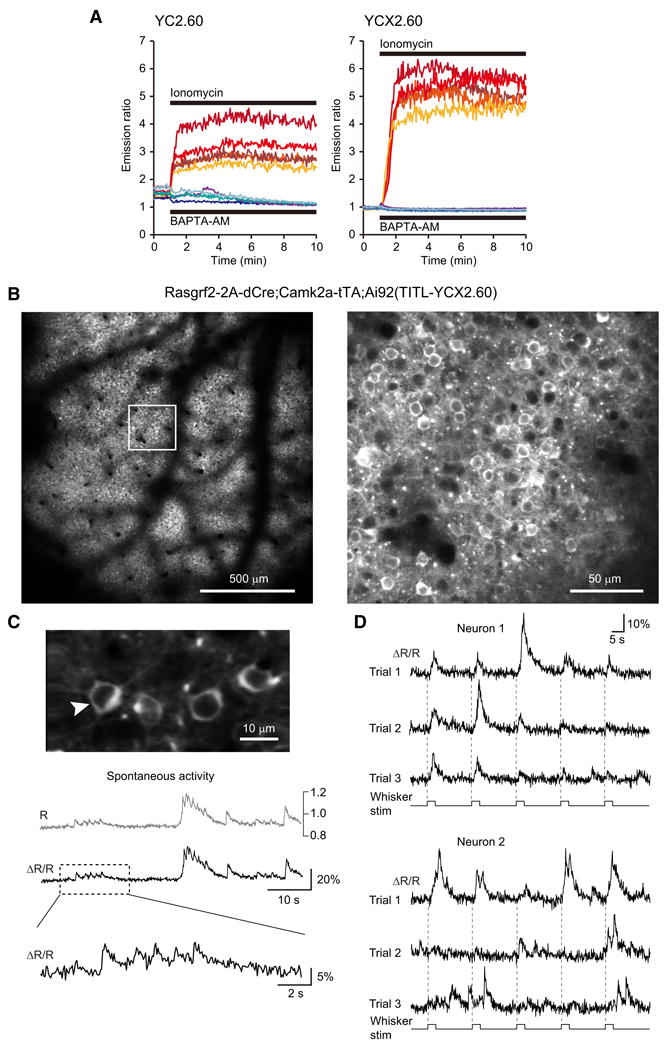
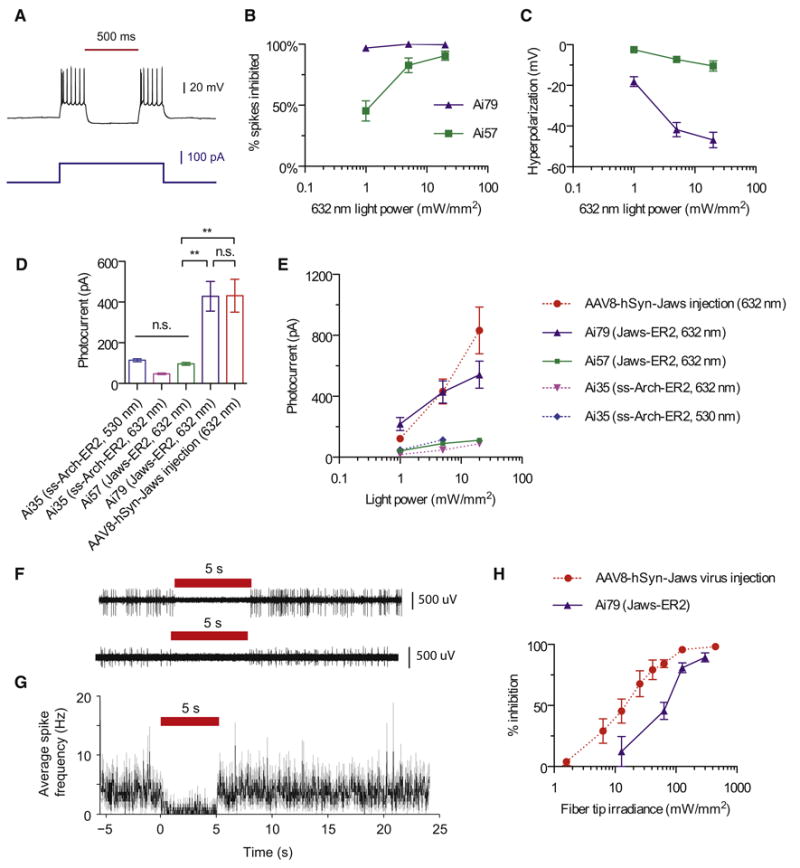
An increasingly powerful approach for studying brain circuits relies on targeting genetically encoded sensors and effectors to specific cell types. However, current approaches for this are still limited in functionality and specificity. Here we utilize several intersectional strategies to generate multiple transgenic mouse lines expressing high levels of novel genetic tools with high specificity. We developed driver and double reporter mouse lines and viral vectors using the Cre/Flp and Cre/Dre double recombinase systems and established a new, retargetable genomic locus, TIGRE, which allowed the generation of a large set of Cre/tTA-dependent reporter lines expressing fluorescent proteins, genetically encoded calcium, voltage, or glutamate indicators, and optogenetic effectors, all at substantially higher levels than before. High functionality was shown in example mouse lines for GCaMP6, YCX2.60, VSFP Butterfly 1.2, and Jaws. These novel transgenic lines greatly expand the ability to monitor and manipulate neuronal activities with increased specificity.


Conflict of interest statement

The authors declare no conflicts of interest.

Figures

Figure 1
Figure 1
Intersectional strategies using dual recombinases or Cre regulation of a direct neuronally-restricted reporter. (A) Schematic diagram of intersectional control by either Cre/Flp or Cre/Dre recombinases, driven by different promoters (P1 or P2), on a doubly regulated reporter line: the Cre and Flp-dependent Ai65(RCFL-tdT), or the Cre and Dre-dependent Ai66(RCRL-tdT). (B) ISH images of restricted tdTomato expression in Slc32a1+/Pvalb+ GABAergic neurons in the Slc32a1-IRES-Cre;Pvalb-2A-Flpo;Ai65(RCFL-tdT) mouse. CTX, cortex. HPC, hippocampus. STR, striatum. GPe, globus pallidus, external segment. CB, cerebellum. RT, reticular nucleus of the thalamus. (C) ISH images of restricted tdTomato expression in Emx1+/Nr4a2+ neurons in the claustrum (CLA) and endopiriform nucleus dorsal part (EPd) in the Emx1-IRES-Cre;Nr4a2-SA-IRES-Dre;Ai66(RCRL-tdT) mouse. (D) Direct neuronally-restricted reporter gene expression by targeting Cre-dependent reporter gene to the pan-neuronal Snap25 gene locus. TdTomato expression in cortex in both neuronal and non-neuronal cells of Nxph4-2A-CreERT2;Ai14 and Trib2-2A-CreERT2;Ai14 mice (left panels) compared with neuronally-specific EGFP expression in Nxph4-2A-CreERT2;Snap25-LSL-2A-GFP and Trib2-2A-CreERT2;Snap25-LSL-2A-GFP mice (right panels). SSp, primary somatosensory cortex. VISp, primary visual cortex. (See also Figures S1-S4.)
Figure 2
Figure 2
Cre and tTA dependent intersectional strategy at the TIGRE locus produces tightly regulated and high-level expression. (A) Schematic diagram of intersectional control by Cre and tTA, driven by different promoters (P1 or P2), on a double reporter line based in the TIGRE locus, Ai62(TITL-tdT). (B) Comparison of tdTomato fluorescence in 4 transgenic mouse lines carrying either Ai14 or Ai62 reporter alleles. (C) No detectable tdTomato expression in the Cre+/tTA- control Nr5a1-Cre;Ai62(TITL-tdT), or in Cre-/tTA+ controls ROSA:LNL:tTA;Ai62(TITL-tdT) and ROSA26-ZtTA;Ai62(TITL-tdT). Very weak tdTomato fluorescence was seen in the barrel cortex and hippocampus of Camk2a-tTA;Ai62(TITL-tdT) control mice (Cre-/tTA+). (D) Poor tdTomato expression in similar triple Tg mice with a TIGRE reporter (TTL-tdT) that lacks chromatin insulators (compare to B). Right, a higher-magnification confocal image of somatosensory cortex shows that the sparsely labeled cells are layer 4 neurons. For B-D, exposure time for each epifluorescence image is shown for comparison. (See also Figures S4-S6.)
Figure 3
Figure 3
TIGRE reporter lines have higher-level transgene expression than Rosa reporter lines in multiple direct comparisons. Native fluorescence in each pair of lines was compared by confocal microscopy using identical imaging parameters. All images were taken under a 10× objective using 10% laser power, and the PMT gain (in voltage) is indicated on each image. Mouse names are shown above each set of images taken from the same mouse. Comparisons are shown for (A) GCaMP6f, (B) GCaMP6s, (C) VSFP-Butterfly 1.2, (D) Jaws-GFP-ER2, and (E) iGluSnFR. Ai57(RCL-Jaws) was created by crossing Ai57(RCFL-Jaws) with a Flp-deleter mouse, FLPeR, to delete the FSF cassette. (See also Figure S1.)
Figure 4
Figure 4
Strong transgene expression in all TIGRE-based reporter lines, driven by a variety of Cre lines combined with Camk2a-tTA or ROSA26-ZtTA. Confocal images of native fluorescence are shown. All images were taken under a 10× or 20× objective using 10% laser power, and the PMT gain (in voltage) is indicated on each image for comparison. (A) Very bright cytoplasmic GFP labeling of cortical layer 4 neurons in Nr5a1-Cre;Camk2a-tTA;Ai82(TITL-GFP) mouse. (B) Bright membrane VSFP-Butterfly 1.2 labeling of cortical layer 2/3 neurons in Rasgrf2-2A-dCre;Camk2a-tTA;Ai78(TITL-VSFPB) mouse. (C) Very bright cytoplasmic YCX2.60 labeling of interneurons in Gad2-IRES-Cre;ROSA26-ZtTA;Ai92(TITL-YCX2.60) mouse, and of cortical layer 2/3 neurons in Rasgrf2-2A-dCre;Camk2a-tTA;Ai92(TITL-YCX2.60) mouse. (D) Bright cytoplasmic GCaMP6f labeling of cortical layer 4 neurons in Nr5a1-Cre;Camk2a-tTA;Ai93(TITL-GCaMP6f) mouse, and of cortical layer 2/3 neurons in Rasgrf2-2A-dCre;Camk2a-tTA;Ai93(TITL-GCaMP6f) mouse. (E) Bright cytoplasmic GCaMP6s labeling of cortical layer 4 neurons in Nr5a1-Cre;Camk2a-tTA;Ai94(TITL-GCaMP6s) mouse. (F) Bright membrane Jaws-GFP-ER2 labeling of cortical layer 4 neurons in Nr5a1-Cre;Rosa26-ZtTA;Ai79(TITL-Jaws) mouse. (G) Comparison of young and old Ai93 mice shows no or little nuclear invasion of transgene proteins with time. The ages (postnatal days) at which the mice were sacrificed are shown. (See also Figure S7.)
Figure 5
Figure 5
Wide-field imaging of sensory cortices of Ai78 mice expressing VSFP-Butterfly 1.2 in cortical layer 2/3 excitatory neurons. (A) Diagram showing mouse cortical regions observed at an angle of 30° laterally with a vertical optical axis. Adopted and modified from (Kirkcaldie, 2012). The rectangle shows the approximate extent of our imaging area. (B) Fluorescence of mCitrine imaged through the thinned skull. (C) Maps of VSFP signals (acceptor-donor ratio) to auditory (red), somatosensory (green), and visual (blue) stimuli. Sensory regions are mapped as 4 Hz amplitude in response to 4 Hz train of tones, 4 Hz train of air puffs directed to whole whisker field, and 2 Hz flickering visual stimulus. Response amplitude was divided for each modality by amplitude measured in the absence of stimulation. The three maps came from experiments performed on different days, and the resulting maps were aligned based on the blood vessel pattern. Overlaid contour lines show the outlines of visual cortex, barrel cortex, and auditory cortex. (D) Amplitude maps for 4 Hz responses to bars reversing in contrast at 2 Hz, presented at different horizontal positions (azimuths). (E) The resulting maps of azimuth preference (retinotopy). (F-G) Same as D and E for stimulus elevation (vertical position). (H) Amplitude maps for 6 Hz responses to tones in 6 Hz trains, for different tone frequencies. (I) The resulting maps of tone frequency preference (tonotopy). (J-R) Unisensory and multisensory signals in visual cortex (J-L), barrel cortex (M-O) and auditory cortex (P-R). Stimuli were contrast-reversing visual gratings (J, M, P), air puffs delivered to the whiskers (K, N, Q), and (sham) air puffs delivered away from the whiskers to replicate the sound but not the somatosensory stimulation (L, O, R). ΔR/R is calculated after normalization using data during the prestimulus period, and high-pass filtering above 0.5 Hz. (See also Figure S8.)
Figure 6
Figure 6
In vivo two-photon imaging of calcium signals in GCaMP6f reporter mice. (A-C) Calcium imaging in cortical layer 4 of Scnn1a-Tg3-Cre;Camk2a-tTA;Ai93(TITL-GCaMP6f) mice. (A) Images of baseline fluorescence with a single active cell (upper panel) and Z projection (time series) of the same field of view showing all active cells (lower panel). (B) Raw traces of 5 example neurons imaged during stimulus presentation. Upper panel shows the duration of the entire experiment. Lower panel shows the same 5 cells over a shorter time scale. The bottom cell trace is the cell analyzed for tuning properties shown in C. (C) Visually evoked responses of an example cell. Top, Peri-Stimulus-Time-Histogram (PSTH) of the cell's response at each stimulus orientation at optimal SF and TF. Colored lines represent individual trials and the black line represents the mean. Bottom left, mean response at each SF (averaged over all TFs) as a function of orientation. Bottom right, mean response at each TF (averaged over all SFs) as a function of orientation. (D-F) Comparison of Emx1-IRES-Cre;Ai95(RCL-GCaMP6f) and Emx1-IRES-Cre;Camk2a-tTA;Ai93(TITL-GCaMP6f) mice at two imaging depths, 120 μm and 300 μm below the pia, corresponding to cortical layers 2/3 and 4 respectively. (D) Z projection of 2-photon acquisition frames 120 μm (left) and 300 μm (right) below the pia of Ai95 mice. Raw traces of neural activity during ∼10 minutes of visual stimulus presentation for 5 representative cells are shown below each image panel. (E) Same as D for Ai93 mice. (F) Mean number of cells from which activity could be observed during a 10-min imaging period at 120 μm and 300 μm depths within a 250 × 150 μm imaging area. All values represent mean ± SEM. (See also Movies S1-S4).
Figure 7
Figure 7
Calcium measurements with yellow cameleon YCX2.60. (A) Responses in individual HeLa cells to ionomycin applied to saturate yellow cameleons (YCs) with calcium (n = 5), and to BAPTA-AM applied to deplete YCs of calcium (n = 4). The dynamic range of YCX2.60 is twice as large as that of YC2.60 (Rmax/Rmin = 6.20 vs 3.17). The apparent dissociation constants of YC2.60 and YCX2.60 for calcium were calculated as 80 nM and 220 nM, respectively (Y.N. and A.M., unpublished results). (B-D) In vivo two-photon imaging of calcium signals in Rasgrf2-2A-dCre;Camk2a-tTA;Ai92(TITL-YCX2.60) mice. (B) Visualization of the uniform expression in layer 2/3 at 190-μm depth within the cranial window one week after TMP induction (field of view size 1.7 × 1.7 mm). Note the shadows from surface blood vessels. The image on the right is a magnified view of the boxed area in the left image, showing neuronal somata labeled with YCX2.60. (C) Representative 60-s example of spontaneous activity in the neuron marked with an arrow. Raw, unfiltered calcium transients are expressed once as YFP:CFP ratio R, which in principle can be calibrated in terms of absolute calcium concentration, or as relative percentage change of the ratio R (ΔR/R). The expanded view of the trace segment in the box highlights fast calcium transients presumably evoked by few or single action potentials. (D) Evoked activity in two example neurons following whisker stimulation. The principal whisker was repeatedly stimulated at 10 Hz for 2 seconds (onsets indicated with dashed lines). YCX2.60 AR/R traces are shown for two example layer 2/3 neuron for three trials, each comprising five stimulation periods. Note responses at stimulus onset, during stimulation, and at stimulus offset as well as spontaneous activity in between. Large calcium transients likely correspond to bursts of action potentials whereas small-amplitude transients may reflect occurrence of only few or single action potentials.
Figure 8
Figure 8
Optogenetic inhibition of neural activity in reporter lines expressing Jaws. (A) Representative current-clamp recording of a Jaws-expressing neuron from Ai79 undergoing optically evoked (632 nm, 5 mW/mm2) hyperpolarization in an acute cortical slice. (B) Comparison of red light induced inhibition of electrically evoked spiking in slices from Ai79 and Ai57 mice. Spiking was induced by a current injection of 1.5× the rheobase. (C) Comparison of red light induced hyperpolarization in slices from Ai79 and Ai57 mice. (D) Comparison of red or green light (632 or 530 nm, 5 mW/mm2) induced photocurrents in slices from Ai79, Ai57, Ai35 and AAV-Jaws virus injected mice. (E) Comparison of light induced photocurrents in slices from Ai79, Ai57, Ai35 and AAV-Jaws virus injected mice across different light intensities for red or green light. (F-G) Representative extracellular recordings (F) in awake Ai79 mice demonstrate the in vivo inhibition of spontaneous firing activities (G) of Jaws-expressing neurons. (H) Comparison of in vivo inhibition of spontaneous firing activities over a range of red light intensities between Ai79 and AAV-Jaws injected mice. All values represent mean ± SEM. ** p < 0.01, n.s. not significant. (See also Figure S9.)

Comment in

References

    1. Ackman JB, Burbridge TJ, Crair MC. Retinal waves coordinate patterned activity throughout the developing visual system. Nature. 2012;490:219–225. - PMC - PubMed
    1. Akemann W, Mutoh H, Perron A, Park YK, Iwamoto Y, Knopfel T. Imaging neural circuit dynamics with a voltage-sensitive fluorescent protein. J Neurophysiol. 2012;108:2323–2337. - PubMed
    1. Anastassiadis K, Fu J, Patsch C, Hu S, Weidlich S, Duerschke K, Buchholz F, Edenhofer F, Stewart AF. Dre recombinase, like Cre, is a highly efficient site-specific recombinase in E. coli, mammalian cells and mice. Dis Models Mech. 2009;2:508–515. - PubMed
    1. Andermann ML, Kerlin AM, Roumis DK, Glickfeld LL, Reid RC. Functional specialization of mouse higher visual cortical areas. Neuron. 2011;72:1025–1039. - PMC - PubMed
    1. Arenkiel BR, Peca J, Davison IG, Feliciano C, Deisseroth K, Augustine GJ, Ehlers MD, Feng G. In vivo light-induced activation of neural circuitry in transgenic mice expressing channelrhodopsin-2. Neuron. 2007;54:205–218. - PMC - PubMed

Publication types