. 2015 Mar 4;85(5):1086-102.
doi: 10.1016/j.neuron.2015.02.006.

Neuromedin s-producing neurons act as essential pacemakers in the suprachiasmatic nucleus to couple clock neurons and dictate circadian rhythms

Affiliations

Neuromedin s-producing neurons act as essential pacemakers in the suprachiasmatic nucleus to couple clock neurons and dictate circadian rhythms

Ivan T Lee et al. Neuron. .

Abstract

Circadian behavior in mammals is orchestrated by neurons within the suprachiasmatic nucleus (SCN), yet the neuronal population necessary for the generation of timekeeping remains unknown. We show that a subset of SCN neurons expressing the neuropeptide neuromedin S (NMS) plays an essential role in the generation of daily rhythms in behavior. We demonstrate that lengthening period within Nms neurons is sufficient to lengthen period of the SCN and behavioral circadian rhythms. Conversely, mice without a functional molecular clock within Nms neurons lack synchronous molecular oscillations and coherent behavioral daily rhythms. Interestingly, we found that mice lacking Nms and its closely related paralog, Nmu, do not lose in vivo circadian rhythms. However, blocking vesicular transmission from Nms neurons with intact cell-autonomous clocks disrupts the timing mechanisms of the SCN, revealing that Nms neurons define a subpopulation of pacemakers that control SCN network synchrony and in vivo circadian rhythms through intercellular synaptic transmission.


Figures

Figure 1
Figure 1. Distribution of HA (NMS)-Expressing Neurons in the Nms-ClockΔ19 Mouse SCN
(A) Diagram showing the Tet-Off system and constructs used to generate the Nms-ClockΔ19 mice. The Nms promoter drives the bicistronic expression of iCre, which excises the loxP flanked stop codon of ROSA-STOP-tTA, allowing tTA to be expressed. tTA binds to the Tetracycline Response Element (TRE) in the absence of Dox but not in its presence, resulting in the transcriptional activation or repression of the HA-tagged tetO-ClockΔ19 transgene, respectively. (B) Double staining of HA (green) and NMS (red) on SCN sections of Nms-ClockΔ19 mice. Scale bars are 50 μm (top), 20 μm (middle), and 5 μm (bottom). Quantitative data are shown at the bottom. (C) Double staining of HA (green) and AVP (red) on SCN sections of Nms-ClockΔ19 mice. Scale bars are 50 μm (top) and 5 μm (bottom). Quantitative data are shown at the right. (D) Double staining of HA (green) and VIP (red) on SCN sections of Nms-ClockΔ19 mice. Scale bars same as (B). (E) Double staining of HA (green) and GRP (red) on SCN sections of Nms-ClockΔ19 mice. Scale bars same as (B). (F) Venn diagram displaying the overlap between HA (NMS), VIP, AVP, and GRP. HA (NMS) and Nissl cell numbers are from stereological counts listed in (F). The number of cells that overlap with NMS was extrapolated from the relative % of co-localization in Figure 1C to 1E based on the number of HA (NMS) neurons from stereological counts.
Figure 2
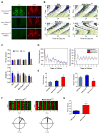
Figure 2. Reversible Overexpression of ClockΔ19 in Nms Neurons Lengthens Circadian Period
(A) Immunostaining of HA (green) on SCN sections of Nms-ClockΔ19 mice administered with water (top), 1 week of Dox (middle), and R26-ClockΔ19 mice given water (bottom). Immunostaining of AVP peptide (red) was performed as a staining control. The scale bar represents 100 μm. (B) Representative actograms of Nms-ClockΔ19 transgenic (bottom-right) and genetic controls (R26: top-left; R26-ClockΔ19: top-right; R26-Nms: bottom-left). All mice were initially placed in 12:12 LD for at least 7 days then transferred into DD, as indicated on the plot. Dox (10 μg/ml) water was administered during the intervals highlighted in yellow. Colored bars to the right of the actograms represent the days of analyses presented in (C). (C) Quantification of circadian activity in Nms-ClockΔ19 transgenic and genetic controls. A significantly longer freerunning period was observed in water-treated Nms-ClockΔ19 mice compared to all other groups (two-way ANOVA, *p< 0.05 by Tukey’s post-hoc test). Mean freerunning amplitude was not different among water- or Dox-treated mice across all genotypes (two-way ANOVA, p>0.05 by Tukey’s post-hoc test). Values are means ± SEM (R26, n=6; R26-Nms, n=6; R26-ClockΔ19, n=12; Nms-ClockΔ19, n=7). (D) Representative PER2::LUC bioluminescence records from the SCN of Nms-ClockΔ19;Luc mice and controls. Raw and baseline-subtracted plots are both displayed (R26-Nms: light blue trace; R26-ClockΔ19: dark-blue trace; Nms-ClockΔ19: red trace). (E) Quantification of average SCN period and amplitude in Nms-ClockΔ19 and control mice. Nms-ClockΔ19 SCN exhibit longer mean circadian period and lower circadian amplitude compared to R26-Nms and R26-ClockΔ19 SCN (one-way ANOVA, *p< 0.05 by Tukey’s post-hoc test). Values are means ± SEM (R26-Nms, n=9; R26-ClockΔ19, n=7; Nms-ClockΔ19, n=8). (F) Representative heatmap and Rayleigh plots of PER2::LUC oscillation in 50 neurons from the SCN of adult R26-ClockΔ19 and Nms-ClockΔ19 mice. In the heatmap, the red corresponds to peak bioluminescence and the green to trough. The length of the arrow in the Rayleigh plot represents the strength of synchronization. (G) Quantification of average circadian period of individual SCN neurons from R26-ClockΔ19 and Nms-ClockΔ19 mice (Student’s t test, *p<0.0001). Values are as means ± SD (R26-ClockΔ19, n=50; Nms-ClockΔ19, n=50).
Figure 3
Figure 3. Loss of Bmal1 in Nms Neurons Abolishes Behavioral Circadian Rhythms
(A) Double staining of YFP (green) and BMAL1 (red) on SCN sections of Nms-Bmal1fl/fl;YFP mice using anti-GFP and anti-BMAL1 antibodies, respectively. The scale bars are 50 μm (top) and 5 μm (bottom). Quantitative data are shown at the right. (B) Double staining of YFP (green) and BMAL1 protein (red) on SCN sections of Nms-iCre;YFP mice using anti-GFP and anti-BMAL1 antibodies, respectively. (C) Representative actograms of Nms-Bmal1fl/fl (bottom) along with Bmal1fl/fl (top-left) and Nms-Bmal1fl/+ mice (top-right). Colored bars represent the days of analyses presented in (D). (D) Quantification of circadian activity in Nms-Bmal1fl/fl, Bma11fl/fl, Nms-Bmal1fl/+ mice. Nms-Bmal1fl/fl exhibited no coherent rhythms (NR) and a low average amplitude in the circadian range compared to Bmal1fl/fl and Nms-Bmal1fl/+ control mice (one-way ANOVA, *P<0.05 by Tukey’s post-hoc test). Values are mean ± SEM (Bmal1fl/fl, n=7; Nms-Bmal1fl/+, n=6; Nms-Bmal1fl/fl, n=14).
Figure 4
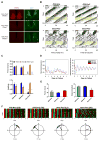
Figure 4. Reversible Overexpression of Per2 in Nms Neurons Causes the Loss of Behavioral Circadian Rhythms and Reduced Network Synchrony
(A) Immunostaining of the PER2 (red) on SCN sections of Nms-Per2 mice administered with water (top), 1 week of Dox (middle), and R26-Per2 mice given water (bottom). Immunostaining of AVP (green) is shown for staining control. The scale bar represents 100 μm. (B) Representative actograms of Nms-Per2 (bottom) and genetic controls (R26-Nms: top-left; R26-Per2: top-right). Dox (10 μg/ml) was administered during the intervals highlighted in yellow. Colored bars represent the days of analyses presented in (C). (C) Quantification of circadian activity in Nms-Per2 transgenic and genetic controls. Nms-Per2 mice administered with water displayed no coherent rhythms (NR) and a low average amplitude in the circadian spectrum (two-way ANOVA, *p< 0.05 by Tukey’s post-hoc test). No significant differences in mean circadian period or amplitude were found between Dox-administered Nms-Per2 mice and control mice (two-way ANOVA, p> 0.05 by Tukey’s post-hoc test). Values are mean ± SEM (R26-Nms, n=13; R26-Per2, n=9; Nms-Per2, n=13). (D) Representative PER2::LUC bioluminescence records from the SCN of Nms-Per2 and control mice maintained in DD. Raw and baseline-subtracted plots are both displayed (R26-Nms: light-blue trace; R26-Per2: dark blue trace; Nms-Per2: red trace). (E) Quantification of average SCN period and amplitude in Nms-Per2 and controls. Mean circadian period was not significantly different between genotypes (one-way ANOVA, p>0.05 by Tukey’s post-hoc test). The mean circadian amplitude of Nms-Per2 SCN is significantly lower compared to R26-Nms and R26-Per2 SCN (one-way ANOVA, *p< 0.05 by Tukey’s post-hoc test). Values are mean ± SEM (R26-Nms, n=6; R26-Per2, n=11; Nms-Per2, n=6). (F) Representative raster and Rayleigh plots of PER2::LUC oscillation in 50 individual neurons from the SCN of adult R26-Nms, R26-Per2, and Nms-Per2 mice. R26-Nms and R26-Per2 SCN were cultured from mice taken out of DD while Nms-Per2 SCN collected from mice maintained in LD and in DD are both displayed here. In the raster plot, the red corresponds to peak bioluminescence and the green to trough. The length of the arrow in the Rayleigh plot represents the strength of synchronization.
Figure 5
Figure 5. Nms−/−/Nmu−/− Mice Exhibit Normal Freerunning Circadian Rhythms
(A) Immunostaining of NMS (red) on SCN sections of C57BL/6J wild-type (WT) mice and Nms−/− mice. NMS immunoreactivity was not detected in Nms−/− mice. The scale bar is 50 μm. (B) Representative actograms of WT (top-left panel), Nms−/− (top-right), Nmu−/− (bottom-left), and Nms−/−/Nmu−/− mice (bottom-right). (C) Quantification of circadian activity in WT, Nms−/−, Nmu−/−, and Nms−/−/Nmu−/− mice. Mean freerunning periods and amplitudes were not significantly different between genotypes (one-way ANOVA, p>0.05 by Tukey’s post-hoc test). Total activity counts of Nmu−/− mice were significantly greater than that of Nms−/−/Nmu−/− mice (one-way ANOVA, *p<0.05 by Tukey’s post-hoc test). Values are mean ± SEM (WT, n=5; Nms−/−, n=8; Nmu−/−, n=5; Nms−/−Nmu−/−, n=13).
Figure 6
Figure 6. Reversible Overexpression of TeNT in Nms Neurons Abolishes Behavioral Circadian Rhythms
(A) Double staining of GFP (green) and NMS (red) on SCN sections of Nms-TeNT mice. Scale bars are 50 μm (top panels) and 5 μm (bottom panels). (B) Immunostaining of GFP (green) on SCN sections of Nms-TeNT mice administered with water (top), 1 week of Dox (middle), and R26-TeNT mice given water (bottom). Immunostaining of AVP (red) is shown as a staining control. The scale bar represents 100 μm. (C) Double staining of GFP (green) and VAMP2 (red). VAMP2 is intact in Nms synapses marked by synaptophysin-GFP (Syn-GFP) in R26-Nms;SynGFP mice (left panels) but undetectable in GFP-positive synapses of Nms-TeNT;SynGFP SCN (right panels). GFP can be observed in the cell body (site of synthesis) and in the synapses. Scales bars are 50 μm (top), 5 μm (middle), and 2 μm (bottom). (D) Representative actograms of Nms-TeNT transgenic (bottom panels) and genetic controls (R26-Nms: top-left; R26-TeNT: top-right; R26: not displayed). Dox (20 μg/ml) was administered during the intervals highlighted in yellow. Colored bars represent the days of analyses presented in (E). (E) Quantification of circadian activity in Nms-TeNT and genetic controls. Water-treated Nms-TeNT mice displayed no coherent rhythms (NR) in the circadian range and a low mean amplitude compared to other genotypes (two-way ANOVA, *p< 0.05 by Tukey’s post-hoc test). No significant differences in average circadian period or amplitude were found between Dox-administered Nms-TeNT mice and Dox-administered controls (two-way ANOVA, *p> 0.05 by Tukey’s post-hoc test). Values are mean ± SEM (R26, n=7; R26-Nms, n=5; R26-TeNT, n=10; Nms-TeNT, n=9).
Figure 7
Figure 7. Reversible Overexpression of TeNT in Nms Neurons Causes Resetting of the Clock and Reduced Network Synchrony
(A) Representative actograms of Nms-TeNT (bottom) and genetic controls (R26-Nms: top-left; R26-TeNT: top-right). Dox was administered from conception until the switch to water during wheel running recording. Dox administration is highlighted in yellow. Colored bars represent the days of analyses presented in (B). (B) Quantification of circadian activity in Nms-TeNT and genetic controls collected from mice maintained in DD. Water-treated Nms-TeNT mice displayed no coherent rhythms (NR) in the circadian range and a low average amplitude in the circadian spectrum (two-way ANOVA, *p<0.05 by Tukey’s post-hoc test). Re-administration of Dox (20 μg/ml) (Dox Again) rescues the circadian rhythms of Nms-TeNT mice. No significant differences in mean circadian period or amplitude were found between Nms-TeNT and controls under the same Dox treatment (two-way ANOVA, *p> 0.05 by Tukey’s post-hoc test). Values are mean ± SEM (R26-Nms, n=6; R26-TeNT, n=8; Nms-TeNT, n=13). (C) Representative bioluminescence records from the SCN of Nms-TeNT mice and controls maintained in DD. Raw and baseline-subtracted plots are both displayed (R26-Nms: light-blue trace; R26-TeNT: dark-blue trace; Nms-TeNT: red trace). (D) Quantification of average SCN period and amplitude in Nms-TeNT and controls. No significant differences in mean circadian period were found between genotypes. Nms-TeNT SCN exhibited lower amplitudes of PER2::LUC rhythms compared to controls (one-way ANOVA, *p< 0.05 by Tukey’s post-hoc test). Values are mean ± SEM (R26-Nms, n=12; R26-TeNT, n=9; Nms-TeNT, n=12). (E) Representative raster and Rayleigh plots of PER2::LUC oscillation in 50 individual neurons from the SCN of adult R26-Nms, R26-TeNT, and Nms-TeNT mice. In the raster plot, the red corresponds to peak bioluminescence and the green to trough. The length of the arrow in the Rayleigh plot represents the strength of synchronization.
Figure 8
Figure 8. Schematic Summary of Findings
(A) NMS-expressing neurons are localized in the core, central, and shell regions of the SCN and encompass the majority of VIP- and AVP-expressing neurons but do not overlap with GRP-producing neurons. A small number of VIP- or AVP-expressing neurons (~5% each) that do not express NMS are not depicted here. (B) Green cells represent Nms neurons. Lengthening the intracellular circadian period of Nms neurons lengthens behavioral circadian period. Abolishing molecular rhythmicity of Nms neurons or blocking synaptic transmission from Nms neurons leads to the loss of coherent circadian rhythms.

Comment in

Similar articles

Cited by

References

    1. Abrahamson EE, Moore RY. Suprachiasmatic nucleus in the mouse: retinal innervation, intrinsic organization and efferent projections. Brain Res. 2001;916:172–191. - PubMed
    1. Aida R, Moriya T, Araki M, Akiyama M, Wada K, Wada E, Shibata S. Gastrin-releasing peptide mediates photic entrainable signals to dorsal subsets of suprachiasmatic nucleus via induction of Period gene in mice. Mol Pharmacol. 2002;61:26–34. - PubMed
    1. Atkins N, Mitchell JW, Romanova EV, Morgan DJ, Cominski TP, Ecker JL, Pintar JE, Sweedler JV, Gillette MU. Circadian integration of glutamatergic signals by little SAAS in novel suprachiasmatic circuits. PLoS One. 2010;5:e12612. - PMC - PubMed
    1. Aton SJ, Colwell CS, Harmar AJ, Waschek J, Herzog ED. Vasoactive intestinal polypeptide mediates circadian rhythmicity and synchrony in mammalian clock neurons. Nat Neurosci. 2005;8:476–483. - PMC - PubMed
    1. Bae K, Jin X, Maywood ES, Hastings MH, Reppert SM, Weaver DR. Differential functions of mPer1, mPer2, and mPer3 in the SCN circadian clock. Neuron. 2001;30:525–536. - PubMed

Publication types