

Identification of a key catalytic intermediate demonstrates that nitrogenase is activated by the reversible exchange of N₂ for H₂
- PMID: 25741750
- PMCID: PMC4374740
- DOI: 10.1021/jacs.5b00103
Identification of a key catalytic intermediate demonstrates that nitrogenase is activated by the reversible exchange of N₂ for H₂
Abstract
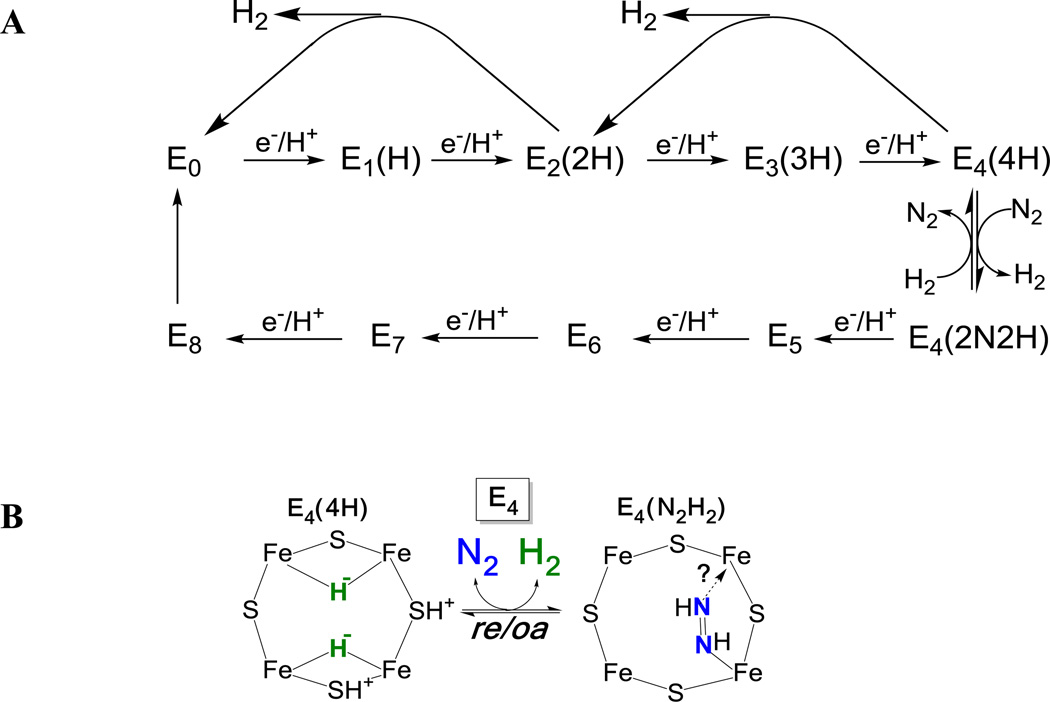
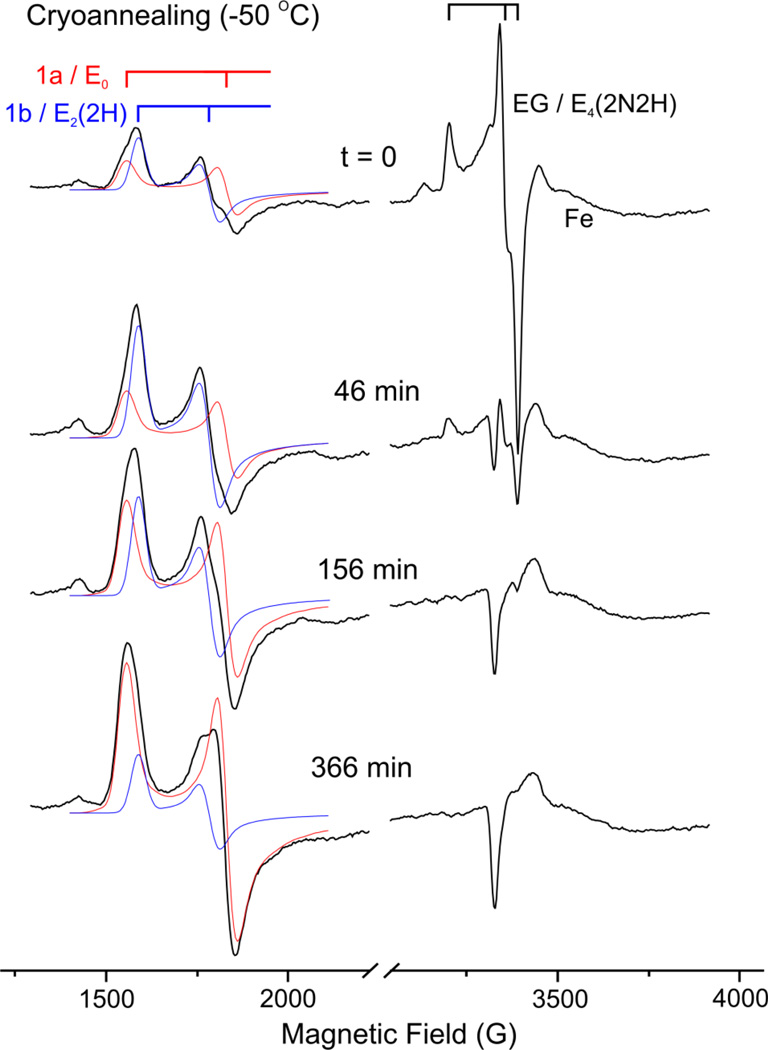
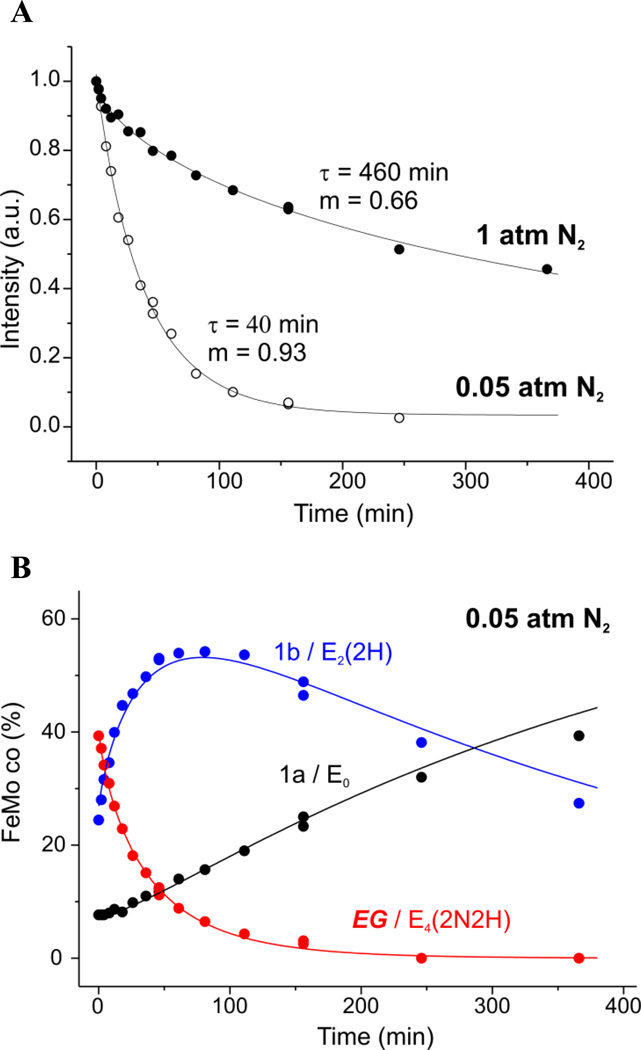
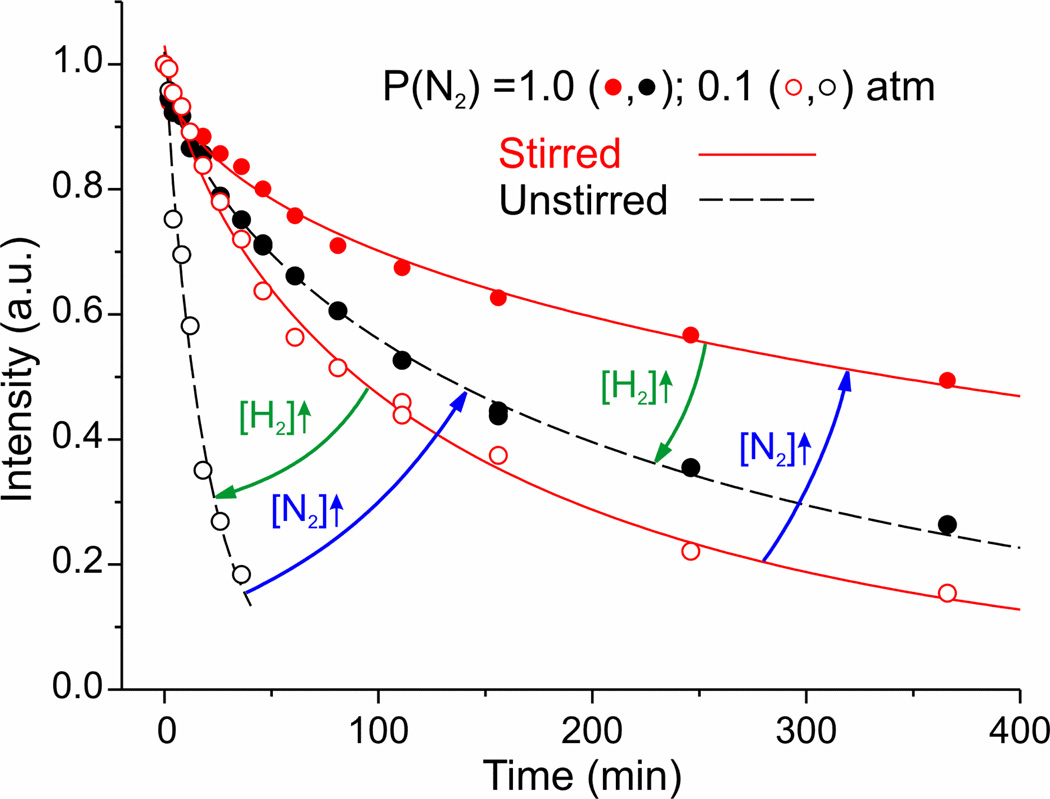
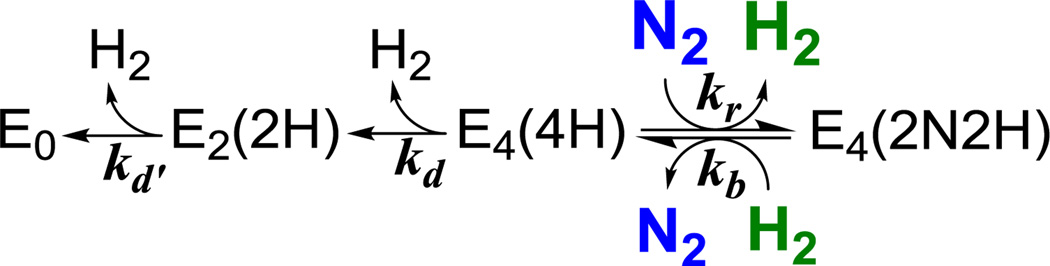
Freeze-quenching nitrogenase during turnover with N2 traps an S = ½ intermediate that was shown by ENDOR and EPR spectroscopy to contain N2 or a reduction product bound to the active-site molybdenum-iron cofactor (FeMo-co). To identify this intermediate (termed here EG), we turned to a quench-cryoannealing relaxation protocol. The trapped state is allowed to relax to the resting E0 state in frozen medium at a temperature below the melting temperature; relaxation is monitored by periodically cooling the sample to cryogenic temperature for EPR analysis. During -50 °C cryoannealing of EG prepared under turnover conditions in which the concentrations of N2 and H2 ([H2], [N2]) are systematically and independently varied, the rate of decay of EG is accelerated by increasing [H2] and slowed by increasing [N2] in the frozen reaction mixture; correspondingly, the accumulation of EG is greater with low [H2] and/or high [N2]. The influence of these diatomics identifies EG as the key catalytic intermediate formed by reductive elimination of H2 with concomitant N2 binding, a state in which FeMo-co binds the components of diazene (an N-N moiety, perhaps N2 and two [e(-)/H(+)] or diazene itself). This identification combines with an earlier study to demonstrate that nitrogenase is activated for N2 binding and reduction through the thermodynamically and kinetically reversible reductive-elimination/oxidative-addition exchange of N2 and H2, with an implied limiting stoichiometry of eight electrons/protons for the reduction of N2 to two NH3.
Figures
Similar articles
-
Reductive Elimination of H2 Activates Nitrogenase to Reduce the N≡N Triple Bond: Characterization of the E4(4H) Janus Intermediate in Wild-Type Enzyme.J Am Chem Soc. 2016 Aug 24;138(33):10674-83. doi: 10.1021/jacs.6b06362. Epub 2016 Aug 16. J Am Chem Soc. 2016. PMID: 27529724 Free PMC article.
-
A confirmation of the quench-cryoannealing relaxation protocol for identifying reduction states of freeze-trapped nitrogenase intermediates.Inorg Chem. 2014 Apr 7;53(7):3688-93. doi: 10.1021/ic500013c. Epub 2014 Mar 18. Inorg Chem. 2014. PMID: 24635454 Free PMC article.
-
Connecting nitrogenase intermediates with the kinetic scheme for N2 reduction by a relaxation protocol and identification of the N2 binding state.Proc Natl Acad Sci U S A. 2007 Jan 30;104(5):1451-5. doi: 10.1073/pnas.0610975104. Epub 2007 Jan 24. Proc Natl Acad Sci U S A. 2007. PMID: 17251348 Free PMC article.
-
Breaking the N2 triple bond: insights into the nitrogenase mechanism.Dalton Trans. 2006 May 21;(19):2277-84. doi: 10.1039/b517633f. Epub 2006 Apr 11. Dalton Trans. 2006. PMID: 16688314 Review.
-
Elucidating the coordination chemistry and mechanism of biological nitrogen fixation.Chem Asian J. 2007 Aug 3;2(8):936-46. doi: 10.1002/asia.200700131. Chem Asian J. 2007. PMID: 17614310 Review.
Cited by
-
Final E5 to E8 Steps in the Nitrogenase Mechanism for Nitrogen Fixation.J Phys Chem B. 2024 Oct 10;128(40):9699-9705. doi: 10.1021/acs.jpcb.4c04331. Epub 2024 Sep 30. J Phys Chem B. 2024. PMID: 39344806 Free PMC article.
-
Control of electron transfer in nitrogenase.Curr Opin Chem Biol. 2018 Dec;47:54-59. doi: 10.1016/j.cbpa.2018.08.011. Epub 2018 Sep 8. Curr Opin Chem Biol. 2018. PMID: 30205289 Free PMC article. Review.
-
Stepwise N-H Bond Formation From N2-Derived Iron Nitride, Imide and Amide Intermediates to Ammonia.Chem Sci. 2016;7(9):5736-5746. doi: 10.1039/C6SC00423G. Epub 2016 Jun 14. Chem Sci. 2016. PMID: 28066537 Free PMC article.
-
Mechanism of N2 Reduction Catalyzed by Fe-Nitrogenase Involves Reductive Elimination of H2.Biochemistry. 2018 Feb 6;57(5):701-710. doi: 10.1021/acs.biochem.7b01142. Epub 2018 Jan 17. Biochemistry. 2018. PMID: 29283553 Free PMC article.
-
Photoinduced Reductive Elimination of H2 from the Nitrogenase Dihydride (Janus) State Involves a FeMo-cofactor-H2 Intermediate.Inorg Chem. 2017 Feb 20;56(4):2233-2240. doi: 10.1021/acs.inorgchem.6b02899. Epub 2017 Feb 8. Inorg Chem. 2017. PMID: 28177622 Free PMC article.
References
-
- Burgess BK, Lowe DJ. Chem. Rev. 1996;96:2983. - PubMed
-
- Thorneley RNF, Lowe DJ. Metal Ions in Biology. 1985;7:221.
-
- Simpson FB, Burris RH. Science. 1984;224:1095. - PubMed
-
- Wilson PE, Nyborg AC, Watt GD. Biophysical Chemistry. 2001;91:281. - PubMed
-
- Igarashi RY, Laryukhin M, Dos Santos PC, Lee HI, Dean DR, Seefeldt LC, Hoffman BM. J Am. Chem. Soc. 2005;127:6231. - PubMed
Publication types
MeSH terms
Substances
Grants and funding
LinkOut - more resources
Full Text Sources
Other Literature Sources
