. 2015 Mar 5;10(3):e0118725.
doi: 10.1371/journal.pone.0118725. eCollection 2015.

Comparative genomics of Cluster O mycobacteriophages

Affiliations

Comparative genomics of Cluster O mycobacteriophages

Steven G Cresawn et al. PLoS One. .

Abstract

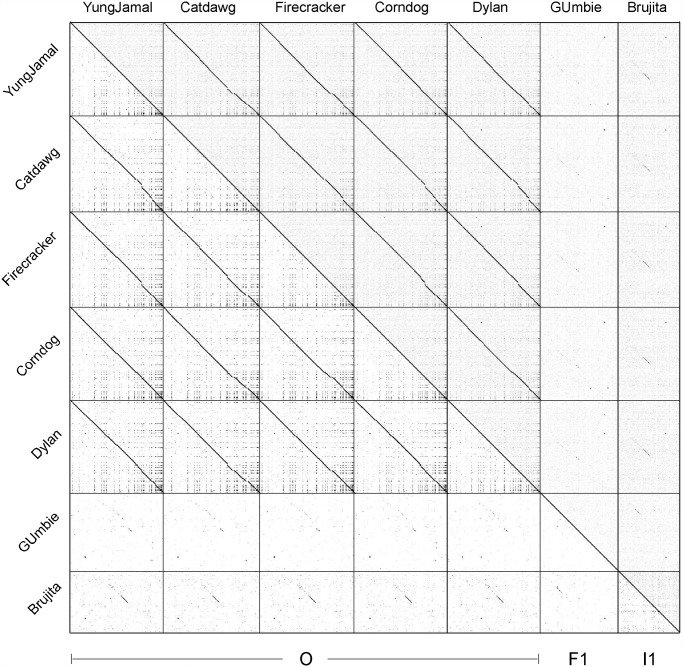
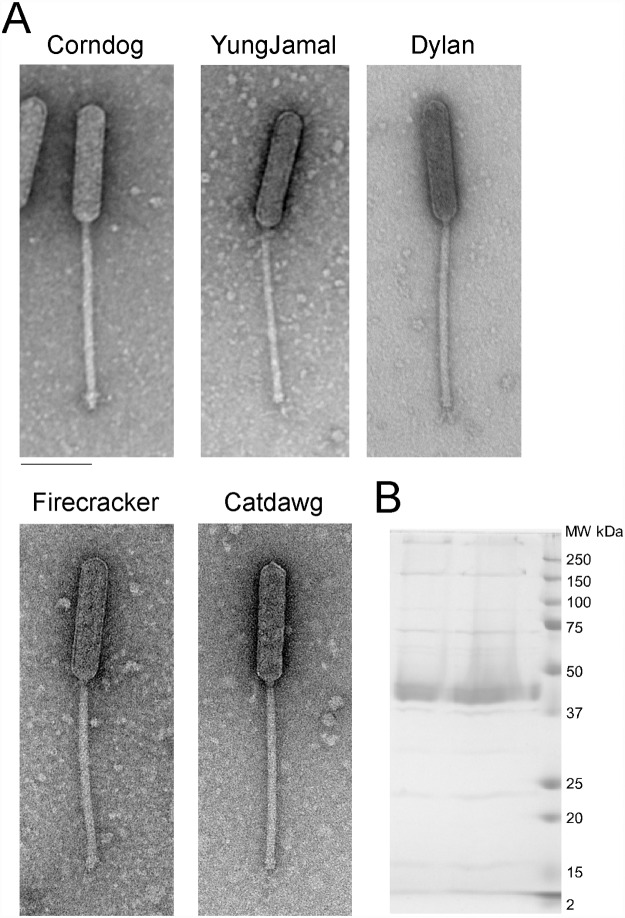
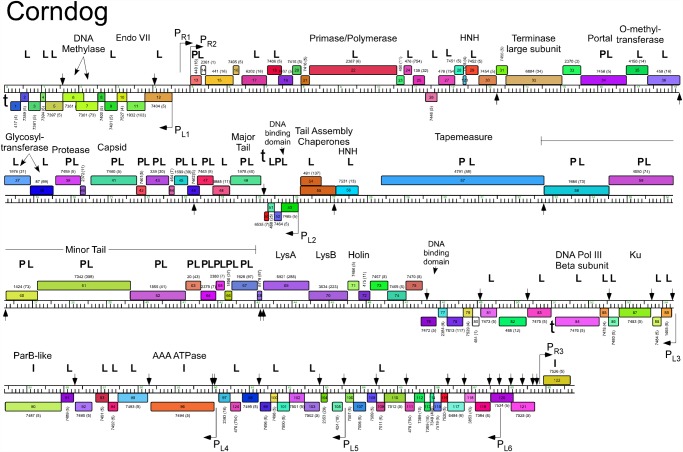
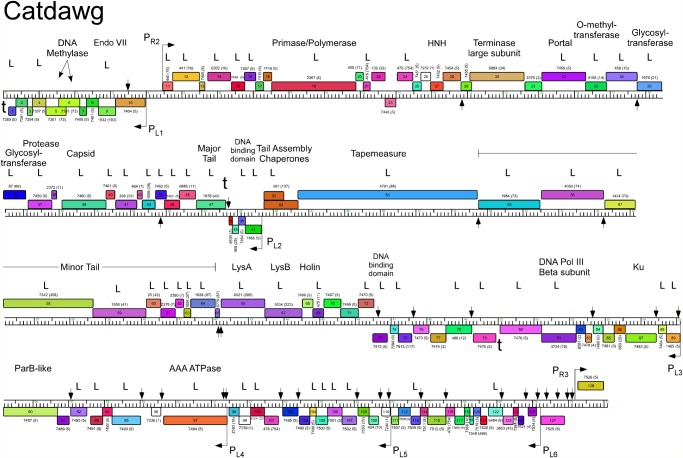
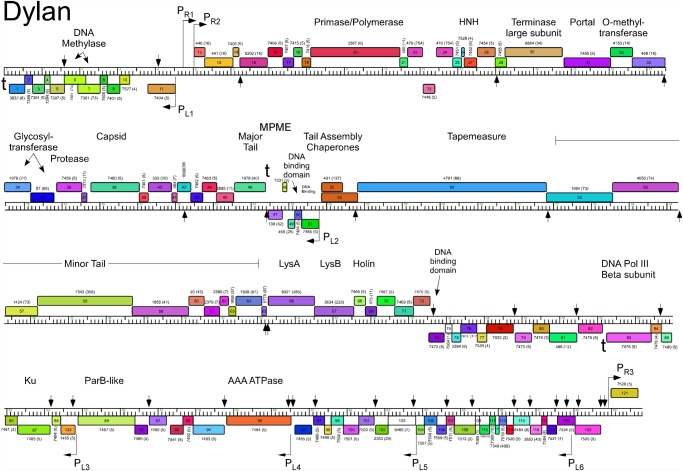
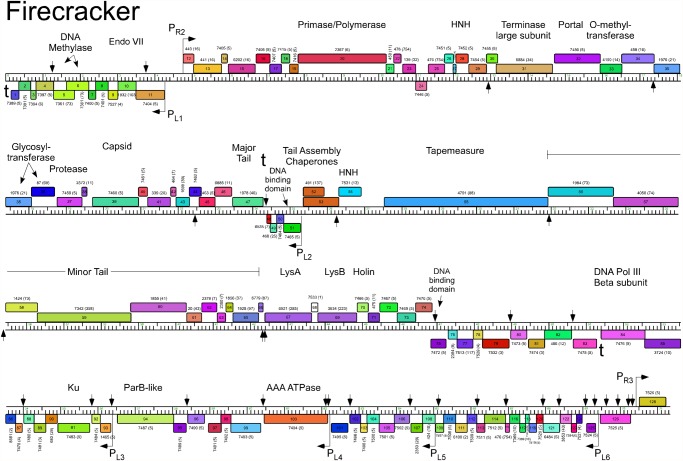
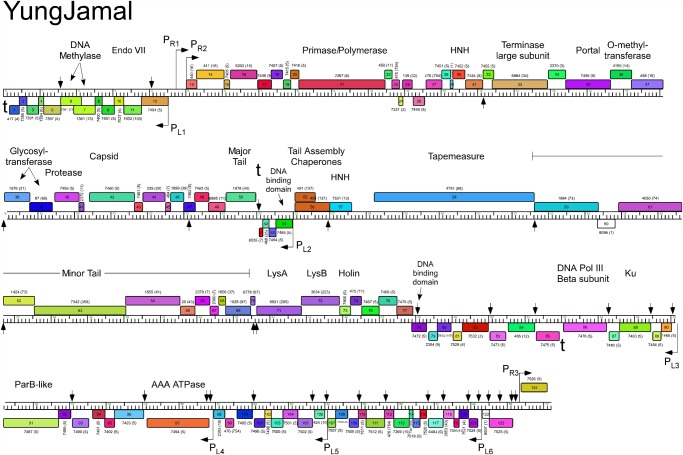
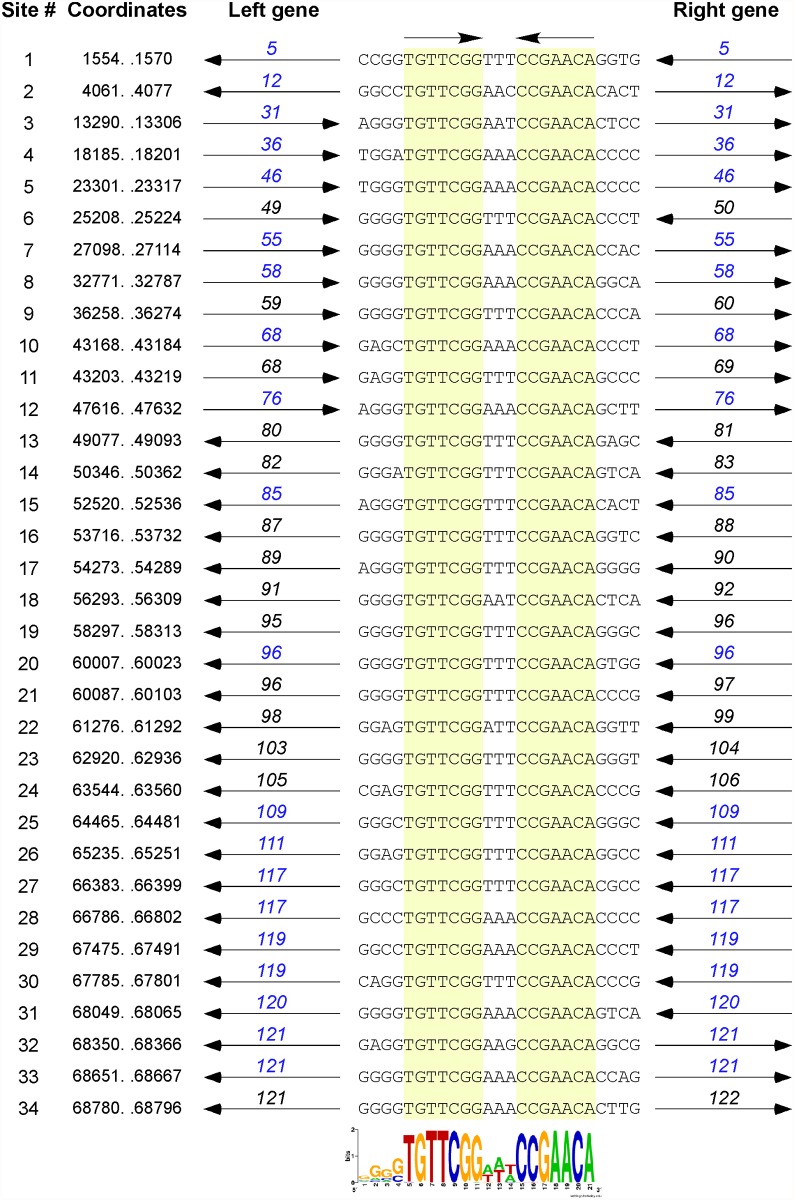
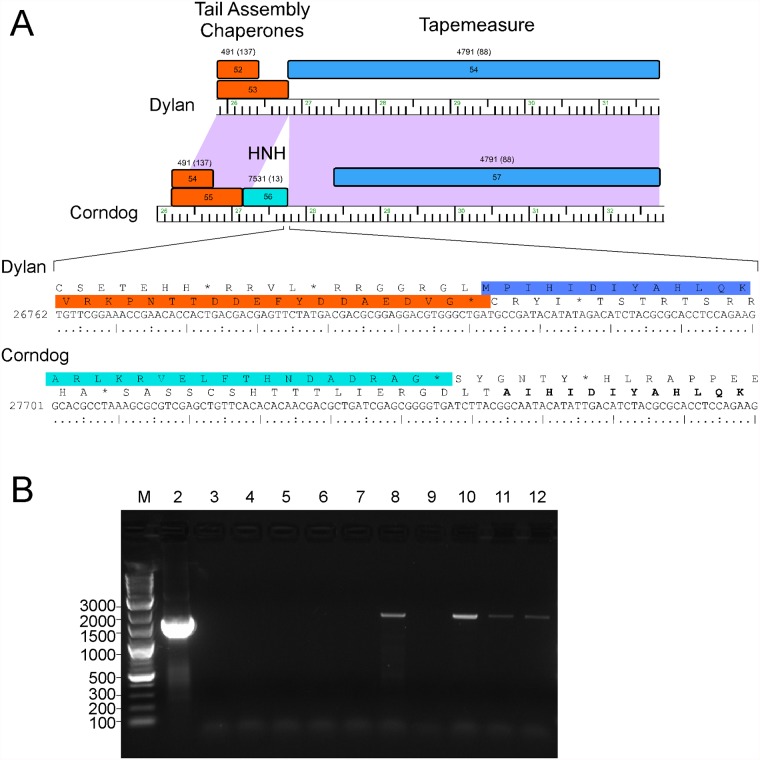
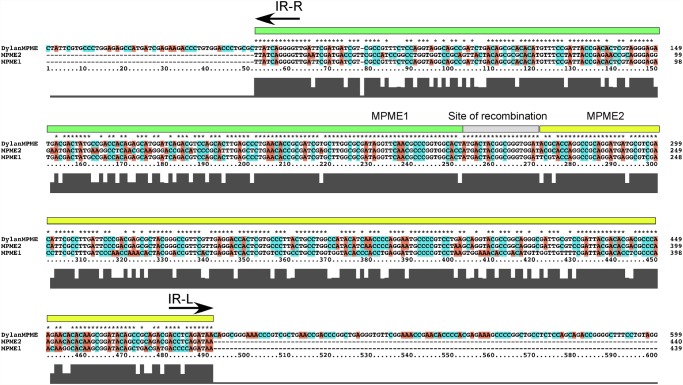
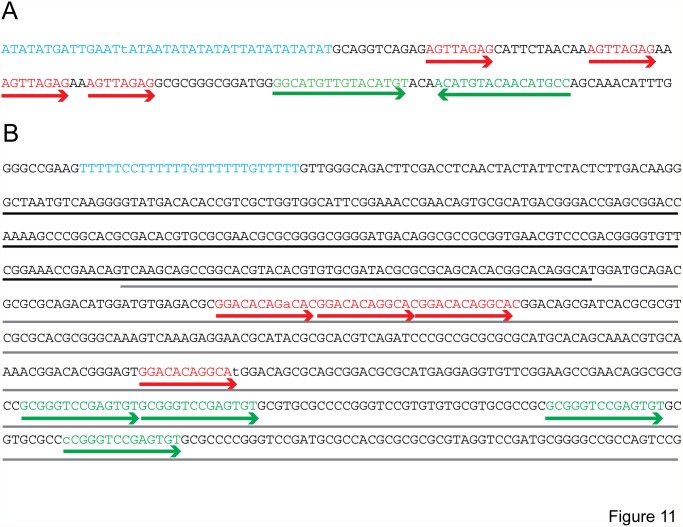
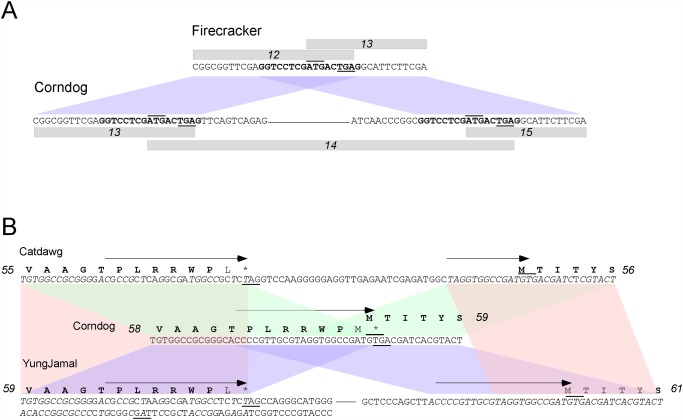
Mycobacteriophages--viruses of mycobacterial hosts--are genetically diverse but morphologically are all classified in the Caudovirales with double-stranded DNA and tails. We describe here a group of five closely related mycobacteriophages--Corndog, Catdawg, Dylan, Firecracker, and YungJamal--designated as Cluster O with long flexible tails but with unusual prolate capsids. Proteomic analysis of phage Corndog particles, Catdawg particles, and Corndog-infected cells confirms expression of half of the predicted gene products and indicates a non-canonical mechanism for translation of the Corndog tape measure protein. Bioinformatic analysis identifies 8-9 strongly predicted SigA promoters and all five Cluster O genomes contain more than 30 copies of a 17 bp repeat sequence with dyad symmetry located throughout the genomes. Comparison of the Cluster O phages provides insights into phage genome evolution including the processes of gene flux by horizontal genetic exchange.


Conflict of interest statement

Competing Interests: The authors have declared that no competing interests exist.

Figures

Fig 1
Fig 1. Dotplot comparison of Cluster O mycobacteriophages.
The five Cluster O phages along with GUmbie (Subcluster F1) and Brujita (Subcluster I1) were compared using Gepard [13] and the dotplots displayed at two different levels of sensitivity and contrast in the upper right and lower left triangles.
Fig 2
Fig 2. Cluster O mycobacteriophage virion morphologies.
A. Electron micrographs of Cluster O phages. Scale bar corresponds to 100 nm. B. SDS-PAGE analysis of Corndog virions.
Fig 3
Fig 3. Genome map of Mycobacteriophage Corndog.
The genome of phage Corndog is represented as a scale bar (major intervals: 1 kbp) with predicted genes shown as boxes either above (rightwards transcribed) or below (leftwards transcribed). Gene number is shown within each box and the phamily designation is shown either above or below with the number of phamily members shown in parentheses. Putative gene functions are indicated. The positions of putative SigA-like promoters (PL1—PL6 and PR1—PR3) are shown as large arrows and terminators (t) are indicated. Small vertical arrows show the locations of the palindromic repeat 5′-TGTTCGGNNNCCGAACA. Gene products identified by mass spectrometry (with at least two high confidence peptides per product) in twice CsCl banded particles (P) or from a once-banded lysate (L) are indicated, as well as three additional proteins identified in infected cells (I) not identified in the other samples. Proteins gp11, gp33, gp77, and gp102 had multiple high quality spectra (2, 2, 2, and 4 respectively) of a single peptide each.
Fig 4
Fig 4. Genome map of Mycobacteriophage Catdawg.
The genome of phage Catdawg is represented as a scale bar (major intervals: 1 kbp) with predicted genes shown as boxes either above (rightwards transcribed) or below (leftwards transcribed). Gene number is shown within each box and the phamily designation is shown either above or below with the number of phamily members shown in parentheses. Putative gene functions are indicated. The positions of putative SigA-like promoters (PL1—PL6 and PR1—PR3) are shown as large arrows. Small vertical arrows show the locations of the palindromic repeat 5′-TGTTCGGNNNCCGAACA. Catdawg proteins identified in a phage lysate using LC-MS/MS with at least two high confidence peptides per product are indicated (L).
Fig 5
Fig 5. Genome map of Mycobacteriophage Dylan.
The genome of phage Dylan is represented as a scale bar (major intervals: 1 kbp) with predicted genes shown as boxes either above (rightwards transcribed) or below (leftwards transcribed). Gene number is shown within each box and the phamily designation is shown either above or below with the number of phamily members shown in parentheses. Putative gene functions are indicated. The positions of putative SigA-like promoters (PL1—PL6 and PR1—PR3) are shown as large arrows. Small vertical arrows show the locations of the palindromic repeat 5′-TGTTCGGNNNCCGAACA.
Fig 6
Fig 6. Genome map of Mycobacteriophage Firecracker.
The genome of phage Firecracker is represented as a scale bar (major intervals: 1 kbp) with predicted genes shown as boxes either above (rightwards transcribed) or below (leftwards transcribed). Gene number is shown within each box and the phamily designation is shown either above or below with the number of phamily members shown in parentheses. Putative gene functions are indicated. The positions of putative SigA-like promoters (PL1—PL6 and PR1—PR3) are shown as large arrows. Small vertical arrows show the locations of the palindromic repeat 5′-TGTTCGGNNNCCGAACA.
Fig 7
Fig 7. Genome map of Mycobacteriophage YungJamal.
The genome of phage YungJamal is represented as a scale bar (major intervals: 1 kbp) with predicted genes shown as boxes either above (rightwards transcribed) or below (leftwards transcribed). Gene number is shown within each box and the phamily designation is shown either above or below with the number of phamily members shown in parentheses. Putative gene functions are indicated. The positions of putative SigA-like promoters (PL1—PL6 and PR1—PR3) are shown as large arrows. Small vertical arrows show the locations of the palindromic repeat 5′-TGTTCGGNNNCCGAACA.
Fig 8
Fig 8. Conserved repeats sequences in the Corndog genome.
The Corndog genome contains multiple repeats of a 17 bp sequence composed of two 7 bp inverted motifs separated by three base pairs. The 34 sites are aligned, showing the top strand (and flanking 4 bp) with the 7 bp motifs are highlighted in yellow; the coordinates shown correspond to the 17 bp sequence. The genes flanking the repeat (black) or the genes containing the repeat (blue) and their directions of transcription are shown. Fourteen of the 34 sites (# 6, 9, 11, 13, 14, 16, 17, 18, 19, 21, 22, 23, 24, and 34) are located between open reading frames, ten (#1, 3, 7, 8, 15, 20, 28, 29, 31, and 33) are within open reading frames but close to the 5′ end of the gene (and could be intergenic if the start site is not correctly identified), and ten (#2, 4, 5, 10, 12, 25, 26, 27, 30, and 32) are in the middle or towards the 3’ ends of genes (and the gene is not shown). An additional three sites containing a single base change are not shown. The weblogo at the bottom shows alignment of all 34 sites and related sites identified by MEME [19]; both orientations are compiled due to the inverted repeat such that the flanking 4 bp is shown only on the left. Note that the central three nucleotide spacer is A/T rich, with the most common sequence being AAA or TTT (29 of the 34 sites). There is a slight preference for the orientation of the site to be such that the AAA is on the top strand when the site is transcribed in the rightwards direction. The flanking four nucleotides are G/C rich.
Fig 9
Fig 9. Unusual translation initiation of the Corndog tape measure protein gene.
A. Two organizations of the tape measure genes are present in the Cluster O phages. In Dylan and Catdawg the tmp gene is predicted to start translation immediately downstream of the tail assembly chaperone genes that are translated via a programmed translational frameshift. In contrast, Corndog, Firecracker, and YungJamal have a non-coding gap prior to the tmp start site. However, LC-MS/MS identified Corndog peptides corresponding to this gap and the sequence of the most N-terminal peptides are shown in bold type. Translation presumably either initiates at the ACG threonine codon or starts further upstream and involves a ribosome bypass event. B. RT-PCR of Corndog transcripts. PCR products were generated using a Corndog lysate (lane 2) or RNA isolated from uninfected cells (lanes 3 and 4), or at different times after infected by Corndog: 30 min (lanes 5 and 6), 2.5 h (lanes 7 and 8), 3.5 h (lanes 9 and 10), and 4.5 h (lanes 11 and 12. Lanes 3, 5, 7, 9, and 11 are controls lacking reverse transcriptase. A DNA ladder marker (M) is shown with sizes in base pairs. Genomic DNA and unspliced RNAs generate an expected product of ~1.7 kbp. No smaller spliced products are observed.
Fig 10
Fig 10. Dylan MPME element.
Phage Dylan contains a Mycobacteriophage Mobile Element (MPME) inserted between genes 46 and 48. The Dylan MPME contains an open reading frame (47) that is transcribed leftwards, such that the MPME left inverted repeat (IR-R) is 48-proximal. Alignment of the Dylan MMPE sequence with MPME1 and MPMP2 [27] shows that one half (green box) is identical to MPME1 and the other half (yellow box) is identical to MPME2. The Dylan MPME is thus a hybrid of MPME1 and MPME2, presumably generated by homologous recombination with the intervening sequence (grey box).
Fig 11
Fig 11. Sequence features of Cluster O genomes.
A. The AT rich element between Corndog genes 12 and 13 is highlighted in cyan, and two sets of flanking sequence repeats are shown in red and green. A similar arrangement of these sequences is observed in the other Cluster O phages. Residues in these sequence elements that differ across the phages (in the case of the AT rich element), or from the repeat consensus sequences are shown in lower case. B. A portion of Corndog genes 120 (underlined in black) and 121 (underlined in gray). The conserved T5CCT6GT6GT5 sequence is shown in cyan and flanking sequence repeats are shown in green and red. Residues in these sequence elements that differ across the phages (in the case of the T rich element), or from the repeat consensus sequences are shown in lower case.
Fig 12
Fig 12. Insights into genome evolution.
A. Insertion of Corndog gene 14. Cluster O genome comparisons show that Corndog gene 14 is missing from the other four related genomes. A 17 bp direct repeat (bold type) flanks Corndog gene 14 but is present only once at the junction of Firecracker gene 12 and 13 and their homologues in Dylan, Catdawg and YungJamal. Termination codons are underlined and translation start codons are overlined. Regions of nucleotide similarity are indicated by colored trapezoids. B. Insertion of gene 60 in YungJamal. YungJamal gene 60 encodes a protein of unknown function and is absent in all four other Cluster O genomes. YungJamal 60 is transcribed leftwards and is flanked by imperfectly conserved 24 bp inverted repeats (shown by arrows), but in which only 14 bp are conserved. However, Corndog (as well as Dylan and Firecracker) contains just a single copy of this repeat at the junction of genes Corndog 58 and 59. Unusually the rightmost copy of the repeat in YungJamal (at the beginning of gene 61) is identical to the Corndog sequence, whereas the leftmost repeat (at the end of gene 59) is a degenerate copy in which most of the base changes are synonymous, except for the C-terminal residue. Termination codons are underlined and translation start codons are overlined; the sequences of both strands for the left component of YungJamal are indicated to show the termination codon (underlined) of YungJamal 60. Catdawg lacks a homologue of YungJamal 60 but carries a small insertion relative to Corndog, Dylan, and Firecracker, and has part of the rightmost YungJamal repeat. Catdawg and YungJamal sequences shared with Corndog are shown in italic type. Sequences of nucleotide similarity are indicated by the colored trapezoids (Catdawg and Corndog, green; Corndog and YungJamal, purple; Catdawg and YungJamal, red).

References

    1. Hatfull GF, Hendrix RW. Bacteriophages and their Genomes. Current Opinions in Virology. 2011;1, 298–303. 10.1016/j.coviro.2011.06.009 - DOI - PMC - PubMed
    1. Wommack KE, Colwell RR. Virioplankton: viruses in aquatic ecosystems. Microbiol Mol Biol Rev. 2000;64(1):69–114. - PMC - PubMed
    1. Abrescia NG, Bamford DH, Grimes JM, Stuart DI. Structure unifies the viral universe. Annu Rev Biochem. 2012;81:795–822. Epub 2012/04/10. 10.1146/annurev-biochem-060910-095130 - DOI - PubMed
    1. Hendrix RW, Smith MC, Burns RN, Ford ME, Hatfull GF. Evolutionary relationships among diverse bacteriophages and prophages: all the world’s a phage. Proc Natl Acad Sci U S A. 1999;96(5):2192–7. Epub 1999/03/03. - PMC - PubMed
    1. Hendrix RW. Bacteriophages In: Knipe DM, Howley PM, editors. Fields Virology, Sixth Edition Philadelphia: Lippincott Williams & Wilkins; 2013.

Publication types