. 2015 Apr 23;125(17):2678-88.
doi: 10.1182/blood-2014-06-582924. Epub 2015 Mar 5.

Osteoblast ablation reduces normal long-term hematopoietic stem cell self-renewal but accelerates leukemia development

Affiliations

Osteoblast ablation reduces normal long-term hematopoietic stem cell self-renewal but accelerates leukemia development

Marisa Bowers et al. Blood. .

Abstract

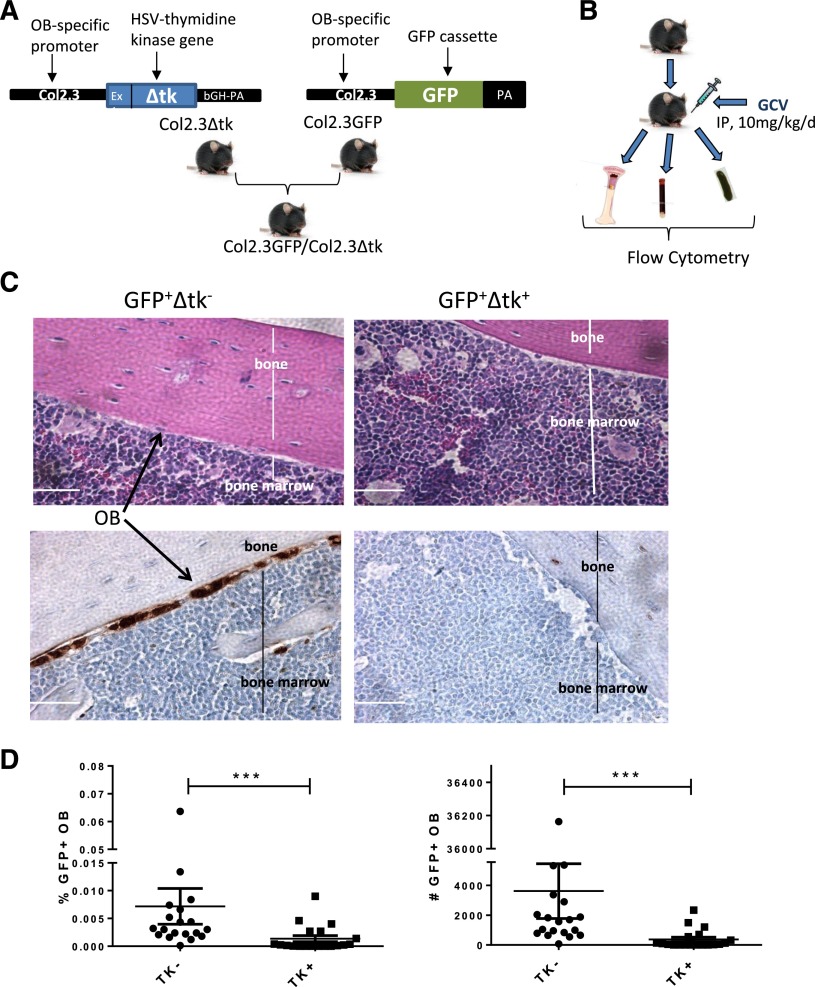
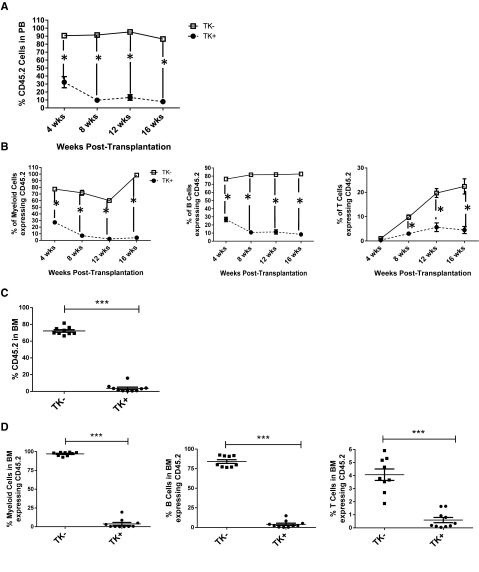
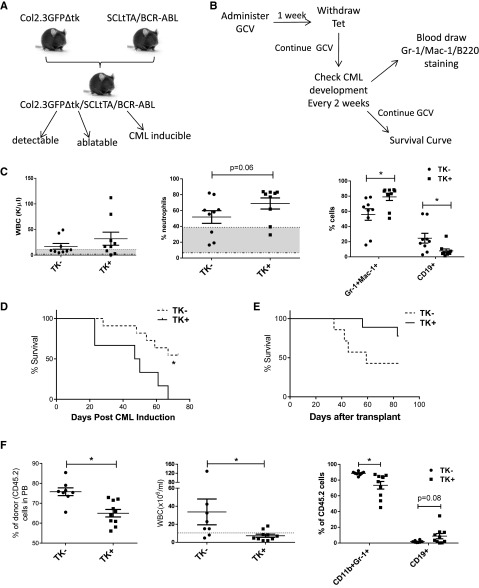
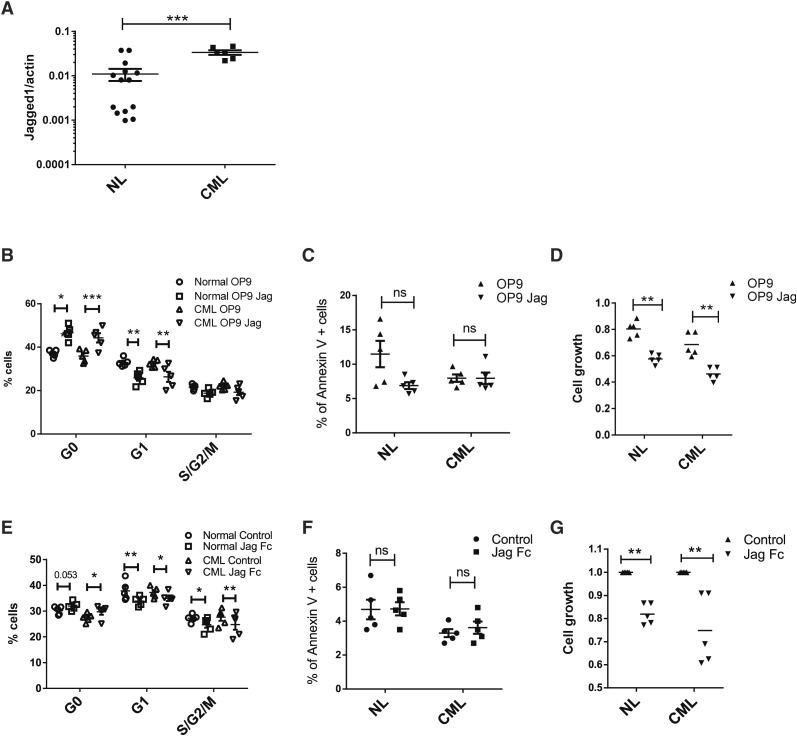
Hematopoietic stem cells (HSCs) reside in regulatory niches in the bone marrow (BM). Although HSC niches have been extensively characterized, the role of endosteal osteoblasts (OBs) in HSC regulation requires further clarification, and the role of OBs in regulating leukemic stem cells (LSCs) is not well studied. We used an OB visualization and ablation mouse model to study the role of OBs in regulating normal HSCs and chronic myelogenous leukemia (CML) LSCs. OB ablation resulted in increase in cells with a LSK Flt3(-)CD150(+)CD48(-) long-term HSC (LTHSC) phenotype but reduction of a more highly selected LSK Flt3(-)CD34(-)CD49b(-)CD229(-) LTHSC subpopulation. LTHSCs from OB-ablated mice demonstrated loss of quiescence and reduced long-term engraftment and self-renewal capacity. Ablation of OB in a transgenic CML mouse model resulted in accelerated leukemia development with reduced survival compared with control mice. The notch ligand Jagged-1 was overexpressed on CML OBs. Normal and CML LTHSCs cultured with Jagged-1 demonstrated reduced cell cycling, consistent with a possible role for loss of Jagged-1 signals in altered HSC and LSC function after OB ablation. These studies support an important role for OBs in regulating quiescence and self-renewal of LTHSCs and a previously unrecognized role in modulating leukemia development in CML.


Figures

Figure 1
Figure 1
Ablation of BM OBs in Col2.3GFP/Col2.3Δtk mice. (A) Strategy for generation of GFP-expressing OB ablation mice. (B) Experimental procedure for OB ablation and detection. (C) (Upper) Hematoxylin and eosin staining and (lower) GFP and DAPI staining of femur sections demonstrating the presence and absence of OB following GCV treatment in control (TK−) and ablation (TK+) mice, respectively. (D) Percentage (left) and number (right) of OBs in BM following GCV treatment as detected by flow cytometry (n = 19). Error bars represent mean ± SEM. Significance values: ***P < .001.
Figure 2
Figure 2
Effects of OB ablation on BM cellularity and stem and progenitor cell populations. (A) Total BM cellularity and (B) SP cellularity in control (TK−) and OB ablated (TK+) mice detected by flow cytometry. (C) Representative flow cytometry gating for LTHSCs. Percentage (left) and total cell number (right) of GMP in (D) BM and (E) SP of OB ablated and control mice. (F) Percentage and (G) total number of LTHSCs of OB ablated and control mice. (H) Percentage (left) and total cell number (right) of LSK Flt3CD34CD49bCD229 cells in MB and SP of OB ablated and control mice. Error bars represent mean ± SEM. Significance values: *P < .05, **P < .01, ***P < .001.
Figure 3
Figure 3
Engraftment of LTHSC from OB-ablated mice after transplantation. (A) Schematic representation of experimental procedure for transplantation of LTHSCs (CD45.2) selected from BM of OB ablated or nonablated mice into lethally irradiated CD45.1 wild-type recipient mice and secondary transplantation of whole BM cells from primary recipient mice into secondary recipient mice. (B) Engraftment of CD45.2 cells following transplantation of LTHSCs from control (TK−) or OB ablated (TK+) mice. (C) Engraftment of CD45.2 myeloid, B-cell, and T-cell lineages following transplantation of LTHSCs from control (TK−) or OB ablated (TK+) mice. (D) Lin cells selected from BM of control (TK−) or OB ablated (TK+) mice were stained with LTHSC markers, fixed, permeabilized, labeled with Ki-67 and DAPI, and analyzed for cell cycle by flow cytometry. Error bars represent mean ± SEM. Significance values: *P < .05, **P < .01.
Figure 4
Figure 4
LTHSC functional analysis: secondary transplant. (A) CD45.2 engraftment analysis of LTHSCs derived from control (TK−) or ablation (TK+) mice in BM 16 weeks after secondary transplant. (B) Multilineage engraftment analysis of LTHSCs derived from control (TK−) or ablation (TK+) mice in BM 16 weeks after secondary transplant. (C) CD45.2 and multilineage (D) engraftment analysis of whole BM derived from secondary transplant recipients at 16 weeks. Engraftment is defined as >1% CD45.2, detected by flow cytometry. Error bars represent mean ± SEM. ***P < .0001 by 2-way analysis of variance.
Figure 5
Figure 5
CML induction in OB ablation model. (A) Schematic representation of generation of OB ablation CML induction mice. (B) Schematic representation of CML induction. (C) WBC counts, percentage of neutrophils, and Gr-1+CD11b+ cells in the PB of control and OB ablated BCR/ABL mice at 6 weeks after BCR/ABL induction. (D) Survival curve for control or OB ablated BCR/ABL mice. (E-F) After 28 days of GCV treatment and 3 weeks of BCR-ABL induction, CD45.2 LTHSCs (400 cells per mouse) were sorted from control or OB ablated BCR/ABL mice and transplanted into CD45.1 recipient mice. (E) Survival curves for transplanted mice. (F) Donor cell engraftment, WBC counts, and percentage of Gr-1+CD11b+ cells in PB was monitored. *P < .05. Error bars represent mean ± SEM.
Figure 6
Figure 6
Role of Jagged-1 in regulating normal and CML LTHSC growth. (A) Jagged 1 expression in OBs from normal and BCR/ABL mice. (B) Cell cycle, (C) apoptosis, and (D) cell growth of LTHSCs from control and BCR/ABL mice after coculture with OP9 or OP9-Jag1 for 48 hours. (E) Cell cycle, (F) apoptosis, and (G) cell growth of LTHSCs from control and BCR/ABL mice after culture with or without Jag1/Fc immobilized wells. NL, normal.

Comment in

References

    1. Morrison SJ, Scadden DT. The bone marrow niche for haematopoietic stem cells. Nature. 2014;505(7483):327–334. - PMC - PubMed
    1. Arai F, Suda T. Maintenance of quiescent hematopoietic stem cells in the osteoblastic niche. Ann N Y Acad Sci. 2007;1106:41–53. - PubMed
    1. Visnjic D, Kalajzic Z, Rowe DW, Katavic V, Lorenzo J, Aguila HL. Hematopoiesis is severely altered in mice with an induced osteoblast deficiency. Blood. 2004;103(9):3258–3264. - PubMed
    1. Calvi LM, Adams GB, Weibrecht KW, et al. Osteoblastic cells regulate the haematopoietic stem cell niche. Nature. 2003;425(6960):841–846. - PubMed
    1. Guezguez B, Campbell CJ, Boyd AL, et al. Regional localization within the bone marrow influences the functional capacity of human HSCs. Cell Stem Cell. 2013;13(2):175–189. - PubMed

Publication types

MeSH terms

LinkOut - more resources