. 2015 Apr 16;125(16):2530-43.
doi: 10.1182/blood-2014-12-619783. Epub 2015 Mar 5.

Selective inhibition of protein arginine methyltransferase 5 blocks initiation and maintenance of B-cell transformation

Affiliations

Selective inhibition of protein arginine methyltransferase 5 blocks initiation and maintenance of B-cell transformation

Lapo Alinari et al. Blood. .

Abstract

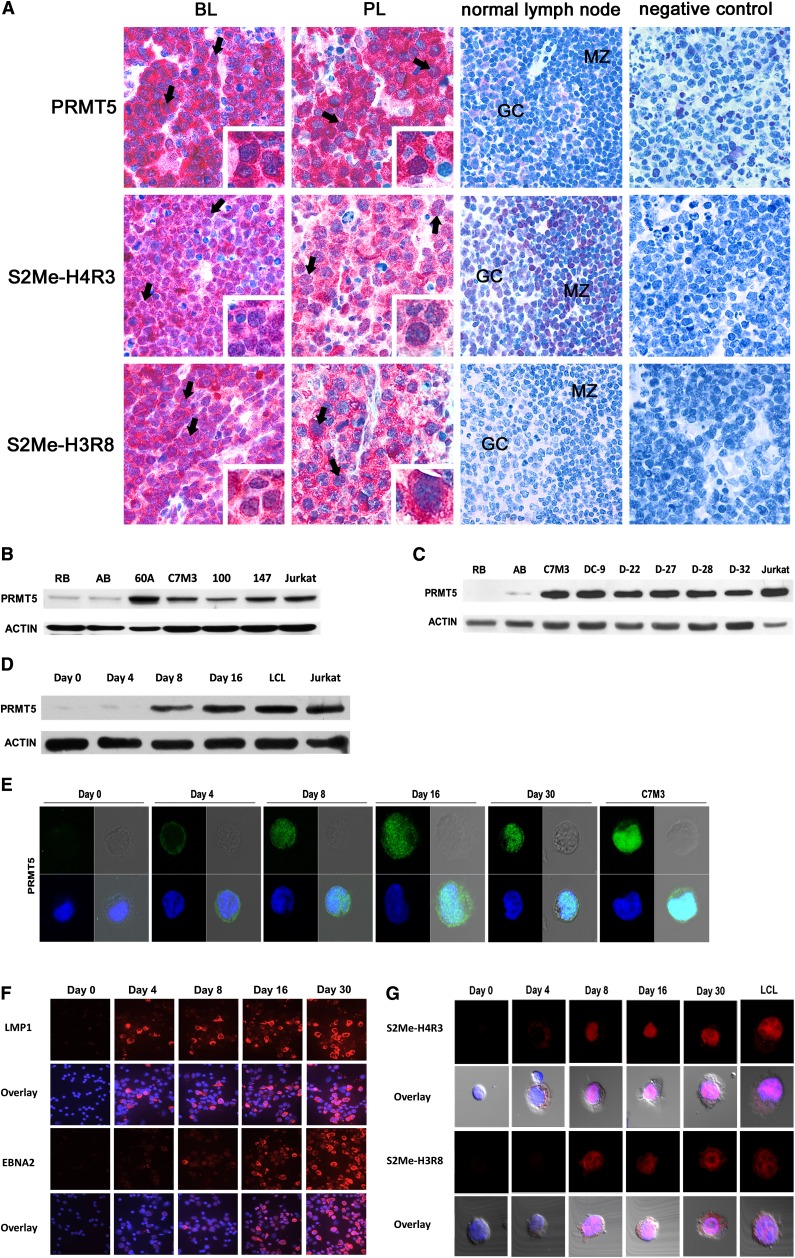
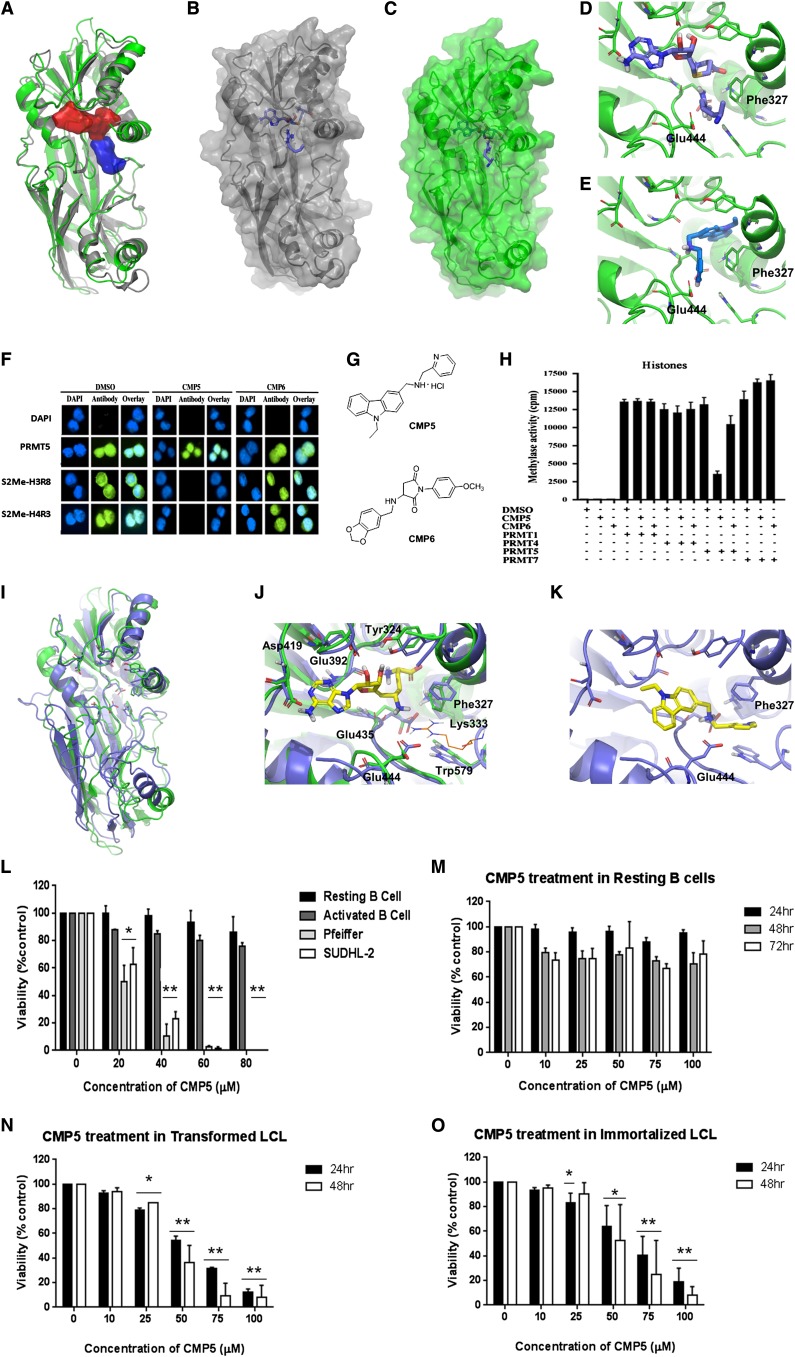
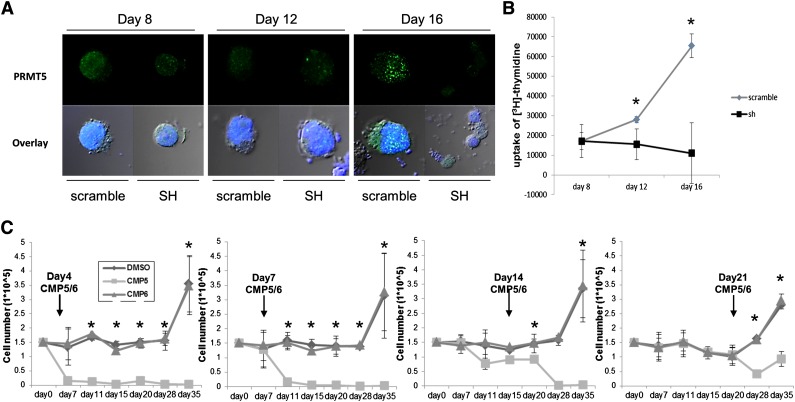
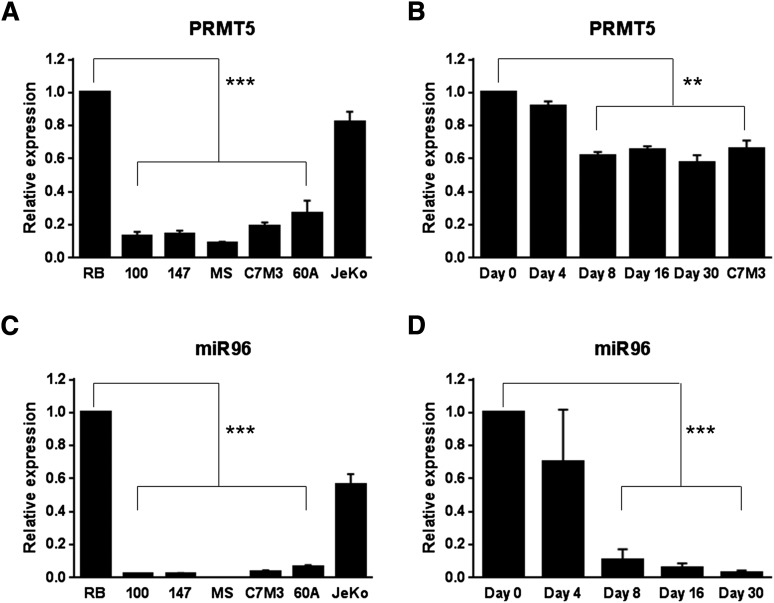
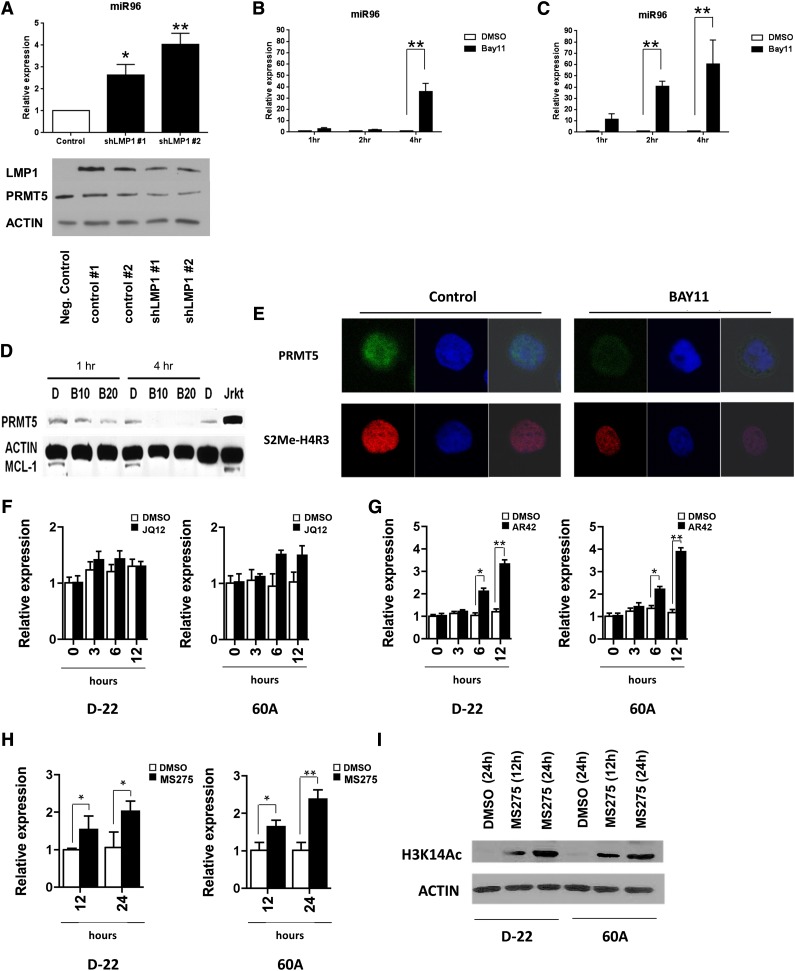
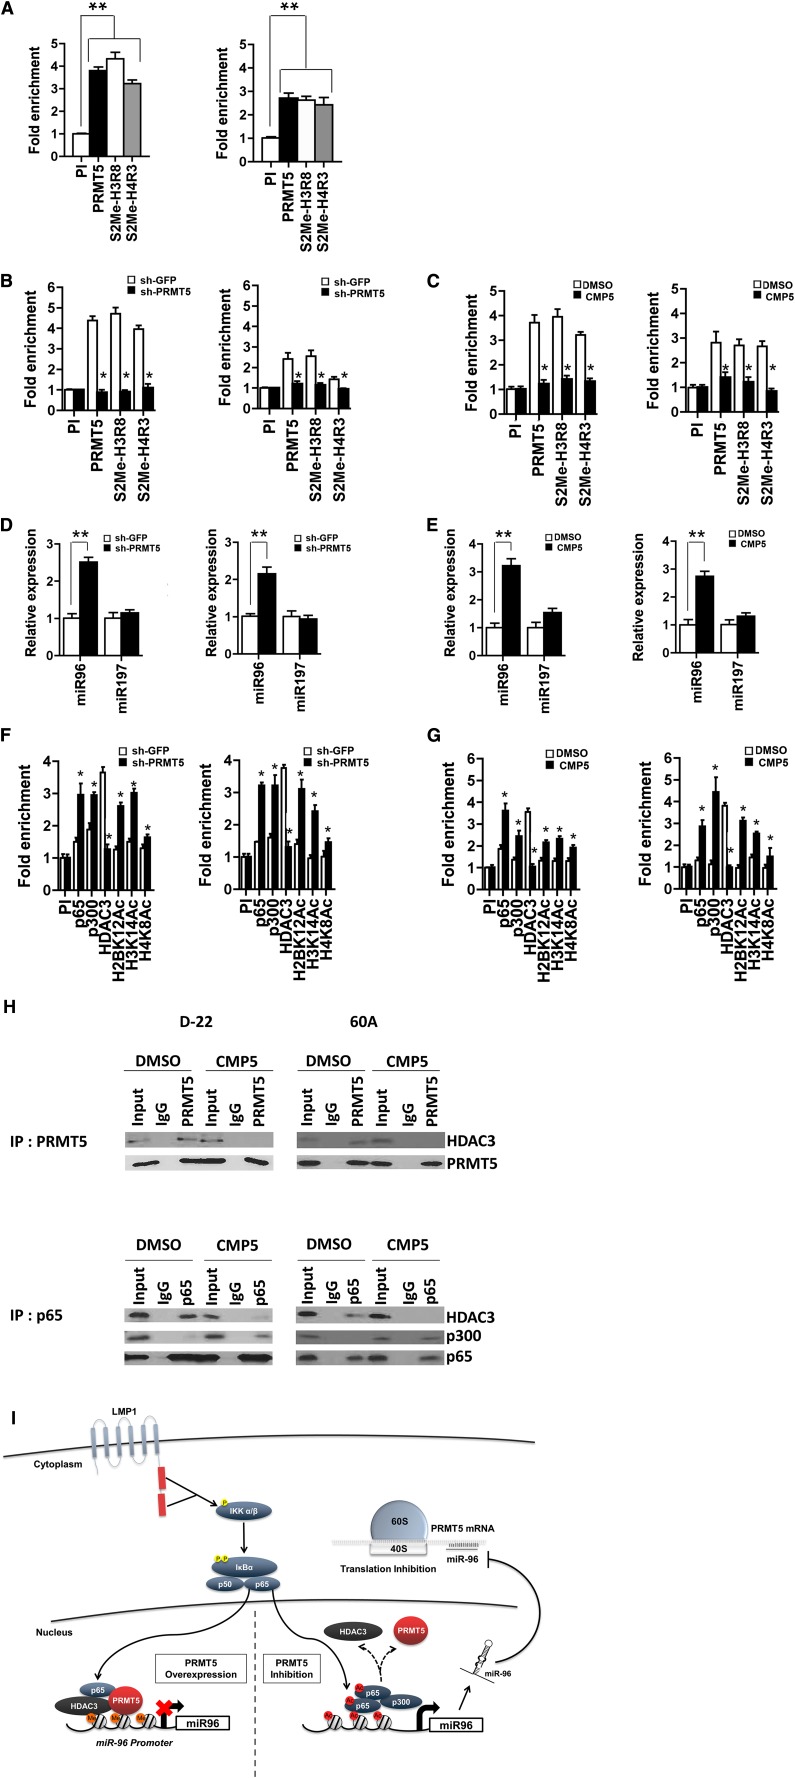
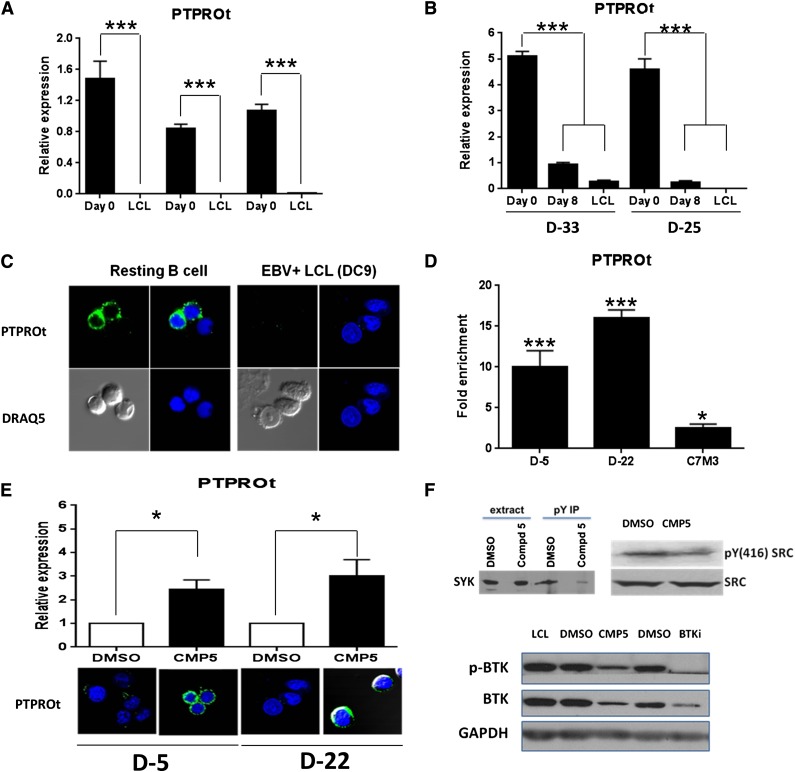
Epigenetic events that are essential drivers of lymphocyte transformation remain incompletely characterized. We used models of Epstein-Barr virus (EBV)-induced B-cell transformation to document the relevance of protein arginine methyltransferase 5 (PRMT5) to regulation of epigenetic-repressive marks during lymphomagenesis. EBV(+) lymphomas and transformed cell lines exhibited abundant expression of PRMT5, a type II PRMT enzyme that promotes transcriptional silencing of target genes by methylating arginine residues on histone tails. PRMT5 expression was limited to EBV-transformed cells, not resting or activated B lymphocytes, validating it as an ideal therapeutic target. We developed a first-in-class, small-molecule PRMT5 inhibitor that blocked EBV-driven B-lymphocyte transformation and survival while leaving normal B cells unaffected. Inhibition of PRMT5 led to lost recruitment of a PRMT5/p65/HDAC3-repressive complex on the miR96 promoter, restored miR96 expression, and PRMT5 downregulation. RNA-sequencing and chromatin immunoprecipitation experiments identified several tumor suppressor genes, including the protein tyrosine phosphatase gene PTPROt, which became silenced during EBV-driven B-cell transformation. Enhanced PTPROt expression following PRMT5 inhibition led to dephosphorylation of kinases that regulate B-cell receptor signaling. We conclude that PRMT5 is critical to EBV-driven B-cell transformation and maintenance of the malignant phenotype, and that PRMT5 inhibition shows promise as a novel therapeutic approach for B-cell lymphomas.


Figures

Figure 1
Figure 1
PRMT5 is overexpressed in EBV+ primary lymphomas, EBV-transformed and EBV-immortalized B cells. (A) Immunohistochemical nuclear/cytoplasmic expression of both PRMT5 and its epigenetic marks, S2Me-H3R8 and S2Me-H4R3, in Burkitt lymphoma (BL) (left column: ×400) and plasmablastic lymphoma (PL) (second column, from left; ×400); examples of nuclear dark red positivity are highlighted by black arrows and in the insets. The pattern of PRMT5, S2Me-H3R8, and S2Me-H4R3 expression in germinal centers (GCs) and mantle zone (MZ) of reactive lymph nodes is illustrated (third column, from left: ×400). Images of negative controls are shown (×400). (B) Western blot of PRMT5 expression in resting (RB), activated B cells (AB), and transformed LCLs obtained from hu-PBL-SCID mouse lymphomas generated from 4 separate donors (60A, C7M3, 100, 147). (C) Western blot of PRMT5 expression in RB, AB cells, and fully immortalized LCLs generated by infecting with EBV normal B cells from 6 separate healthy donors (C7M3, D-9, D-22, D-27, D-28, D-32). (D) Western blot of PRMT5 expression at various time points following in vitro infection of normal B cells with EBV. LCL is a fully immortalized cell line; Jurkat was used as positive control. Actin used as loading control. (E-G) Confocal microscopy of PRMT5 (E), LMP1 and EBNA2 (F), and PRMT5 epigenetic marks, S2Me-H4R3 and S2Me-H3R8 (G), at various time points following in vitro EBV infection of normal B cells. LCL is a fully immortalized cell line (G); C7M3 is a fully transformed cell line used as positive control (E).
Figure 2
Figure 2
Establishment of a first-in-class PRMT5-specific inhibitor. (A) View of the crystal structure of rPRMT1 (aa 41-353, Protein Data Bank [PDB] ID 1OR8, gray ribbon representation) superimposed on the C-terminal domain of the hPRMT5 model (aa 310-637, green ribbon representation) showing the conserved nature of the PRMT family catalytic domain. The cofactor SAM and substrate arginine residue binding pockets are shown as red and blue regions, respectively. (B) rPRMT3 crystal structure displaying the cocrystallized SAH and arginine residue (purple carbon stick representation). (C) hPRMT5 model showing docked SAH and arginine residue similarly oriented in comparison with the rPRMT3 crystal structure. (D) Close-up view of SAH and arginine (stick representation; purple carbon) docked to the hPRMT5 model (green ribbon and key residues in green carbon stick representation). (E) CMP5 (stick representation; purple carbon) docked to the hPRMT5 model (green ribbon and key residues in green carbon stick representation) showing initial predicted interaction with residues. For clarity, residues covering the catalytic site face are not shown in the figures. (F) Immunofluorescence staining of JeKo cells (MCL cell line) treated with DMSO, CMP5, or CMP6 using antibodies against symmetrically (S) dimethylated S2Me-H4R8 and S2Me-H3R8. DAPI (4,6 diamidino-2-phenylindole) was used to stain nuclei. (G) Chemical structure of selective PRMT5 inhibitor CMP5 and nonreactive control CMP6. (H) Histone methyltransferase assays were performed as described in “Methods” in the presence of DMSO, CMP5 (10-100 μM), or CMP6 (10-100 μM). (I) View of the crystal structure of the C-terminal domain of hPRMT5 (aa 310-637, PDB ID 4GQB, blue ribbon representation) superimposed on model hPRMT5 (green ribbon representation). (J) Close-up catalytic site view of the superposed hPRMT5 crystal structure (blue ribbon and blue carbon stick representation) and model (green ribbon and green carbon stick representation). Cocrystallized SAM analog and substrate arginine residue are shown as yellow carbon stick and line representation, respectively. (K) View of the docked conformation of CMP5 (yellow carbon stick representation) within the active site of the optimized hPRMT5 crystal structure. Interacting amino acid residues are shown in blue stick format. (L) An equal number (0.5 × 10⁶) of normal B cells (resting or activated) or the indicated DLBCL cell lines (Pfeiffer and SUDHL-2) were treated with increasing concentrations of CMP5, and cell viability was determined by annexin V–propidium iodide (PI) staining and flow cytometry at 24 hours. (M) Normal B cells from 3 separate healthy donors were treated with increasing concentrations of CMP5 and cell death was determined by annexin V–PI staining and flow cytometry at 24, 48, and 72 hours. (N-O) A transformed cell line (60A) and an immortalized cell line (D-9) were treated with increasing concentrations of CMP5 and cell death was determined by annexin V–PI staining and flow cytometry at 24 and 48 hours. Data are shown as the percentage of annexin V PI cells (live cells) and are normalized to untreated control. *P < .05; **P < .01. Error bars indicate standard error of the mean (SEM).
Figure 3
Figure 3
PRMT5 inhibition prevents EBV-driven B-cell immortalization. (A-B) Purified normal B cells were infected with EBV and cultures were exposed to either lentivirus expressing PRMT5-specific siRNA or scramble RNA control. PRMT5 expression was assessed by confocal microscopy, and cell proliferation was assessed by uptake of [3H]-thymidine and flow cytometry. (C) Purified normal B cells were infected with EBV and, at various time points (days 4, 7, 14, and 21), cultures were exposed to DMSO, highly selective PRMT5 inhibitor (CMP5, 40 µM), or nonreactive control small-molecule CMP6 (40 µM). The effect of PRMT5 inhibition on EBV+ B-cell outgrowth was measured by absolute numbers of CD19+ cells over 35 days. *P < .05. Error bars indicate SEM.
Figure 4
Figure 4
PRMT5 transcript and miR96 are silenced in EBV-transformed cells and during B-cell immortalization. (A-B) PRMT5 messenger RNA (mRNA) expression was measured by qRT-PCR in resting B cells (RB), transformed B cells (A) and at various time points after EBV infection of normal B cells (B). C7M3 is a fully transformed LCL (B). The bar graph shows normalized fold expression of PRMT5 mRNA relative to normal B cells using glyceraldehyde-3-phosphate dehydrogenase (GAPDH) as internal control. (C-D) miR96 expression was measured by qRT-PCR in RB cells (RB), transformed B cells (C) and at various time points after EBV infection of normal B cells (D). JeKo is a MCL cell line used as control (C). The bar graph shows normalized fold expression of miR96 relative to normal B cells using GAPDH as internal control. **P < .01; ***P < .005. Error bars indicate SEM.
Figure 5
Figure 5
LMP1-mediated NF-κB activity coordinates a repressive complex to repress miR96 and promote PRMT5 expression. (A) miR96 expression was measured by qRT-PCR in a transformed LCL (60A) after LMP1 knockdown using 2 separate LMP1-specific shRNA preparations. Western blot showing the effect of LMP1 knockdown on LMP1 and PRMT5 expression is also included (bottom panel). LMP1 knockdown resulted in statistically significant increase of miR96 expression at 48 hours with both preparations. (B-C) Two transformed LCLs (60A and SR27) were incubated with the selective inhibitor of IkB kinase α (BAY11, 10 µM) and miR96 expression was evaluated by qRT-PCR. Exposure to BAY11 (10 µM) resulted in a statistically significant increase of miR96 expression at 4 hours in 60A cells and at 2 and 4 hours in SR27 compared with DMSO control. (D-E) The expression of PRMT5 and epigenetic mark, S2Me-H4R3, was evaluated by western blot and confocal microscopy in 60A cells incubated for 4 hours with BAY11 (10 µM). Actin was used as loading control and MCL-1 as control for BAY11 activity. (F-H) One immortalized (D-22) and 1 transformed LCL (60A) were incubated with a selective HDAC1,2 inhibitor (JQ12, 10 µM) (F), a broad-spectrum HDAC inhibitor (AR42, 1 µM) (G) and with a selective HDAC1,3 inhibitor (MS275, 2 µM) (H), or DMSO control. miR96 expression was evaluated by qRT-PCR at the indicated time points. The bar graph shows normalized fold expression of miR96 relative to untreated cells using GAPDH as internal control. *P < .05; **P < .01. Error bars indicate SEM. (I) Western blot of H3K14Ac in D-22 and 60A cells treated for 12 and 24 hours with MS275 (2 µM). Actin was used as loading control.
Figure 6
Figure 6
PRMT5 inhibition leads to miR96 transcriptional derepression. ChIP assays were performed on crosslinked chromatin from transformed B cells (60A and SR27) using either preimmune (PI) or the indicated immune antibodies, and the retained DNA was amplified by qPCR using miR96-specific primers and probe. Fold enrichment with each antibody was calculated relative to the PI sample. (A) ChIP findings showed significant enrichment of PRMT5 and its epigenetic marks (S2Me-H3R8 and S2Me-H4R3) at the miR96 promoter. (B-E) ChIP assays and qPCR showed that PRMT5 knockdown (shRNA) or inhibition (CMP5, 40 μM) in EBV-transformed LCL 60A led to loss of recruitment of the enzyme and its epigenetic marks to the miR96 promoter (B and C, respectively) and transcriptional derepression of miR96 (D and E, respectively). miR197 is a nonbinding miR used as control. (F-G) ChIP assays and qPCR showed that PRMT5 knockdown (shRNA) or inhibition (CMP5, 40 μM) in EBV-transformed LCL 60A led to enhanced recruitment of p65 and p300, loss of HDAC3 recruitment, and hyperacetylation of lysine marks on histones H3, H4, and H2B, changes consistent with restored transcriptional activity of miR96. ChIP experiments were repeated in SR27 cells with similar results. *P < .05; **P < .01. Error bars indicate SEM. (H) Nuclear extract (500 µg) from the immortalized cell line (D-22) and the fully transformed cell line 60A was immunoprecipitated using either preimmune (immunoglobulin G [IgG]) or anti-PRMT5 (top panel) or anti-p65 antibody (bottom panel), and bound proteins were analyzed by western blot analysis using anti-HDAC3, anti-PRMT5, anti-p300, or antip65 antibody. Input represents 50 µg of nuclear extract from indicated cell lines. Results indicate that treatment with PRMT5 inhibitor leads to physical deassociation between PRMT5 and HDAC3 with subsequent physical association between PRMT5 and p300. (I) Proposed schema for PRMT5 regulation of miR96 transcription and mir96 regulation of PRMT5 translation: LMP1-driven NF-κB–repressive complex, which includes PRMT5, p65, and HDAC3, binds to the miR96 promoter and leads to miR96 transcriptional silencing with subsequent enhanced PRMT5 translation. Inhibition of PRMT5 leads to: disruption of the PRMT5/p65/HDAC3-repressive complex, loss of recruitment to the miR96 promoter, enhanced association of p65 with the acetyltransferase p300, and recruitment of this activation complex to miR96 promoter. This leads to hyperacetylation of histone marks and miR96 re-expression which in turn leads to inhibition of PRMT5 translation and subsequent re-expression of critical regulatory/tumor suppressor genes.
Figure 7
Figure 7
PRMT5 inhibition restores regulation to the BCR pathway. (A-B) PTPROt mRNA expression was measured by qRT-PCR in resting B cells (RB), immortalized B cells generated from 3 separate donors (D-9, D-22, D-27) (A) and at various time points after EBV infection of normal B cells from 2 separate donors (D-33 and D-25) (B). The bar graph shows normalized fold expression of PTPROt mRNA relative to normal B cells using GAPDH as internal control. (C) PTPROt expression assessed by confocal microscopy in resting B cells as well as in the fully immortalized lymphoblastoid cell line (D-9). (D) ChIP assay was performed on crosslinked chromatin from immortalized (D-5, D-22) and transformed B cells (C7M3) using anti-PRMT5 antibody, and the retained DNA was amplified by qPCR using PTPROt-specific primers and probe. Fold enrichment was calculated relative to the input sample. Error bars represent standard deviation of triplicate measurements. (E) PTPROt mRNA expression and protein levels were evaluated by qRT-PCR (top) and confocal microscopy (bottom) in 2 immortalized cell lines (D-5 and D-22) incubated for 24 hours with either DMSO control or a highly selective PRMT5 inhibitor, compound 5 (CMP5, 40 µM). (F) Phosphotyrosine proteins immunoprecipitated from whole-cell extracts of 60A cells incubated for 24 hours with either DMSO or CMP5 (40 µM) were separated on sodium dodecyl sulfate–polyacrylamide gel electrophoresis (SDS-PAGE) and probed with anti-SYK antibody (top left) and anti-pY(416)SRC and SRC antibodies (top right). Whole-cell extracts of 60A cells incubated for 24 hours with wither DMSO, CMP5 (40 µM), or ibrutinib (250 nM) were separated on SDS-PAGE and probed with anti-pBTK antibody, anti-BTK or GAPDH antibodies (bottom). *P < .05; **P < .01; ***P < .005. Error bars indicate SEM.

References

    1. Hanahan D, Weinberg RA. Hallmarks of cancer: the next generation. Cell. 2011;144(5):646–674. - PubMed
    1. Young LS, Rickinson AB. Epstein-Barr virus: 40 years on. Nat Rev Cancer. 2004;4(10):757–768. - PubMed
    1. Aggarwal P, Vaites LP, Kim JK, et al. Nuclear cyclin D1/CDK4 kinase regulates CUL4 expression and triggers neoplastic growth via activation of the PRMT5 methyltransferase. Cancer Cell. 2010;18(4):329–340. - PMC - PubMed
    1. Jansson M, Durant ST, Cho EC, et al. Arginine methylation regulates the p53 response. Nat Cell Biol. 2008;10(12):1431–1439. - PubMed
    1. Karkhanis V, Hu YJ, Baiocchi RA, Imbalzano AN, Sif S. Versatility of PRMT5-induced methylation in growth control and development. Trends Biochem Sci. 2011;36(12):633–641. - PMC - PubMed

Publication types

MeSH terms

Associated data