

UCP1 is an essential mediator of the effects of methionine restriction on energy balance but not insulin sensitivity
- PMID: 25742717
- PMCID: PMC4447219
- DOI: 10.1096/fj.14-270348
UCP1 is an essential mediator of the effects of methionine restriction on energy balance but not insulin sensitivity
Abstract
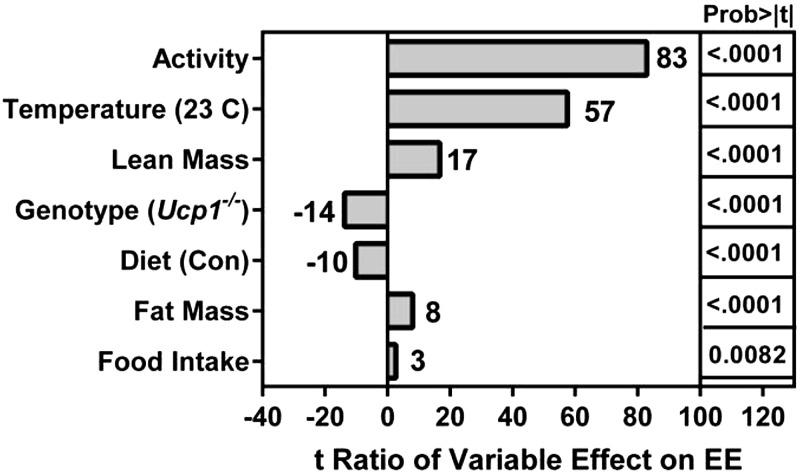
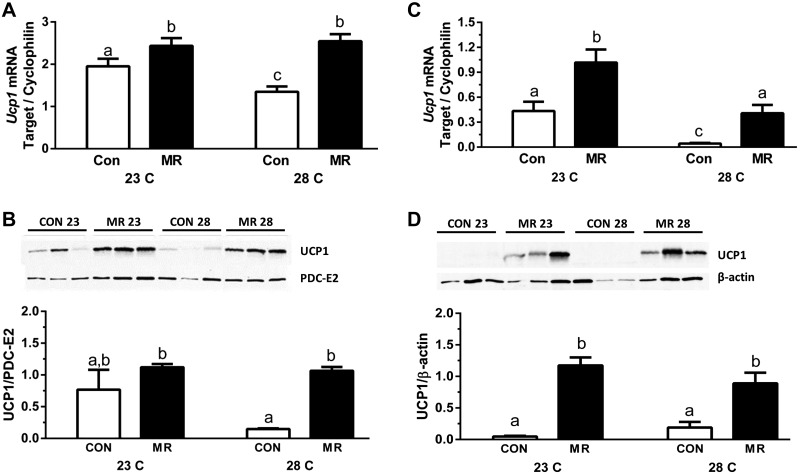
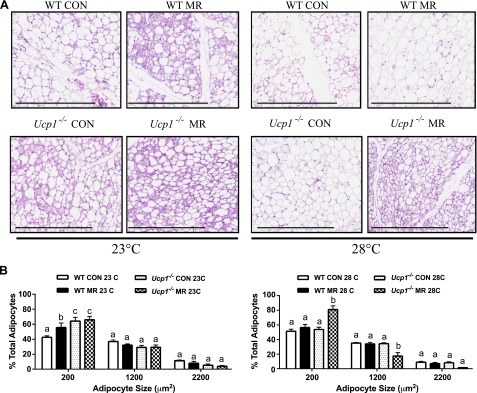
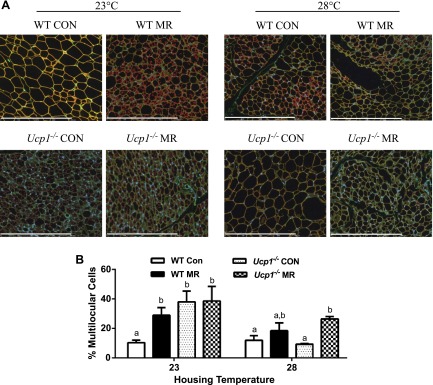
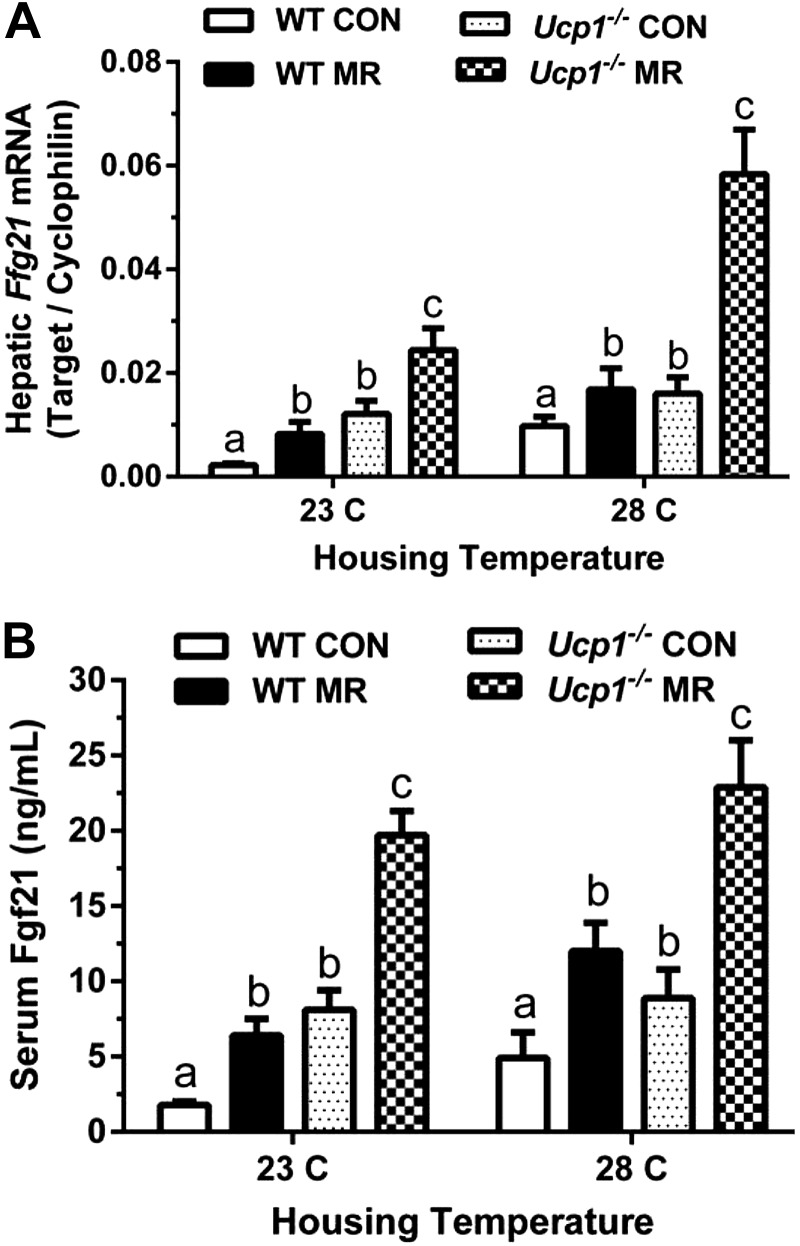
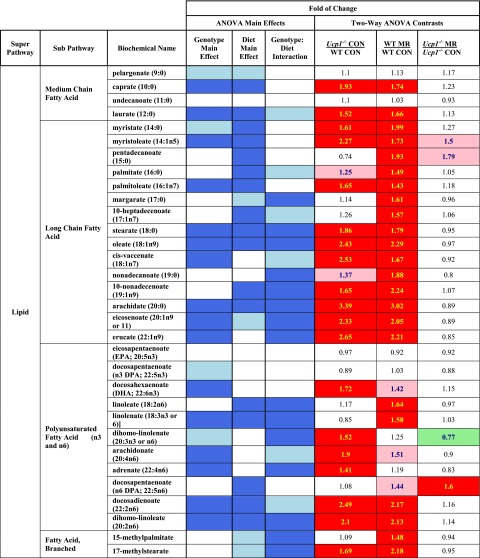
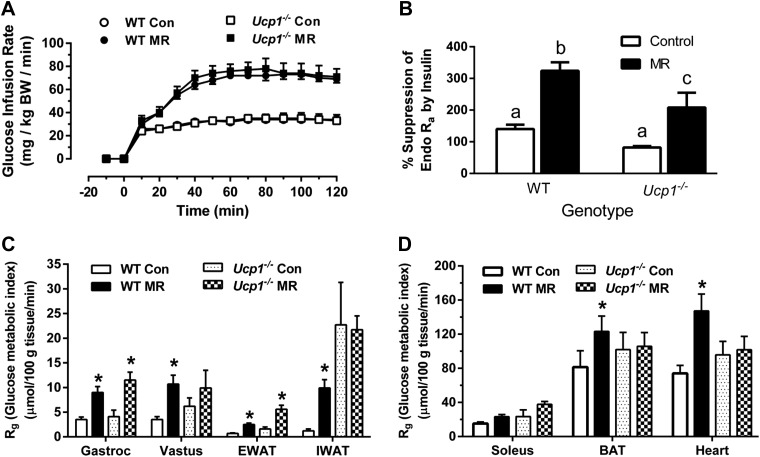
Dietary methionine restriction (MR) by 80% increases energy expenditure (EE), reduces adiposity, and improves insulin sensitivity. We propose that the MR-induced increase in EE limits fat deposition by increasing sympathetic nervous system-dependent remodeling of white adipose tissue and increasing uncoupling protein 1 (UCP1) expression in both white and brown adipose tissue. In independent assessments of the role of UCP1 as a mediator of MR's effects on EE and insulin sensitivity, EE did not differ between wild-type (WT) and Ucp1(-/-) mice on the control diet, but MR increased EE by 31% and reduced adiposity by 25% in WT mice. In contrast, MR failed to increase EE or reduce adiposity in Ucp1(-/-) mice. However, MR was able to increase overall insulin sensitivity by 2.2-fold in both genotypes. Housing temperatures used to minimize (28°C) or increase (23°C) sympathetic nervous system activity revealed temperature-independent effects of the diet on EE. Metabolomics analysis showed that genotypic and dietary effects on white adipose tissue remodeling resulted in profound increases in fatty acid metabolism within this tissue. These findings establish that UCP1 is required for the MR-induced increase in EE but not insulin sensitivity and suggest that diet-induced improvements in insulin sensitivity are not strictly derived from dietary effects on energy balance.
Keywords: FGF21; adipose tissue; amino acid; housing temperature; obesity.
© FASEB.
Figures
References
-
- Hasek B. E., Boudreau A., Shin J., Feng D., Hulver M., Van N. T., Laque A., Stewart L. K., Stone K. P., Wanders D., Ghosh S., Pessin J. E., Gettys T. W. (2013) Remodeling the integration of lipid metabolism between liver and adipose tissue by dietary methionine restriction in rats. Diabetes 62, 3362–3372 - PMC - PubMed
-
- Hasek B. E., Stewart L. K., Henagan T. M., Boudreau A., Lenard N. R., Black C., Shin J., Huypens P., Malloy V. L., Plaisance E. P., Krajcik R. A., Orentreich N., Gettys T. W. (2010) Dietary methionine restriction enhances metabolic flexibility and increases uncoupled respiration in both fed and fasted states. Am. J. Physiol. Regul. Integr. Comp. Physiol. 299, R728–R739 - PMC - PubMed
-
- Malloy V. L., Krajcik R. A., Bailey S. J., Hristopoulos G., Plummer J. D., Orentreich N. (2006) Methionine restriction decreases visceral fat mass and preserves insulin action in aging male Fischer 344 rats independent of energy restriction. Aging Cell 5, 305–314 - PubMed
-
- Munzberg, H., Henagan, T. M., and Gettys, T. W. (2013) Animal models of obesity: perspectives on evolution of strategies for the development and analysis of their phenotypes. In Handbook of Obesity, (Bray, G.A. and Bouchard, C., eds.), pp. 137–148, Informa Books, London
-
- Blaxter K. L. (1986) Bioenergetics and growth: the whole and the parts. J. Anim. Sci. 63 (Suppl. 2), 1–10 - PubMed
Publication types
MeSH terms
Substances
Grants and funding
- F32 DK098918/DK/NIDDK NIH HHS/United States
- R01 DK089641/DK/NIDDK NIH HHS/United States
- P20 RR021945/RR/NCRR NIH HHS/United States
- R01 DK096311/DK/NIDDK NIH HHS/United States
- P30 DK072476/DK/NIDDK NIH HHS/United States
- T32 DK064584/DK/NIDDK NIH HHS/United States
- 2P30 DK072476/DK/NIDDK NIH HHS/United States
- DK098687/DK/NIDDK NIH HHS/United States
- DK096311/DK/NIDDK NIH HHS/United States
- R01 DK098687/DK/NIDDK NIH HHS/United States
- DK089641/DK/NIDDK NIH HHS/United States
- P20 GM103528/GM/NIGMS NIH HHS/United States
- P30 GM118430/GM/NIGMS NIH HHS/United States
- U24 DK059637/DK/NIDDK NIH HHS/United States
LinkOut - more resources
Full Text Sources
Other Literature Sources
Molecular Biology Databases
Research Materials
