. 2015 Mar 10;6(7):5118-33.
doi: 10.18632/oncotarget.3007.

A melanoma subtype with intrinsic resistance to BRAF inhibition identified by receptor tyrosine kinases gene-driven classification

Affiliations

A melanoma subtype with intrinsic resistance to BRAF inhibition identified by receptor tyrosine kinases gene-driven classification

Matteo Dugo et al. Oncotarget. .

Abstract

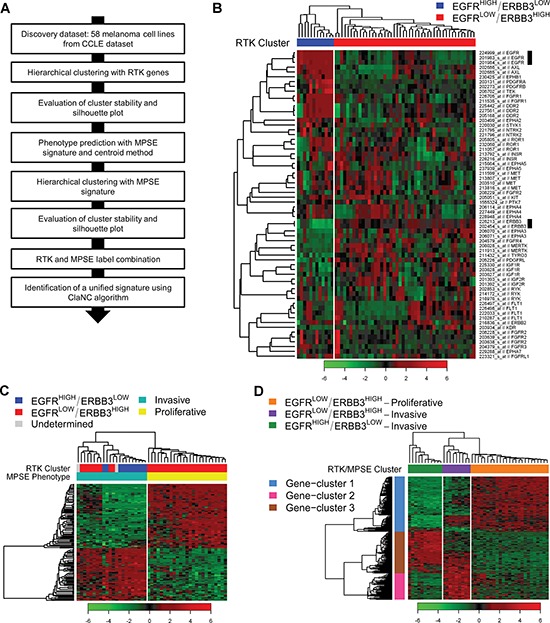
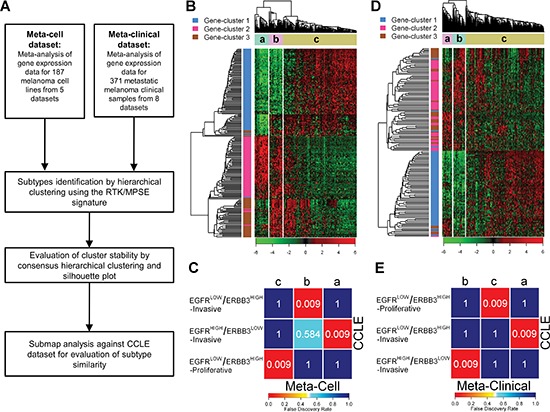
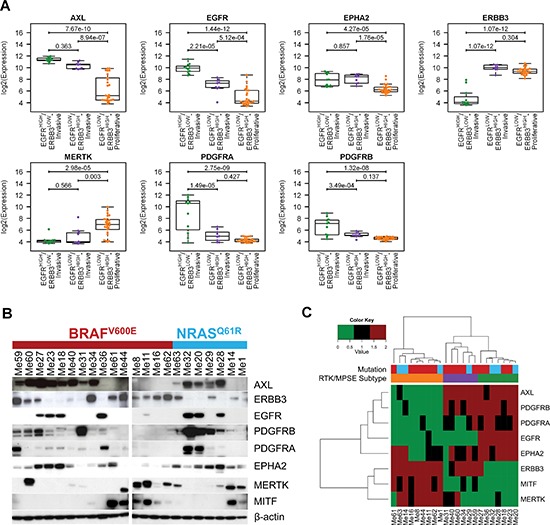
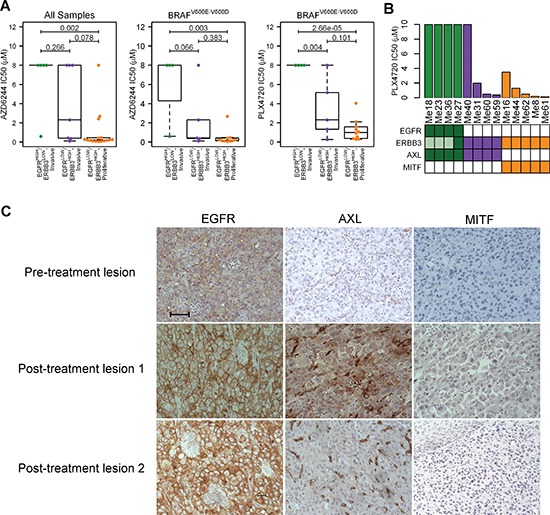
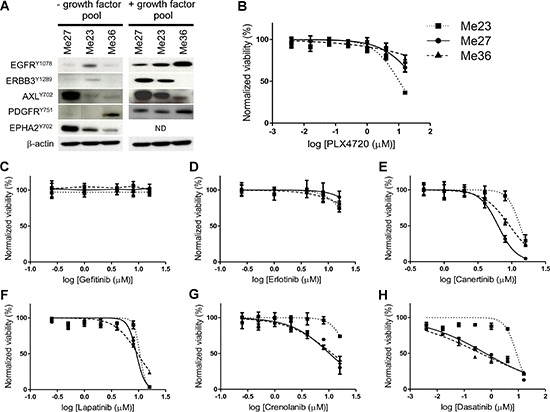
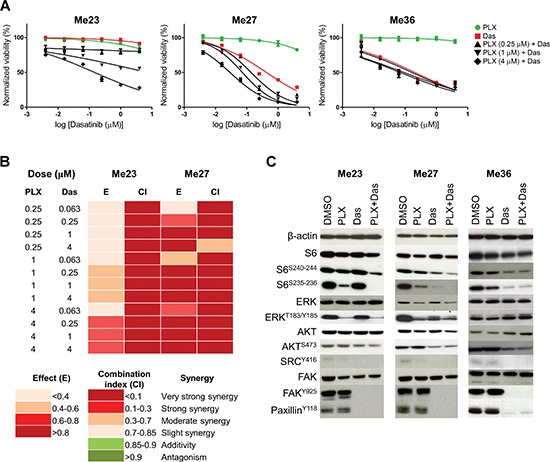
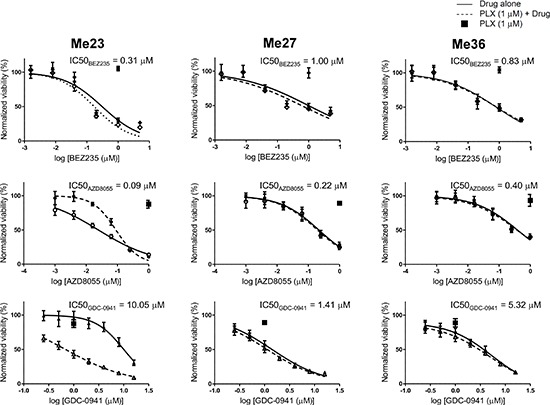
Dysregulation of receptor tyrosine kinases (RTKs) contributes to several aspects of oncogenesis including drug resistance. In melanoma, distinct RTKs have been involved in BRAF inhibitors (BRAFi) resistance, yet the utility of RTKs expression pattern to identify intrinsically resistant tumors has not been assessed. Transcriptional profiling of RTKs and integration with a previous classification, reveals three robust subtypes in two independent datasets of melanoma cell lines and one cohort of melanoma samples. This classification was validated by Western blot in a panel of patient-derived melanoma cell lines. One of the subtypes identified here for the first time displayed the highest and lowest expression of EGFR and ERBB3, respectively, and included BRAF-mutant tumors all intrinsically resistant to BRAFi PLX4720, as assessed by analysis of the Cancer Cell Line Encyclopedia pharmacogenomic study and by in vitro growth inhibition assays. High levels of EGFR were detected, even before therapy, in tumor cells of one of three melanoma patients unresponsive to BRAFi. Use of different pharmacological inhibitors highlighted the relevance of PI3K/mTOR signaling for growth of this PLX4720-resistant subtype. Our results identify a specific molecular profile of melanomas intrinsically resistant to BRAFi and suggest the PI3K/mTOR pathway as a potential therapeutic target for these tumors.

Keywords: BRAF; BRAF inhibitors; drug resistance; melanoma subtypes; receptor tyrosine kinases.


Conflict of interest statement

Conflict of interest

The authors declare that they have no conflict of interest.

Figures

Figure 1
Figure 1. Melanoma subtypes identification by class discovery in the CCLE dataset
(A) Workflow of bioinformatics analysis. (B) RTKs expression of 58 melanoma cell lines grouped by hierarchical clustering. Samples are separated in two major clusters named EGFRHIGH/ERBB3LOW (blue) and EGFRLOW/ERBB3HIGH (red). Black bars highlight EGFR and ERBB3 probe sets. (C) Hierarchically clustered heatmap showing the expression of MPSE genes in the 47 samples with a defined phenotype: light green, Invasive; yellow, Proliferative. RTK labels are shown for comparison. (D) Heatmap of the hierarchical clustering using the RTK/MPSE signature: EGFRHIGH/ERBB3LOW-Invasive (green); EGFRLOW/ERBB3HIGH-Invasive (violet); EGFRLOW/ERBB3HIGH-Proliferative (orange). The number of clustered samples, as detailed in the text, is forty-five. The 210 genes of the RTK/MPSE signature are grouped into three highly correlated clusters: 1, light-blue; 2, pink; 3, brown.
Figure 2
Figure 2. Subtypes validation in independent datasets
(A) Workflow of bioinformatic subtype validation. (B) and (D) Heatmap of hierarchical clustering of Meta-Cell (B) and Meta-Clinical (D) datasets according to the RTK/MPSE signature. In each dataset three clusters, indicated with letters a, b, c, were identified. (C) and (E) SubMap analysis for similarity assessment between clusters identified in Meta-Cell (C) and Meta-Clinical (E) and CCLE subtypes. The colors of the heatmap represent the false discovery rate, reported also numerically, which measure the similarity of the subtypes. Meta-Cell and CCLE datasets had 13 cell lines in common: 9 were assigned to the same subtype, 3 had an undetermined classification in one of the two datasets and 1 had a discordant classification.
Figure 3
Figure 3. Expression pattern of selected RTKs in melanoma subtypes
(A) Box-plot showing the distribution of log2 expression values of RTKs with the most significant differential expression according to melanoma subtypes in CCLE dataset. Statistical analysis by ANOVA followed by Tukey's post-hoc test. (B) Western blot analysis of the seven most relevant RTKs and MITF in the panel of 22 melanoma cell lines. The BRAF and NRAS mutational status is reported. Since preliminary results indicated that levels of RTKs were not affected by culture conditions such as serum-free or serum-containing medium, all analyses were performed by cells grown under standard culture conditions. (C) Heatmap representing the hierarchical clustering of protein expression investigated in panel (B) for 22 melanoma cell lines. The RTK/MPSE subtype and mutational status are reported and are colored as in (A) and (B) respectively.
Figure 4
Figure 4. Identification of the EGFRHIGH/ERBB3LOW-Invasive melanoma subtype as intrinsically resistant to BRAFi
(A) Box-plot displaying the distribution of IC50 values for AZD6244 and PLX4720 in CCLE dataset according to RTK/MPSE subtypes. For AZD6244, data considering all samples (left panel) or BRAF mutated only (middle panel) are shown. For PLX4720, only samples with BRAF mutations (V600E or V600D) were selected (right panel). Statistical analysis by ANOVA followed by Tukey's post-hoc test. (B) PLX4720 IC50 values of BRAFV600E melanoma cell lines representative of the different subtypes (green: EGFRHIGH/ERBB3LOW-Invasive; violet: EGFRLOW/ERBB3HIGH-Invasive; orange: EGFRLOW/ERBB3HIGH-Proliferative). Expression of EGFR, ERBB3, AXL and MITF is summarized from Figure 3B. Presence of the corresponding protein is indicated by full colored boxes; absence as empty box. For ERBB3, shaded boxes indicate low expression. (C) EGFR, AXL and MITF staining in serial sections of pre- and post-treatment melanoma specimens from a patient intrinsically resistant to Vemurafenib treatment (Patient P3). 20x magnification. Scale bar = 100 μm.
Figure 5
Figure 5. RTK activation and effect of RTKs inhibitors on BRAFV600E EGFRHIGH/ERBB3LOW-Invasive melanoma cell lines
(A) Basal RTK and ligand induced phosphorylation. Melanoma cell lines were cultured overnight in the absence of serum and stimulated for 10 minutes with serum-free medium or with medium containing a pool of growth factors: EGF, NRG1-β1/HRG1-β1, PDGF (all at 100 ng/ml) and GAS6 500 ng/ml. All RTKs were basally phosphorylated, although at different level, in Me27; all, except PDGFR, in Me23; all, except PDGFR and ERBB3, in Me36. Ligand stimulation increased or induced phosphorylation of all RTKs with the exception of ERBB3 for Me36. (B–H) Representative growth curves, based on alamarBlue viability assays, of Me23, Me27 and Me 36 following a 72 h treatment with the indicated inhibitor. Means and standard deviations of three replicates are shown. Normalized viability (%) is relative to vehicle-treated (DMSO) control cells.
Figure 6
Figure 6. Effect of Dasatinib and Dasatinib/PLX4720 combination on BRAFV600E EGFRHIGH/ERBB3LOW-Invasive melanoma cell lines
(A) Dose-response curves to Dasatinib, PLX4720 and their combination. Dasatinib IC50 was 8.54 μM for Me23, 0.6 μM for Me27 and 0.41 μM for Me36. Data shown are means and standard deviations of three replicates. (B) Drug interaction analysis by Chou and Talalay method. Shown are color-coded fraction affected values (effect, E) and combination indexes (CI) for Me23 and Me27 at the indicated drug combination doses. The color-code is shown at the bottom of the panel. (C) Effects of a 24 h treatment with PLX4720 (PLX, 1 μM), Dasatinib (Das, 0.25 μM) and their combination (PLX+Das) on phosphorylation of signaling molecules in Me23, Me27 and Me36. The combination between PLX4720 and Dasatinib reduced phosphorylation of S6 (S235–236 and S240–244) in comparison to single drugs when growth inhibitory effect was synergistic (Me23 and Me27). Controls are vehicle (DMSO) treated cells.
Figure 7
Figure 7. PI3K/mTOR inhibitors reduce viability of BRAFV600E EGFRHIGH/ERBB3LOW-Invasive melanoma cell lines
Dose-response curves of Me23, Me27 and Me36 to BEZ235, GDC-0941, AZD8055 alone or in combination with PLX4720 (1 μM). Data shown are means and standard deviations of three replicates. Normalized viability (%) is relative to vehicle-treated (DMSO) controls. For each cell line, IC50 values of PI3K and/or mTOR inhibitors are listed above each graph.

Similar articles

Cited by

References

    1. Davies H, Bignell GR, Cox C, Stephens P, Edkins S, Clegg S, Teague J, Woffendin H, Garnett MJ, Bottomley W, Davis N, Dicks E, Ewing R, et al. Mutations of the BRAF gene in human cancer. Nature. 2002;417:949–954. - PubMed
    1. Tsai J, Lee JT, Wang W, Zhang J, Cho H, Mamo S, Bremer R, Gillette S, Kong J, Haass NK, Sproesser K, Li L, Smalley KS, et al. Discovery of a selective inhibitor of oncogenic B-Raf kinase with potent antimelanoma activity. Proc Natl Acad Sci USA. 2008;105:3041–3046. - PMC - PubMed
    1. Rheault TR, Stellwagen JC, Adjabeng GM, Hornberger KR, Petrov KG, Waterson AG, Dickerson SH, Mook RA, Jr, Laquerre SG, King AJ, Rossanese OW, Arnone MR, Smitheman KN, et al. Discovery of Dabrafenib: A Selective Inhibitor of Raf Kinases with Antitumor Activity against B-Raf-Driven Tumors. ACS Med Chem Lett. 2013;4:358–362. - PMC - PubMed
    1. Chapman PB, Hauschild A, Robert C, Haanen JB, Ascierto P, Larkin J, Dummer R, Garbe C, Testori A, Maio M, Hogg D, Lorigan P, Lebbe C, et al. Improved survival with vemurafenib in melanoma with BRAF V600E mutation. N Engl J Med. 2011;364:2507–2516. - PMC - PubMed
    1. Hauschild A, Grob JJ, Demidov LV, Jouary T, Gutzmer R, Millward M, Rutkowski P, Blank CU, Miller WH, Jr, Kaempgen E, Martin-Algarra S, Karaszewska B, Mauch C, et al. Dabrafenib in BRAF-mutated metastatic melanoma: a multicentre, open-label, phase 3 randomised controlled trial. Lancet. 2012;380:358–365. - PubMed

Publication types

MeSH terms

Substances