. 2015 Feb 14:14:38.
doi: 10.1186/s12943-015-0316-2.

High MACC1 expression in combination with mutated KRAS G13 indicates poor survival of colorectal cancer patients

Affiliations

High MACC1 expression in combination with mutated KRAS G13 indicates poor survival of colorectal cancer patients

Katharina Ilm et al. Mol Cancer. .

Abstract

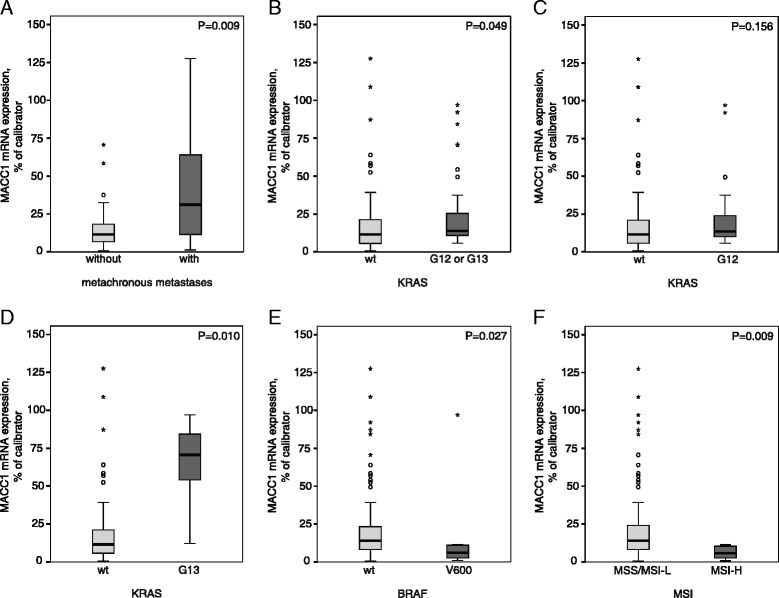
Background: The metastasis-associated in colon cancer 1 (MACC1) gene has been identified as prognostic biomarker for colorectal cancer (CRC). Here, we aimed at the refinement of risk assessment by separate and combined survival analyses of MACC1 expression with any of the markers KRAS mutated in codon 12 (KRAS G12) or codon 13 (KRAS G13), BRAF V600 mutation and MSI status in a retrospective study of 99 CRC patients with tumors UICC staged I, II and III.

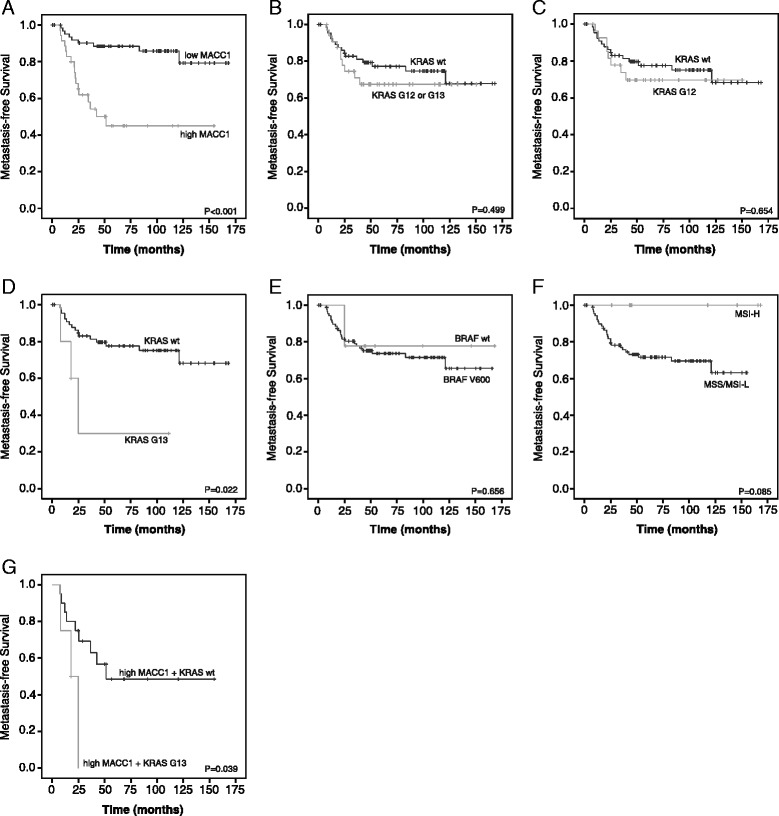
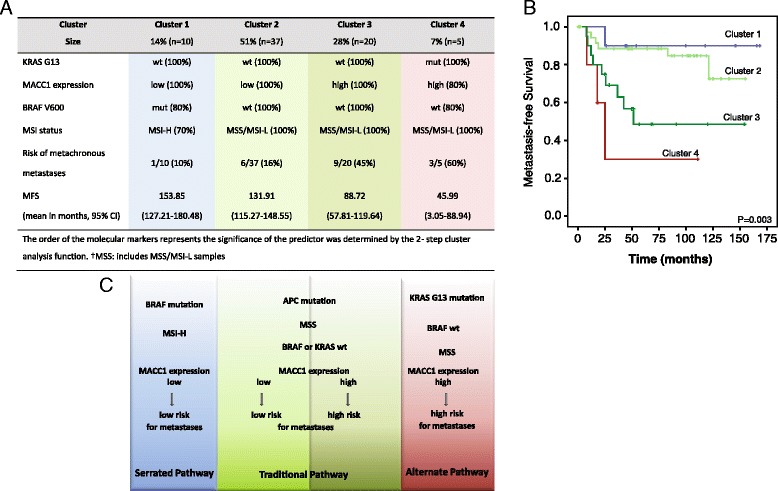
Findings: We showed that only high MACC1 expression (HR: 6.09, 95% CI: 2.50-14.85, P < 0.001) and KRAS G13 mutation (HR: 5.19, 95% CI: 1.06-25.45, P = 0.042) were independent prognostic markers for shorter metastasis-free survival (MFS). Accordingly, Cox regression analysis revealed that patients with high MACC1 expression and KRAS G13 mutation exhibited the worst prognosis (HR: 14.48, 95% CI: 3.37-62.18, P < 0.001). Patients were classified based on their molecular characteristics into four clusters with significant differences in MFS (P = 0.003) by using the SPSS 2-step cluster function and Kaplan-Meier survival analysis.

Conclusion: According to our results, patients with high MACC1 expression and mutated KRAS G13 exhibited the highest risk for metachronous metastases formation. Moreover, we demonstrated that the "Traditional pathway" with an intermediate risk for metastasis formation can be further subdivided by assessing MACC1 expression into a low and high risk group with regard to MFS prognosis. This is the first report showing that identification of CRC patients at high risk for metastasis is possible by assessing MACC1 expression in combination with KRAS G13 mutation.


Figures

Figure 1
Figure 1
Associations of MACC1 expression with KRAS mutation, BRAF mutation or MSI status. MACC1 mRNA expression levels of the tumors were quantified using quantitative reverse transcriptase PCR [9]. Tumor DNA was extracted and subjected to PCR for amplification of KRAS and BRAF sequences and analyzed by sequencing [15]. MSI Analysis System was used for MSI status determination as described previously [16]. Tumors were discriminated in Microsatellite stable (MSS)/MSI-low (MSI-L; 0 or 1 markers demonstrating instability) or MSI-High (MSI-H; two or more markers instable). A Significantly increased MACC1 mRNA expression levels were detected in primary tumors of patients with metachronous metastases (P = 0.009). B MACC1 expression level was significantly increased in KRAS mutated (G12 or G13) tumors compared to tumors with KRAS wild type (KRAS wt) (P = 0.049). C There were no significant differences of MACC1 expression in KRAS G12 mutated compared to KRAS wt tumors (P = 0.156). D Primary tumors harboring G13 mutated KRAS showed a significantly increased MACC1 expression level (P = 0.010). E In BRAF wt tumors MACC1 expression was significantly increased compared to BRAF V600 mutated tumors (P = 0.027). F MACC1 expression of MSS/MSI-L tumors was significantly increased compared to MSI-H tumors (P = 0.009). Significance in differential mRNA expression was determined by Mann–Whitney U-test. Calculation of q-values from the corresponding P-values was performed to control for the false discovery rate (FDR) [17]. FDR-adjusted P-values less than 0.05 were considered to be statistically significant.
Figure 2
Figure 2
Patients’ metastasis-free survival prognosis according to MACC1 mRNA expression, KRAS mutation, BRAF mutation and MSI status. The Kaplan–Meier method was used to estimate cumulative survival rates. MFS time was defined as the time period from the date of surgery to the date of confirmed distant metastases or to the date of last follow-up contact/death for censored patients. A Patients with high MACC1 expression exhibited a statistically significant reduced MFS (P < 0.001). B No significant differences of MFS between KRAS mutated (G12 or G13) and KRAS wt tumors (P = 0.499) were detected. C KRAS G12 mutation showed no significant impact on MFS prognosis (P = 0.654). D MFS of patients with KRAS G13 mutated tumors compared to patients with KRAS wt was significantly reduced (P = 0.022). E There was no significant impact of BRAF V600 mutation on MFS prognosis (P = 0.656). F In MSS/MSI-L tumors we observed a tendency of shorter MFS (P = 0.085) compared to MSI-H tumors, but differences were not significant. G Tumors with high MACC1 expression and KRAS G13 exhibited the shortest MFS (mean: 19.0 months) compared to tumors with high MACC1 expression and KRAS wt (mean: 88.7 months, P = 0.039). Significance of differences in survival rates were assessed using the Log Rank test. P-values less than 0.05 were considered to be statistically significant.
Figure 3
Figure 3
Classification of CRC patients with regard to their molecular characterization. A Integrative 2-step cluster analyses allowed the differentiation of four clusters with regard to their tumor characteristics. Clustering of the tumors concerning KRAS G13 mutation, MACC1 expression, BRAF V600 mutation and MSI status was performed by the SPSS 2-step cluster function. The order of the molecular markers represents the significance of the predictor was determined by the 2- step cluster analysis function. †MSS: includes MSS/MSI-L samples. B Kaplan-Meier survival analysis revealed significantly different survival times for the four clusters (P = 0.003). Patients of Cluster 1 had the best prognosis and patients in Cluster 4 had the worst prognosis. C According to Leggett and Whitehall [2] Cluster 1 (in blue) represents the “Serrated pathway” which is characterized by the lowest risk (10%) for metastasis formation. Cluster 2 and Cluster 3 belong to the “Traditional pathway” (in green) with intermediate risk for metastasis formation. Here, we show that MACC1 expression subdivides this cluster into a low risk (16%, light green) and high risk (45%, dark green) group. The highest risk (60%) patients were classified in Cluster 4 representing the “Alternate pathway” (in red). According to our results these tumors are now characterized by a high MACC1 expression and mutated KRAS G13.

Similar articles

Cited by

References

    1. Ferlay J, Soerjomataram II, Dikshit R, Eser S, Mathers C, Rebelo M, et al. Cancer incidence and mortality worldwide: sources, methods and major patterns in GLOBOCAN 2012. Int J Cancer. 2015;136:E359–86. doi: 10.1002/ijc.29210. - DOI - PubMed
    1. Leggett B, Whitehall V. Role of the serrated pathway in colorectal cancer pathogenesis. Gastroenterology. 2010;138:2088–100. doi: 10.1053/j.gastro.2009.12.066. - DOI - PubMed
    1. Markowitz SD, Bertagnolli MM. Molecular origins of cancer: Molecular basis of colorectal cancer. N Engl J Med. 2009;361:2449–60. doi: 10.1056/NEJMra0804588. - DOI - PMC - PubMed
    1. Worthley D-L, Whitehall V-L, Spring K-J, Leggett B-A. Colorectal carcinogenesis: road maps to cancer. World J Gastroenterol. 2007;13:3784–91. - PMC - PubMed
    1. Fearon ER, Vogelstein B. A genetic model for colorectal tumorigenesis. Cell. 1990;61:759–67. doi: 10.1016/0092-8674(90)90186-I. - DOI - PubMed

Publication types

MeSH terms