

Whole-genome sequence-based analysis of thyroid function
- PMID: 25743335
- PMCID: PMC4366514
- DOI: 10.1038/ncomms6681
Whole-genome sequence-based analysis of thyroid function
Erratum in
-
Erratum: Whole-genome sequence-based analysis of thyroid function.Nat Commun. 2015 May 20;6:7172. doi: 10.1038/ncomms8172. Nat Commun. 2015. PMID: 25989729 Free PMC article. No abstract available.
Abstract
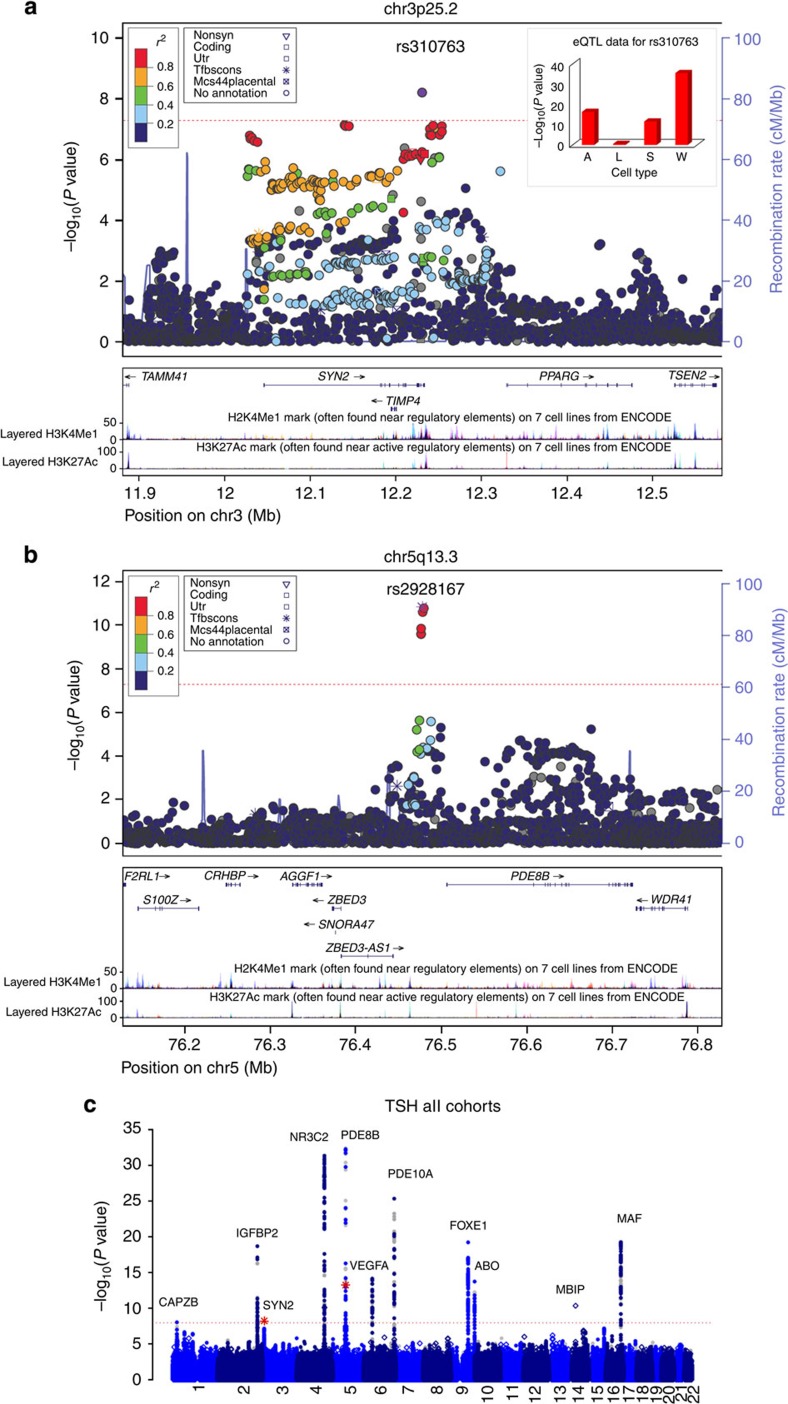
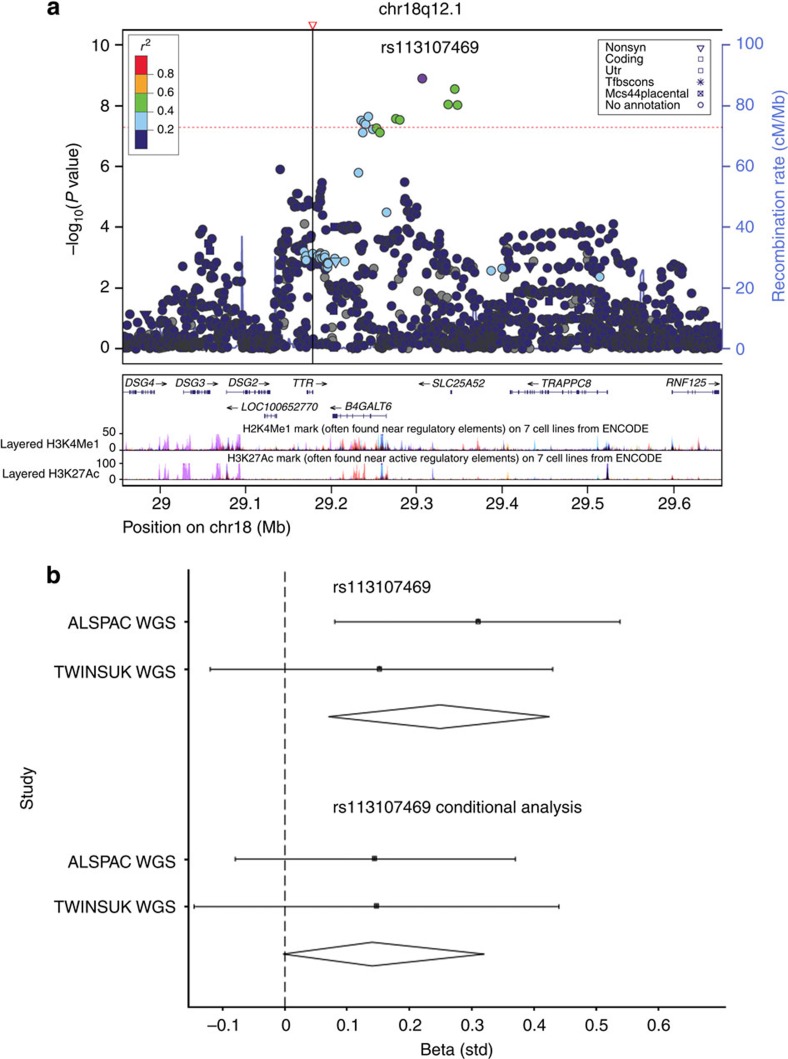
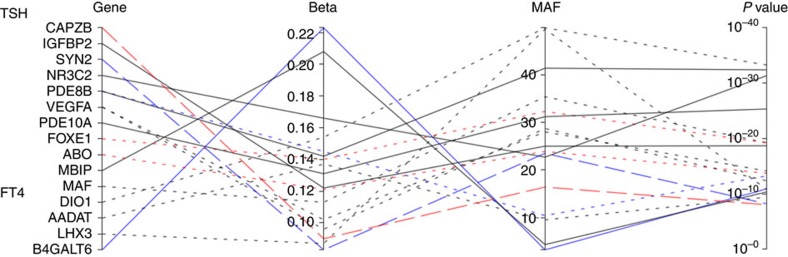
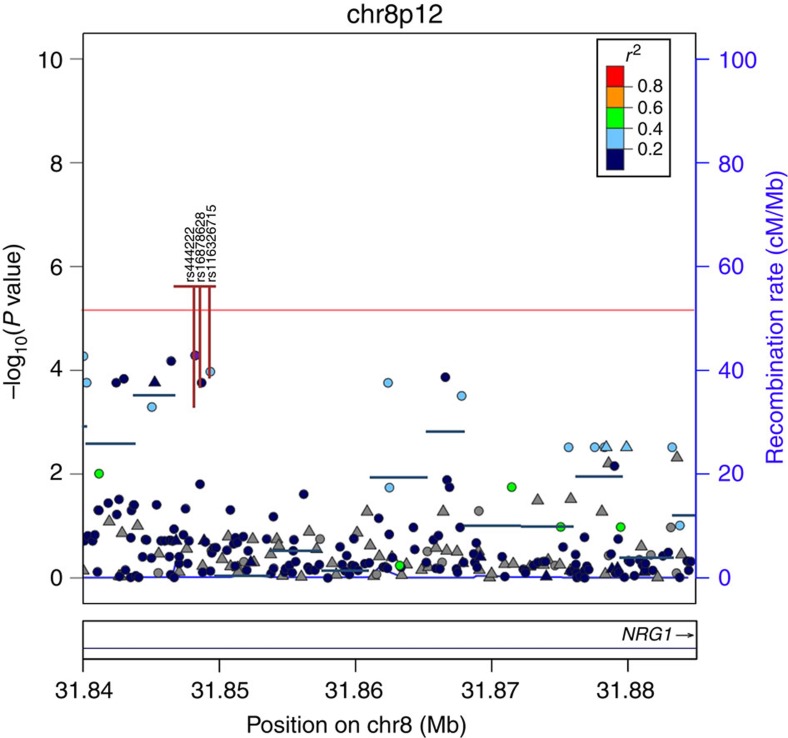
Normal thyroid function is essential for health, but its genetic architecture remains poorly understood. Here, for the heritable thyroid traits thyrotropin (TSH) and free thyroxine (FT4), we analyse whole-genome sequence data from the UK10K project (N=2,287). Using additional whole-genome sequence and deeply imputed data sets, we report meta-analysis results for common variants (MAF≥1%) associated with TSH and FT4 (N=16,335). For TSH, we identify a novel variant in SYN2 (MAF=23.5%, P=6.15 × 10(-9)) and a new independent variant in PDE8B (MAF=10.4%, P=5.94 × 10(-14)). For FT4, we report a low-frequency variant near B4GALT6/SLC25A52 (MAF=3.2%, P=1.27 × 10(-9)) tagging a rare TTR variant (MAF=0.4%, P=2.14 × 10(-11)). All common variants explain ≥20% of the variance in TSH and FT4. Analysis of rare variants (MAF<1%) using sequence kernel association testing reveals a novel association with FT4 in NRG1. Our results demonstrate that increased coverage in whole-genome sequence association studies identifies novel variants associated with thyroid function.
Figures
References
-
- Dumont J. et al. Ontogeny, anatomy, metabolism and physiology of the thyroid. Thyroid Dis. Manag Available at http://www.thyroidmanager.org/chapter/ontogeny-anatomy-metabolismand-phy... (2011).
-
- Haddow J. E. et al. Maternal thyroid deficiency during pregnancy and subsequent neuropsychological development of the child. New Engl. J. Med. 341, 549–555 (1999). - PubMed
-
- Vanderpump M. P. The epidemiology of thyroid disease. Br. Med. Bull. 99, 39–51 (2011). - PubMed
-
- Hadlow N. C. et al. The relationship between TSH and free T4 in a large population is complex and nonlinear and differs by age and sex. J. Clin. Endocrinol. Metab. 98, 2936–2943 (2013). - PubMed
-
- Taylor P. N., Razvi S., Pearce S. H. & Dayan C. M. A review of the clinical consequences of variation in thyroid function within the reference range. J. Clin. Endocrinol. Metab. 98, 3562–3571 (2013). - PubMed
Publication types
MeSH terms
Substances
Grants and funding
- MR/K006215/1/MRC_/Medical Research Council/United Kingdom
- MC_UU_12013/3/MRC_/Medical Research Council/United Kingdom
- MC_UU_12012/5/MRC_/Medical Research Council/United Kingdom
- 102215/WT_/Wellcome Trust/United Kingdom
- WT091310/WT_/Wellcome Trust/United Kingdom
- 096599/WT_/Wellcome Trust/United Kingdom
- MC_U106179472/MRC_/Medical Research Council/United Kingdom
- RG/10/17/28553/BHF_/British Heart Foundation/United Kingdom
- MC_UU_12013/4/MRC_/Medical Research Council/United Kingdom
- 095515/WT_/Wellcome Trust/United Kingdom
- 100574/WT_/Wellcome Trust/United Kingdom
- MR/L010305/1/MRC_/Medical Research Council/United Kingdom
- MC_UU_12013/8/MRC_/Medical Research Council/United Kingdom
- MC_UU_12013/2/MRC_/Medical Research Council/United Kingdom
- MC_PC_15018/MRC_/Medical Research Council/United Kingdom
- MC_UU_12015/2/MRC_/Medical Research Council/United Kingdom
- 098498/WT_/Wellcome Trust/United Kingdom
- 100140/WT_/Wellcome Trust/United Kingdom
- 091551/WT_/Wellcome Trust/United Kingdom
LinkOut - more resources
Full Text Sources
Other Literature Sources
Research Materials
Miscellaneous
