. 2015 Jul;32(7):1748-66.
doi: 10.1093/molbev/msv053. Epub 2015 Mar 4.

Neighboring Genes Show Correlated Evolution in Gene Expression

Affiliations

Neighboring Genes Show Correlated Evolution in Gene Expression

Avazeh T Ghanbarian et al. Mol Biol Evol. 2015 Jul.

Abstract

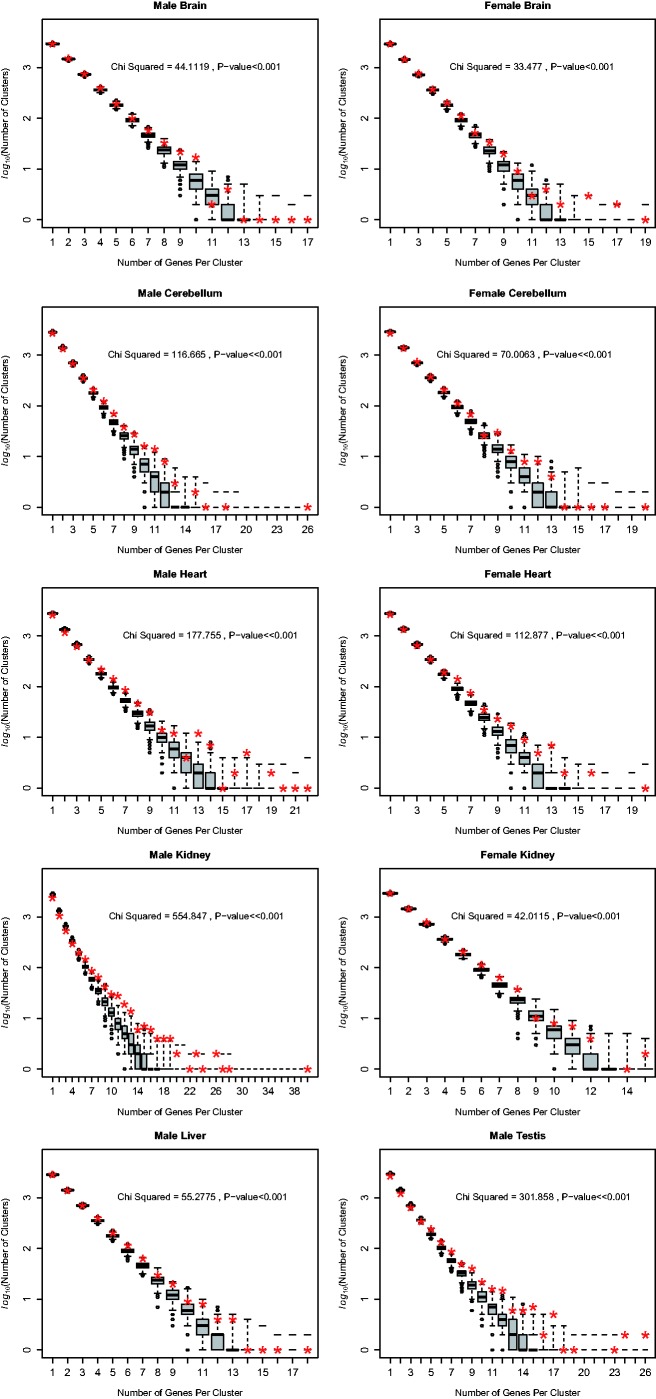
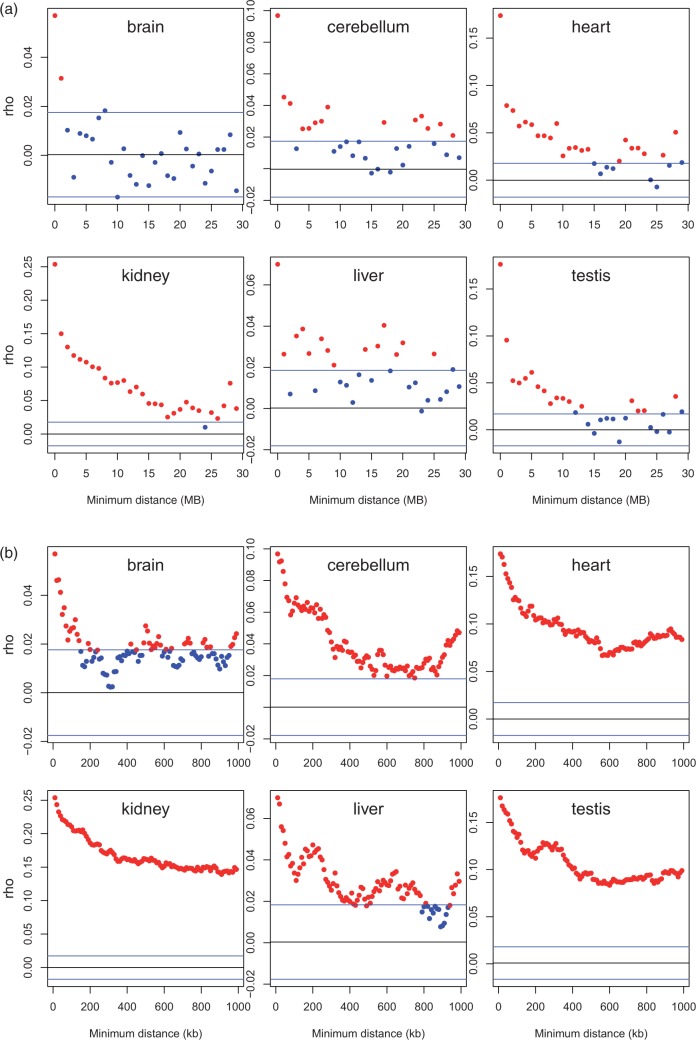
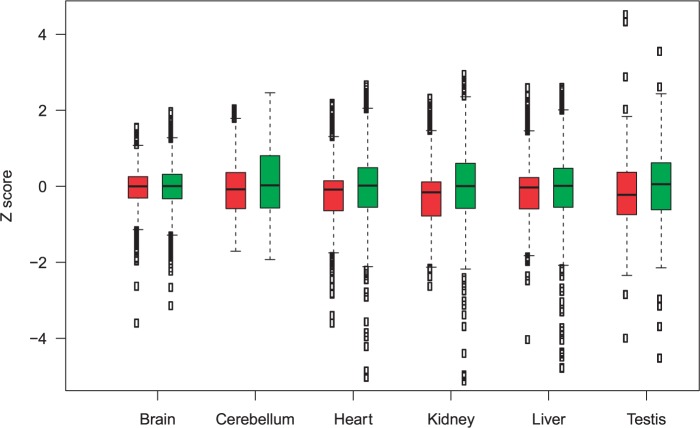
When considering the evolution of a gene's expression profile, we commonly assume that this is unaffected by its genomic neighborhood. This is, however, in contrast to what we know about the lack of autonomy between neighboring genes in gene expression profiles in extant taxa. Indeed, in all eukaryotic genomes genes of similar expression-profile tend to cluster, reflecting chromatin level dynamics. Does it follow that if a gene increases expression in a particular lineage then the genomic neighbors will also increase in their expression or is gene expression evolution autonomous? To address this here we consider evolution of human gene expression since the human-chimp common ancestor, allowing for both variation in estimation of current expression level and error in Bayesian estimation of the ancestral state. We find that in all tissues and both sexes, the change in gene expression of a focal gene on average predicts the change in gene expression of neighbors. The effect is highly pronounced in the immediate vicinity (<100 kb) but extends much further. Sex-specific expression change is also genomically clustered. As genes increasing their expression in humans tend to avoid nuclear lamina domains and be enriched for the gene activator 5-hydroxymethylcytosine, we conclude that, most probably owing to chromatin level control of gene expression, a change in gene expression of one gene likely affects the expression evolution of neighbors, what we term expression piggybacking, an analog of hitchhiking.

Keywords: gene clustering; gene expression evolution; sex-biased evolution.


Figures

F<sc>ig</sc>. 1.
Fig. 1.
Relationship between Z of a focal gene and Z of the nearest downstream neighbor for six male tissues. In this instance we consider all genes are nearest downstream neighbors if the distance between the start codons is <100 kb. This slightly contrasts with data in table 1, where the distance is defined as minimum distance between gene bodies. Trends are robust to alternative definitions. Data are split into equal sized bins (of 500 genes) defined after rank ordering with respect to Z score of the focal gene. The value on the X axis represents the mean Z of the genes in that bin. The value of the Y axis indicates the mean (±SEM) for the relevant flanking genes. The presented statistics are from Spearman correlation on raw data.
F<sc>ig</sc>. 2.
Fig. 2.
Numbers of clusters of a given size compared to that expected under a random null. Observed number of clusters including certain number of genes is shown by red stars, boxplots show variation across number of clusters in 1,000 random sets.
F<sc>ig</sc>. 3.
Fig. 3.
Correlation between Z of each focal gene and Z of nearest downstream neighbor more than a given minimum physical distance away. (a) We plot data considering increments of minimum distance 1 MB at a time up to a maximum of 30 MB. (b) We consider 10-kb increments up to a maximum of 1 MB. For each focal gene we extract the nearest neighbor downstream that is at least the distance x away, x being the units on the x axis. From a list of focal and neighbor Z scores, we consider then the correlation between these. Correlations significant at the 0.05 level are shown in red, otherwise in blue. The blue horizontal lines indicate 1.96 SD limits determined by randomization (which should in principle correspond with the P from Spearman’s ρ), with the black line indicating mean of null expectation from randomization (which should be around zero).
F<sc>ig</sc>. 4.
Fig. 4.
Z scores of genes in and out of lamina domains across six tissues. All pairwise comparisons are highly significant (before multitest correction, Mann–Whitney U test P < 10−9 except brain P = 4 × 10⁻⁴). Z score of the genes on Lamina domains are shown with boxplots in red and the rest are in green. Genes with very high or very low Z are excluded from the plot as outliers to improve presentation but have been included in Mann–Whitney U test.
F<sc>ig</sc>. 5.
Fig. 5.
The extent of local correlation in sex-biased expression change for four tissues. Method is the same as that for figure 3, excepting that here we employ standardized residuals of the orthologous regression on Z between sexes (rather than Z). We consider all focal genes and the correlation between residuals of Z scores for these genes and the nearest downstream gene on the same chromosome a minimum of x base pairs away. Correlations significant at the 0.05 level are shown in red, otherwise in blue. The blue horizontal lines indicate 1.96 SD limits determined by randomization, with the black line indicating mean of null expectation (which should be around zero).

Similar articles

Cited by

References

    1. Barton RA, Venditti C. Rapid evolution of the cerebellum in humans and other great apes. Curr Biol. 2014;24:2440–2444. - PubMed
    1. Batada NN, Urrutia AO, Hurst LD. Chromatin remodelling is a major source of coexpression of linked genes in yeast. Trends Genet. 2007;23:480–484. - PubMed
    1. Bernstein BE, Birney E, Dunham I, Green E, Gunter C, Snyder M. An integrated encyclopedia of DNA elements in the human genome. Nature. 2012;489:57–74. - PMC - PubMed
    1. Birnbaum K, Shasha D, Wang J, Jung J, Lambert G, Galbraith D, Benfey P. A gene expression map of the Arabidopsis root. Science. 2003;302:1956–1960. - PubMed
    1. Blumenthal T, Evans D, Link C, Guffanti A, Lawson D, Thierry-Mieg J, Thierry-Mieg D, Chiu W, Duke K, Kiraly M, et al. A global analysis of Caenorhabditis elegans operons. Nature. 2002;417:851–854. - PubMed

Publication types

MeSH terms