. 2015 Oct;22(10):1676-86.
doi: 10.1038/cdd.2015.16. Epub 2015 Mar 6.

Neuronal NLRP1 inflammasome activation of Caspase-1 coordinately regulates inflammatory interleukin-1-beta production and axonal degeneration-associated Caspase-6 activation

Affiliations

Neuronal NLRP1 inflammasome activation of Caspase-1 coordinately regulates inflammatory interleukin-1-beta production and axonal degeneration-associated Caspase-6 activation

V Kaushal et al. Cell Death Differ. 2015 Oct.

Abstract

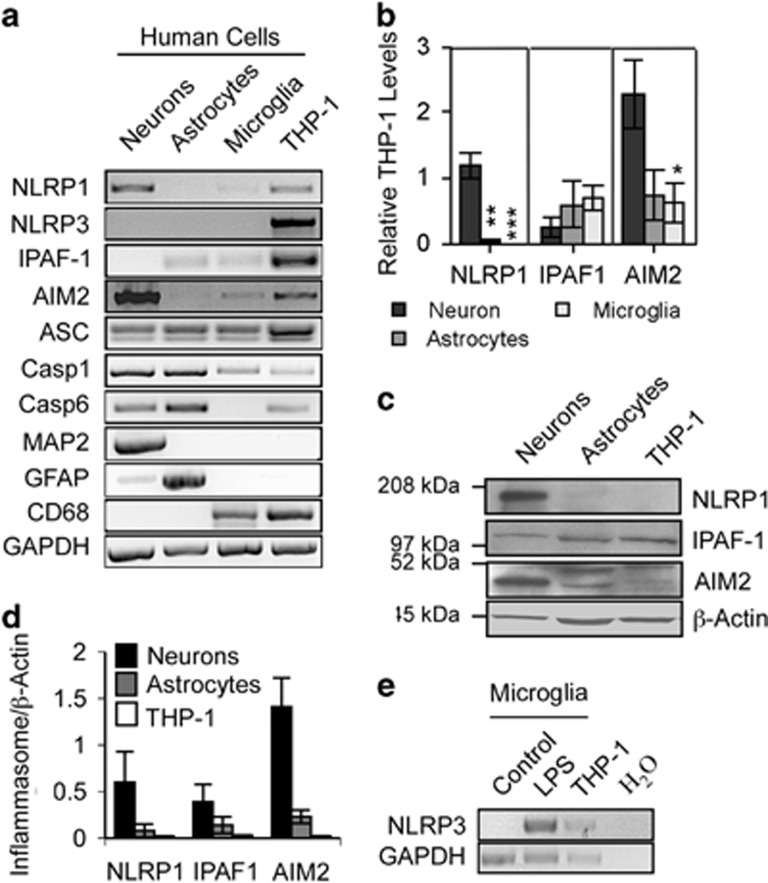
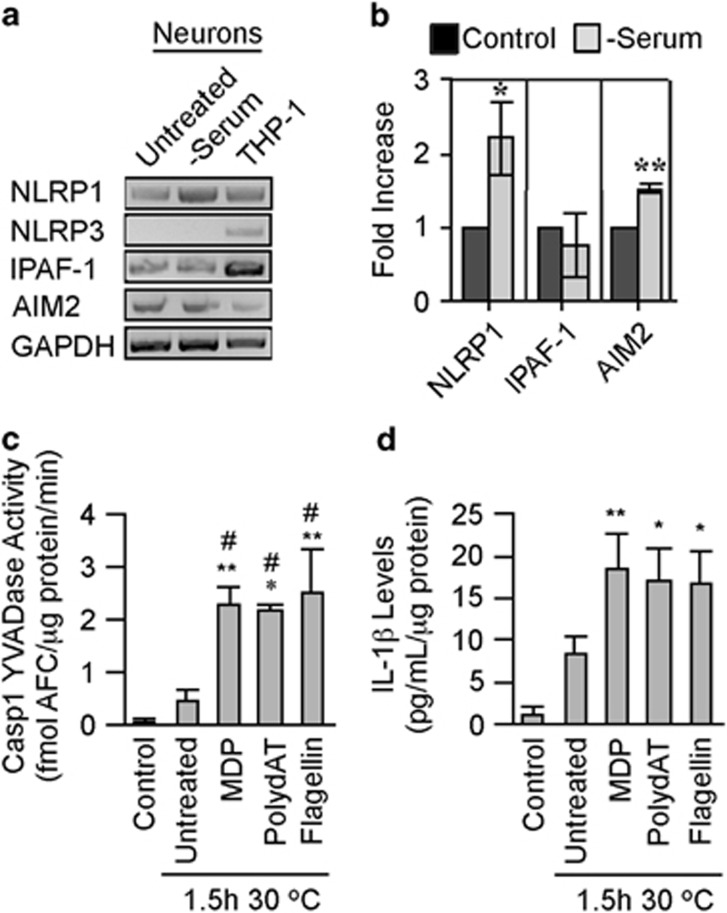
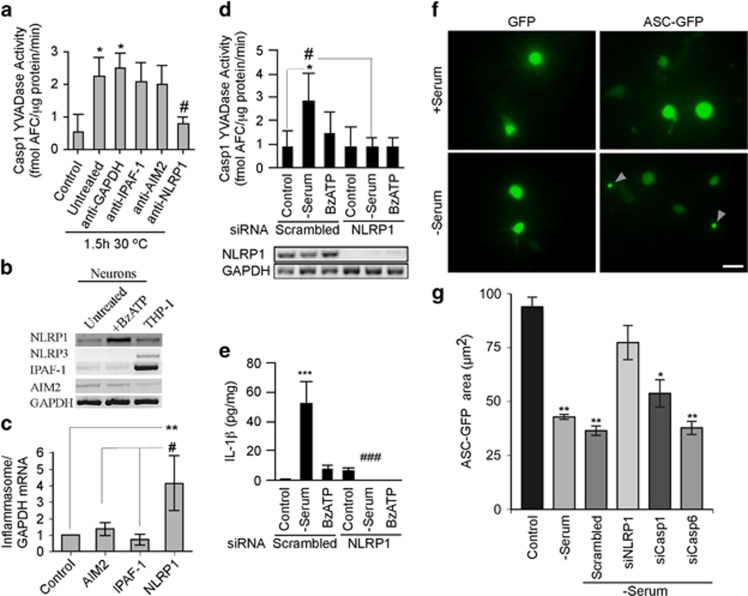
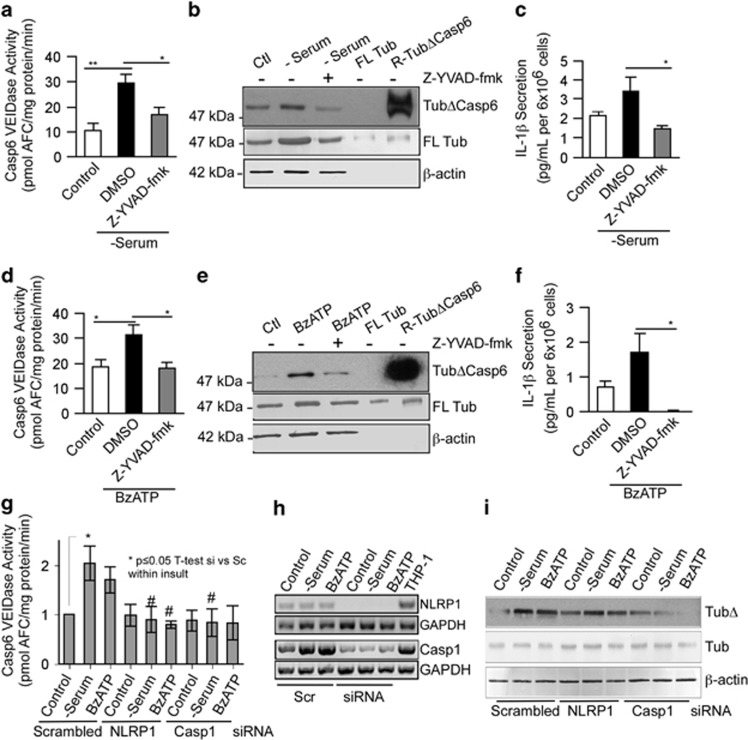
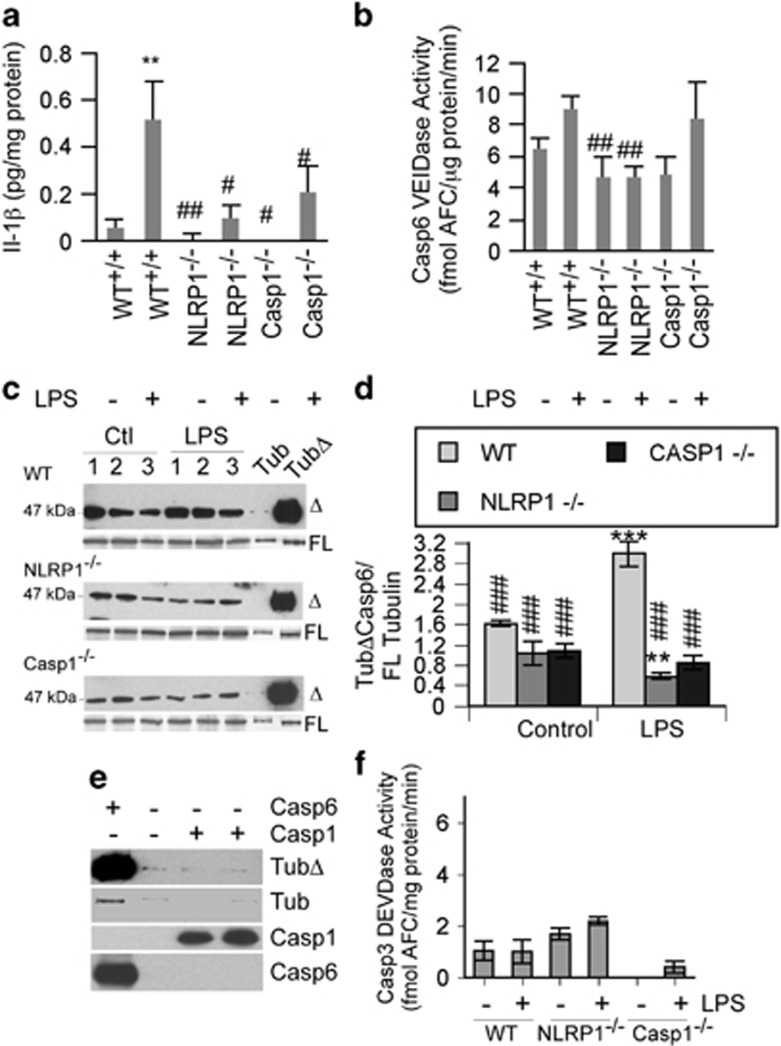
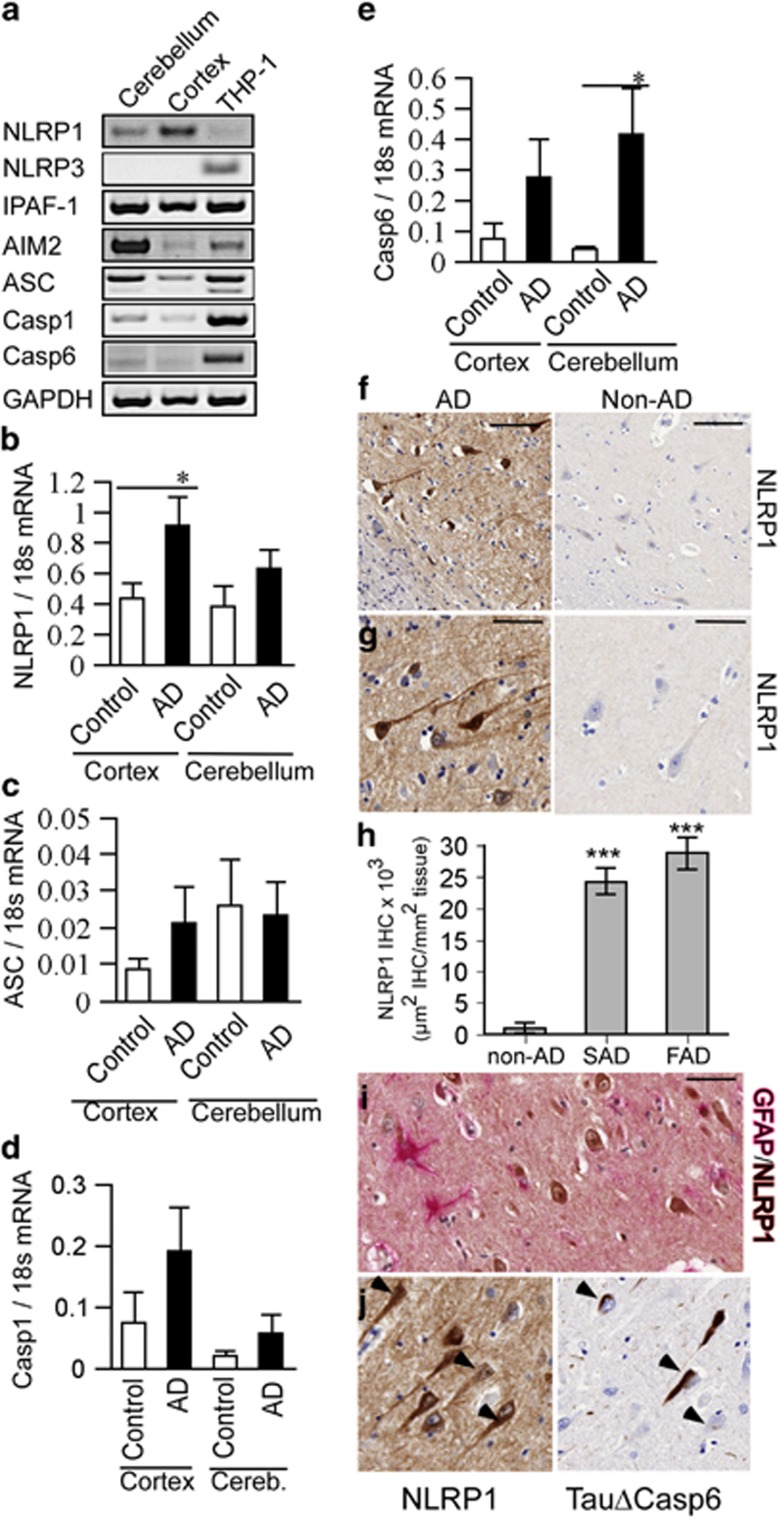
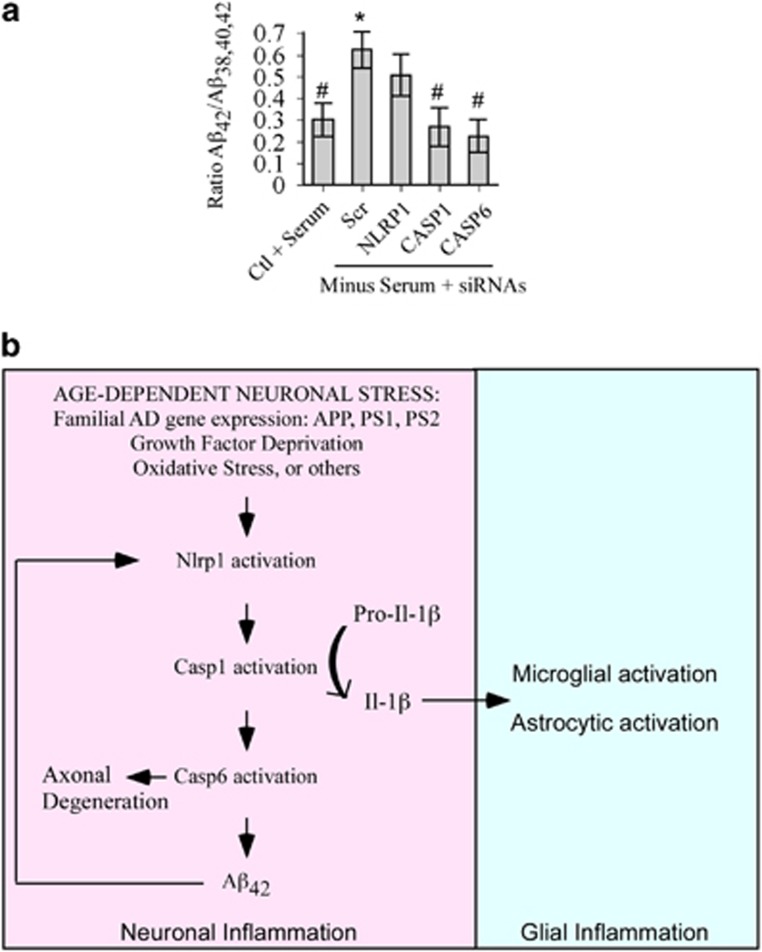
Neuronal active Caspase-6 (Casp6) is associated with Alzheimer disease (AD), cognitive impairment, and axonal degeneration. Caspase-1 (Casp1) can activate Casp6 but the expression and functionality of Casp1-activating inflammasomes has not been well-defined in human neurons. Here, we show that primary cultures of human CNS neurons expressed functional Nod-like receptor protein 1 (NLRP1), absent in melanoma 2, and ICE protease activating factor, but not the NLRP3, inflammasome receptor components. NLRP1 neutralizing antibodies in a cell-free system, and NLRP1 siRNAs in neurons hampered stress-induced Casp1 activation. NLRP1 and Casp1 siRNAs also abolished stress-induced Casp6 activation in neurons. The functionality of the NLRP1 inflammasome in serum-deprived neurons was also demonstrated by NLRP1 siRNA-mediated inhibition of speck formation of the apoptosis-associated speck-like protein containing a caspase recruitment domain conjugated to green fluorescent protein. These results indicated a novel stress-induced intraneuronal NLRP1/Casp1/Casp6 pathway. Lipopolysaccharide induced Casp1 and Casp6 activation in wild-type mice brain cortex, but not in that of Nlrp1(-/-) and Casp1(-/-) mice. NLRP1 immunopositive neurons were increased 25- to 30-fold in AD brains compared with non-AD brains. NLRP1 immunoreactivity in these neurons co-localized with Casp6 activity. Furthermore, the NLRP1/Casp1/Casp6 pathway increased amyloid beta peptide 42 ratio in serum-deprived neurons. Therefore, CNS human neurons express functional NLRP1 inflammasomes, which activate Casp1 and subsequently Casp6, thus revealing a fundamental mechanism linking intraneuronal inflammasome activation to Casp1-generated interleukin-1-β-mediated neuroinflammation and Casp6-mediated axonal degeneration.


Figures

Figure 1
Figure 1
Expression of inflammasomes in human primary neurons. (a) Ethidium bromide agarose-stained gel of NLRP1, NLRP3, IPAF-1 and AIM2 inflammasome receptors, ASC, Casp1, Casp6, MAP2, GFAP, CD68, and GAPDH RT-PCR amplicons from human primary neurons, astrocytes, and microglia and the monocyte cell line, THP-1 as a positive control for all inflammasomes. (b) qRT-PCR of inflammasome amplicon levels corrected for GAPDH levels and expressed relative to THP-1 levels. Data represent the mean and S.E.M. of a minimum of three independent experiments. One-way ANOVA (P=0.0006 for NLRP1 and P=0.0271 for AIM2) followed by Tukey–Kramer post hoc analysis, *P<0.05, **P<0.01, ***P<0.001. (c) Western blot of inflammasome receptors in neurons, astrocytes, and THP-1 cellular protein extracts. (d) Densitometric analysis of the western blot results of c. Data represents the mean and S.E.M. of three independent experiments. (e) Ethidium bromide agarose gel of NLRP3 RT-PCR amplicon from untreated (control) or LPS-treated microglia
Figure 2
Figure 2
Functional inflammasomes in serum-deprived human neurons. (a) Ethidium bromide agarose gels of the NLRP1, NLRP3, IPAF-1, AIM2, and GAPDH RT-PCR amplicons from untreated and serum-deprived neurons compared with THP-1 cells. (b) NLRP1, IPAF-1, and AIM2 mRNA levels quantified relative to GAPDH mRNA levels by qRT-PCR in untreated and serum-deprived neurons. Statistical significance was assessed with a paired t-test. *P<0.05, **P<0.01. (c and d) Casp1 YVADase activity (c) and IL-1β (d) in S-100 cytosolic fractions isolated from serum-deprived primary human neurons (control) incubated without (untreated at 1.5 h 30 ºC) or with MDP, polydAT, and flagellin for 1.5 h at 30 ºC. (c and d) One-way ANOVA followed by Tukey–Kramer post hoc analysis (*P<0.05, **P<0.01) compares control with incubated samples, #P<0.05 and ##P<0.01 compares untreated with treated samples. Data represent mean and S.E.M. from three to six independent experiments (bd)
Figure 3
Figure 3
The NLRP1 inflammasome activates Casp1 in serum-deprived and BzATP-treated human neurons. (a) Casp1 YVADase activity in S-100 extracts from neurons exposed to serum deprivation and treated with 1 μg/ml antibodies against IPAF-1, AIM2, NLRP1, or GAPDH. (b and c) Ethidium bromide agarose gel of RT-PCR amplicons (b) and qRT-PCR measurements (c) of NLRP1, NLRP3, IPAF-1, and AIM2 from untreated and 500 μM BzATP-treated neurons. Data represent the mean and S.E.M. of four independent neuron cell cultures. One-way ANOVA (P=0.0052) and Tukey–Kramer post hoc analysis (**P<0.01) compared with control, and #P<0.05 comparing NLRP1 with AIM2 and IPAF-1. (d) Casp1 YVADase activity in neurons treated with 1 μM scrambled or NLRP1 siRNA for 72 h followed by 30 min serum deprivation or 500 μM BzATP. Lower panel shows the effectiveness of the NLRP1 siRNAs knock down. Data represent mean and S.E.M. from four independent experiments. Repeated measures of ANOVA with a Tukey–Kramer post hoc analysis *P<0.05 comparing with control and #P<0.05 comparing pairs of scrambled versus NLRP1 siRNAs. (e) IL-1β levels from samples in d. ***P<0.001 compared with control and ###P<0.001 comparing siNLRP1 with scrambled siRNA. (f) ASC-GFP showing specks in serum-deprived primary human neurons. Bar represents 20 μm. (g) Quantitation of two individual preparations of human neurons. Statistics represent a multiple t-test compared with control. *P<0.05, **P<0.01
Figure 4
Figure 4
NLRP1 and Casp1 activate Casp6 in serum-deprived and BzATP-treated neurons. Casp6 VEIDase activity (a and d), TubΔCasp6, full-length tubulin (FL Tub), β-actin western blots (b and e) and IL-1β production (c and f) in serum-deprived (a,b, and c) or BzATP-treated (d,e, and f) neurons in the absence (DMSO control) or presence of 5 μM Casp1 Z-YVAD-fmk. Data represent the mean and S.E.M. of three (a and c) and four (d and f) independent neuron cultures. One-way ANOVA (P=0.002 in a, P=0.004 in c, and P=0.02 in d and f) followed by a Tukey–Kramer post hoc analysis (*P<0.05 and **P<0.01) relative to untreated DMSO control. (g) Casp6 VEIDase activity in neurons treated with 1 μM scrambled siRNA or siRNAs against Casp1 or NLRP1 followed by normal culture conditions (control), serum deprivation or 500 μM BzATP for 1 h. Data represent the mean and S.E.M. of four independent experiments. Scrambled siRNA-treated control was arbitrarily placed at one and other values within each experiment expressed relative to the scrambled siRNA control levels. One-way ANOVA (P=0.0106) followed by a post hoc Tukey–Kramer confirms increased Casp6 activity in serum-deprived neurons (*P≤0.05) and return to normal in siNLRP1 and siCasp1 serum-deprived neurons. Independent unpaired t-test shows #P<0.05 between scrambled siRNA and siNLRP1 or siCasp1 in serum-deprived conditions, and between scrambled siRNA and siNLRP1 in BzATP-treated neurons. (h) RT-PCR of NLRP1 and CASP1 mRNA in siNLRP1 and siCASP1-treated neurons, respectively. (i) Western blot of samples in g with TubΔCasp6 and full-length tubulin antibodies
Figure 5
Figure 5
LPS-treated NLRP1−/− and Casp1−/− mice have reduced Casp1 and Casp6 activities. (a) Casp1-mediated IL-1β production, (b), Casp6 VEIDase activity (c), TubΔCasp6 western blots, (d) TubΔCasp6 relative to FL tubulin densitometry, and (f) Casp3 DEVDase activity in proteins extracted from the cortex of LPS-injected wild-type, NLRP1 null, and Casp1 null mice. Data represent the mean and S.E.M. from eight wild-type, six NLRP1 null, and three Casp1 null mice for (a,b and f), and three different mice for (c and d). Statistics were performed using one-way ANOVA (P=0.0014 for a, P=0.002 for b, and P=0.0001 for d) followed by a Tukey–Kramer post hoc test: **P<0.01, ***P<0.001 compares with WT control, ###P<0.001 compares with WT LPS (a,b and d). (e) Western blots of full-length α-tubulin cleaved by Casp6 and Casp1
Figure 6
Figure 6
NLRP1 expression is increased in AD. (a) Ethidium bromide-stained agarose gel of NLRP1, NLRP3, IPAF-1, and AIM2 inflammasome receptors, ASC, CASP1, CASP6, and GAPDH RT-PCR amplicons from human adult cortex and cerebellum tissues, THP-1 cells, or water control. (bd) qRT-PCR quantitation of cortex or cerebellar NLRP1 (b), ASC (c), CASP1 (d), and CASP6 (e) mRNAs from AD and healthy control individuals. Data represent mean and S.E.M. from 12 AD and 4 control cases. Statistical difference was assessed by an unpaired t-test with Welch correction (*P<0.05, ***P<0.001). (f and g) Low (f) and high (g) magnification micrographs of NLRP1 immunohistochemical staining in AD and non-AD subiculum. Scale bar is 100 μm in f and 50 μm in g and h. Density of NLRP1 immunopositive staining represented as μm2 positive staining per mm2 of tissue in non-AD, sporadic AD (SAD), and familial AD (FAD) subiculum. (i) Co-immunostaining of astrocytes with GFAP (pink) and NLRP1 (brown) in an AD brain. (j) Immunostaining of NLRP1 and TauΔCasp6 in 4 μm consecutive sections of an AD brain. Scale is 50 μm for i and j
Figure 7
Figure 7
Nlrp1-mediated increased Aβ42 ratios in serum-deprived neurons. (a) Levels of Aβ42 relative to total Aβ peptides (38, 40, and 42) secreted from serum-deprived primary human neurons pre-treated with scrambled (Scr), NLRP1, CASP1, or CASP6 siRNAs. Data represents the mean and S.E.M. of four independent experiments. ANOVA (P<0.02) and post hoc Dunnett analysis comparing each condition with serum-treated normal neurons (*P≤0.05) or with serum-deprived scrambled siRNA-treated neurons (#P≤0.05). (b) Schematic diagram of a model linking intraneuronal Nlrp1 inflammasome activation to Caspase-1-generated IL-1β-mediated neuroinflammation and Caspase-6-mediated axonal degeneration and Aβ42 over-production

References

    1. Reitz C, Brayne C, Mayeux R. Epidemiology of Alzheimer disease. Nat Rev Neurol. 2011;7:137–152. - PMC - PubMed
    1. Kamboh MI, Demirci FY, Wang X, Minster RL, Carrasquillo MM, Pankratz VS, et al. Genome-wide association study of Alzheimer's disease. Transl Psychiatry. 2012;2:e117. - PMC - PubMed
    1. Hollingworth P, Harold D, Sims R, Gerrish A, Lambert JC, Carrasquillo MM, et al. Common variants at ABCA7, MS4A6A/MS4A4E, EPHA1, CD33 and CD2AP are associated with Alzheimer's disease. Nat Genet. 2011;43:429–435. - PMC - PubMed
    1. Zhang B, Gaiteri C, Bodea LG, Wang Z, McElwee J, Podtelezhnikov AA, et al. Integrated systems approach identifies genetic nodes and networks in late-onset Alzheimer's disease. Cell. 2013;153:707–720. - PMC - PubMed
    1. Griffin WS, Stanley LC, Ling C, White L, MacLeod V, Perrot LJ, et al. Brain interleukin 1 and S-100 immunoreactivity are elevated in Down syndrome and Alzheimer disease. Proc Natl Acad Sci USA. 1989;86:7611–7615. - PMC - PubMed

Publication types

MeSH terms