. 2015 Mar 6:5:8882.
doi: 10.1038/srep08882.

The formation of electronically excited species in the human multiple myeloma cell suspension

Affiliations

The formation of electronically excited species in the human multiple myeloma cell suspension

Marek Rác et al. Sci Rep. .

Abstract

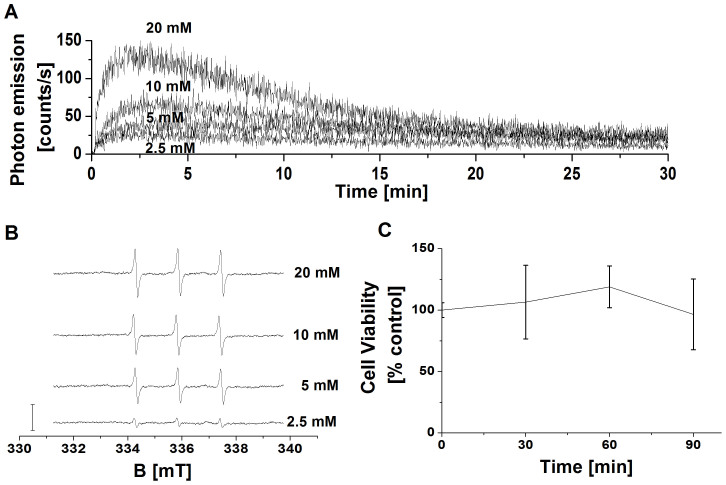
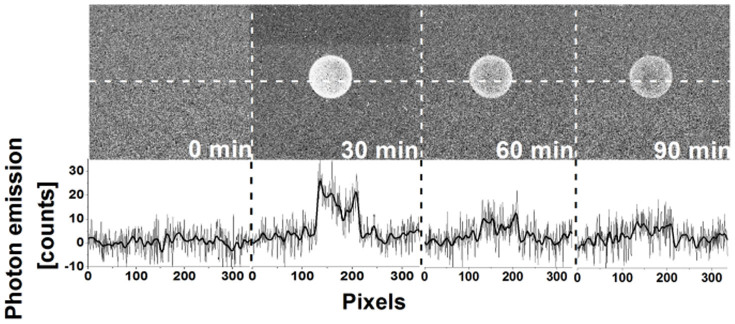
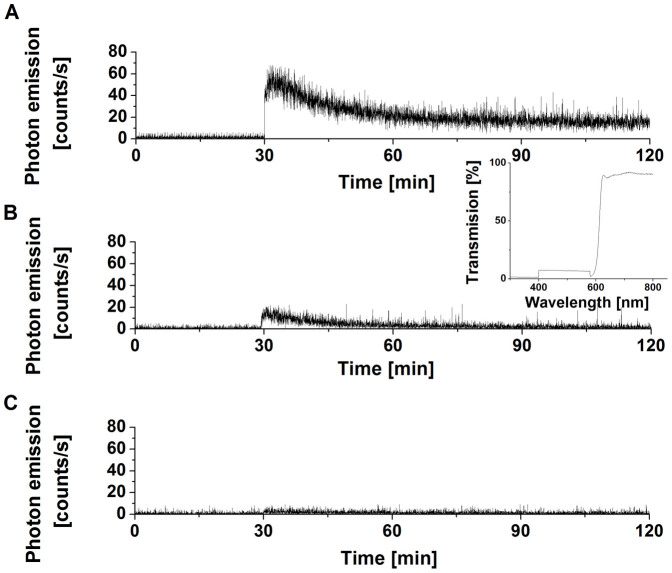
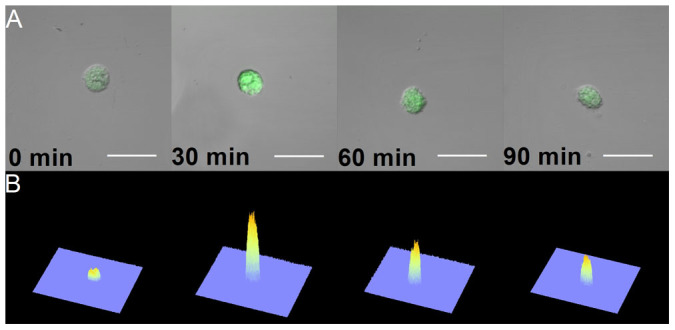
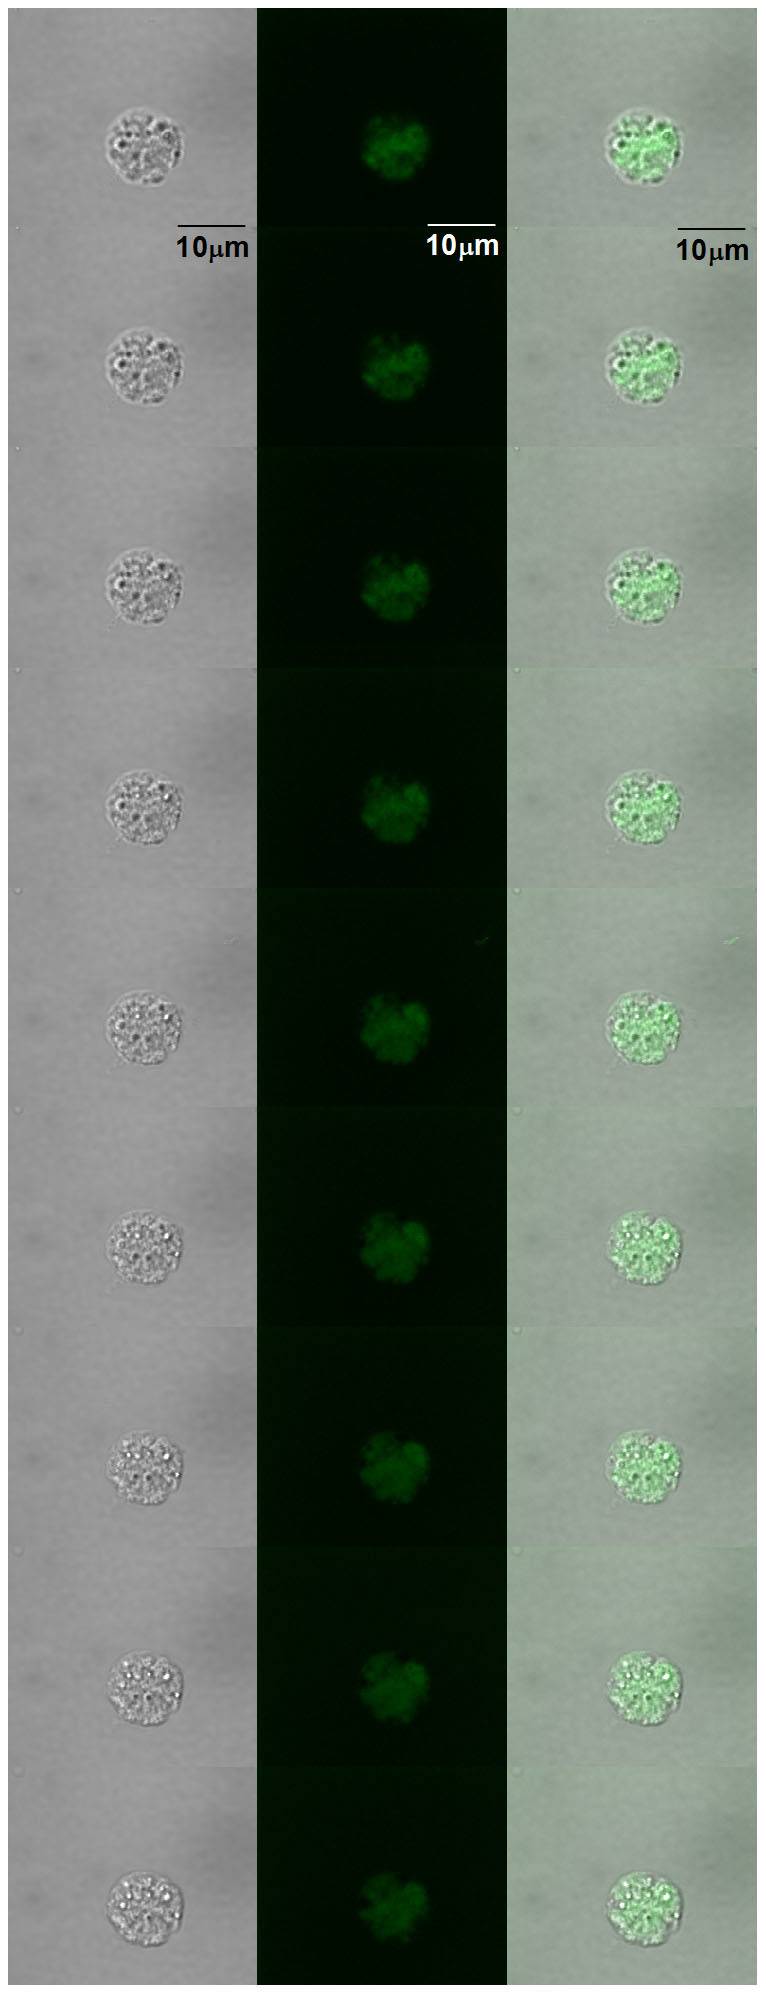
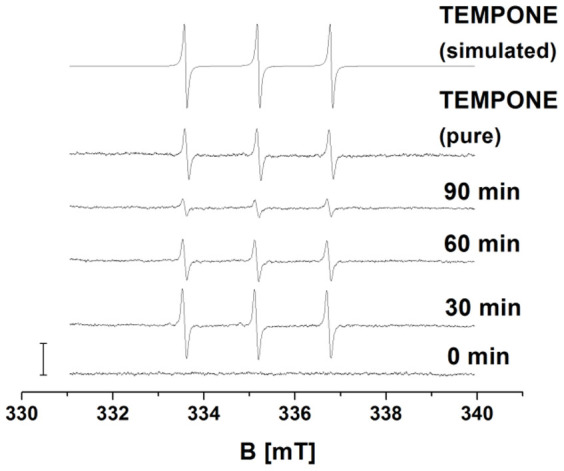
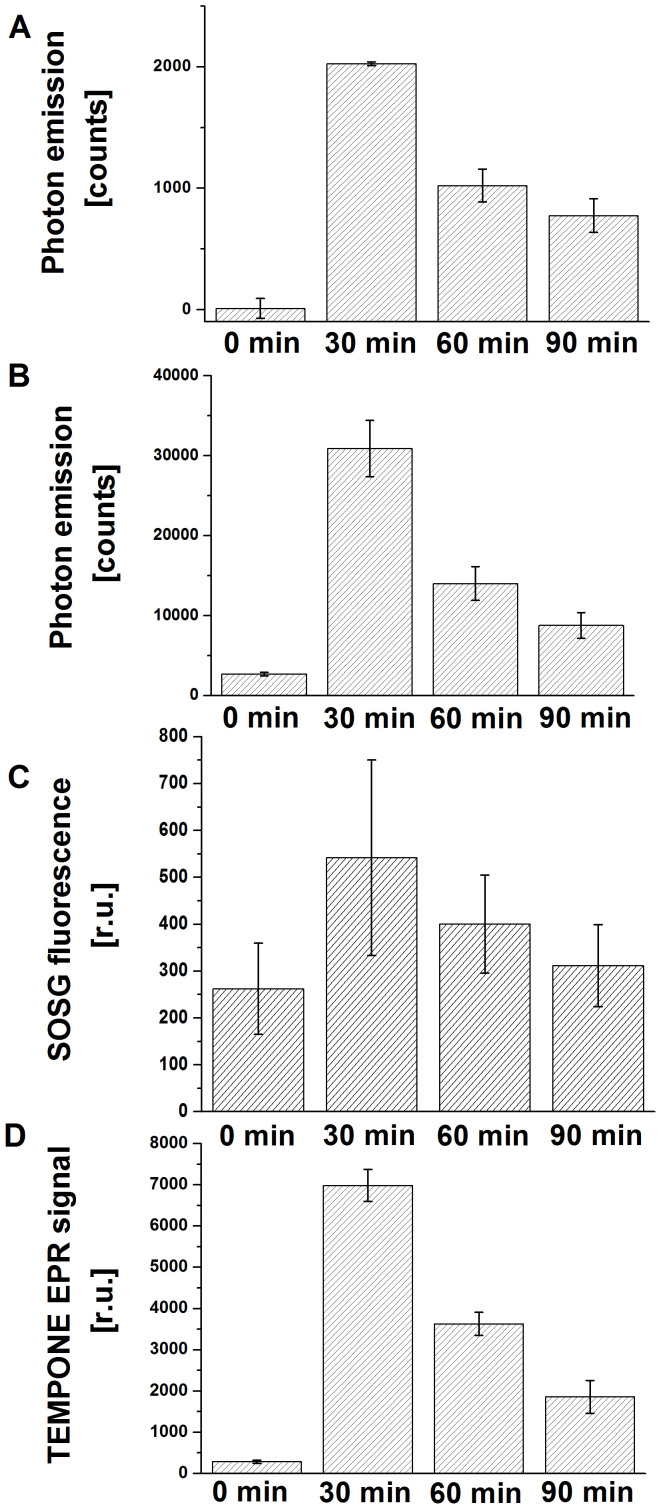
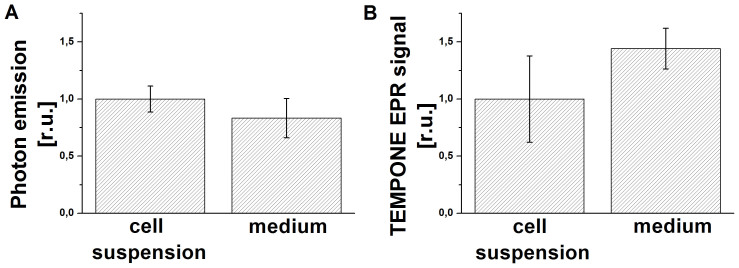
In this study, evidence is provided on the formation of electronically excited species in human multiple myeloma cells U266 in the growth medium exposed to hydrogen peroxide (H2O2). Two-dimensional imaging of ultra-weak photon emission using highly sensitive charge coupled device camera revealed that the addition of H2O2 to cell suspension caused the formation of triplet excited carbonyls (3)(R = O)*. The kinetics of (3)(R = O)* formation in the real time, as measured by one-dimensional ultra-weak photon emission using low-noise photomultiplier, showed immediate enhancement followed by a slow decay. In parallel to the formation of (3)(R = O)*, the formation of singlet oxygen ((1)O2) in U266 cells caused by the addition of H2O2 was visualized by the imaging of (1)O2 using the green fluorescence of singlet oxygen sensor green detected by confocal laser scanning microscopy. Additionally, the formation of (1)O2 after the addition of H2O2 to cell suspension was detected by electron paramagnetic resonance spin-trapping spectroscopy using 2,2,6,6-tetramethyl-4-piperidone. Presented results indicate that the addition of H2O2 to cell suspension results in the formation of (3)(R = O)* and (1)O2 in U266 cell suspension. The contribution of the cell-free medium to the formation of electronically excited species was discussed.


Figures

Figure 1
Figure 1. The effect of various concentrations of H2O2 on the formation of electronically excited species.
In (A), detection of one-dimensional ultra-weak photon emission. One-dimensional ultra-weak photon emission from cell suspension was measured by low-noise PMT after the addition of H2O2 at concentrations indicated in the figure. In (B), detection of TEMPONE EPR signal by EPR spin-trapping spectroscopy. TEMPONE EPR spectra were detected from cell suspension treated with H2O2 for 30 min at the concentrations indicated in the figure. 50 mM TEMPD was added to cell suspension prior to the measurement. The bar represents 3000 relative units. In (C), determination of cell viability by automated cell counter. The cell suspension was treated with 5 mM H2O2 for the time period indicated in the figure. The data are presented as the mean and standard deviation of 3 measurements (mean ± SD, n = 3).
Figure 2
Figure 2. Triplet excited carbonyl detection by two-dimensional imaging of ultra-weak photon emission.
Two-dimensional ultra-weak photon emission was measured from the cell suspension by a highly sensitive CCD camera. Prior to the measurements, the cell suspension was kept in the dark for 10 min. After dark period, two-dimensional ultra-weak photon emission was measured from untreated cell suspension. Consequently, a set of three images of two-dimensional ultra-weak photon emission was measured after the addition of H2O2 to cell suspension for time period indicated in the figure. The two-dimensional ultra-weak photon emission was measured with the integration time of 30 min. The bottom panel shows the spatial profile of photon emission in the middle strip of the image. Y axis denotes the number of counts accumulated after 30 min, whereas X axis denotes the pixel of the image.
Figure 3
Figure 3. Triplet excited carbonyl detection by one-dimensional ultra-weak photon emission.
One-dimensional ultra-weak photon emission from cell suspension was measured by low-noise PMT. In (A), spontaneous one-dimensional ultra-weak photon emission was measured for 30 min. Consequently, 5 mM H2O2 was added to the cell suspension. In (B), the one-dimensional ultra-weak photon emission from cell suspension treated with 5 mM H2O2 was measured in the presence of the long-pass edge filter (600 nm). Insert shows transmission spectrum of long-pass edge filter. In (C), the effect of 10 mM histidine on one-dimensional ultra-weak photon emission from cell suspension is shown. Other experimental conditions were as in Fig. 2B.
Figure 4
Figure 4. Singlet oxygen imaging by confocal laser scanning microscopy.
The SOSG fluorescence within U266 cells treated with 5 mM H2O2 for the time period indicated in the figure was examined by a confocal laser scanning microscope. 50 μM SOSG was added to U266 cells 30 min prior to the data collection. In (A), individual representative cells of each time variant are shown in the images combining Nomarski DIC and SOSG fluorescence (λem = 505–525 nm) channels. In (B), the integral distribution of the SOSG fluorescence intensity is shown within the corresponding upper images. The bar represents 30 μm.
Figure 5
Figure 5. Singlet oxygen imaging in the multiple layers of the sample.
U266 cells were treated with 5 mM H2O2 for 30 min. Three channels are presented: Nomarski DIC (left column), SOSG fluorescence (λem = 505–525 nm) (middle column) and the combination of Nomarski DIC and SOSG fluorescence (right column). The step in between different pictures is 0.5 μm. Other parameters are same as in Fig. 4.
Figure 6
Figure 6. Detection of singlet oxygen by EPR spin-trapping spectroscopy.
TEMPONE EPR spectra were detected from cell suspension treated with 5 mM H2O2 for the period indicated in the figure. 50 mM TEMPD was added to cell suspension 30 min prior to the measurement. Pure TEMPONE EPR signal was detected using 20 nM TEMPONE. The simulation of TEMPONE EPR spectra was done using hyperfine splitting constant aN = 16 G. The bar represents 3000 relative units.
Figure 7
Figure 7. Quantitative analysis.
Quantitative analysis of two-dimensional and one-dimensional ultra-weak photon emission, SOSG fluorescence intensity, and TEMPONE EPR signal. The spatial profile of ultra-weak photon emission in the middle trip of the image (A), the area below curve (B), the intensity of SOSG fluorescence (C) and the height of the middle peak of TEPONE EPR signal (D) measured from U266 cells was plotted as a function of the H2O2 treatment period indicated in the figure. The data are presented as the mean and standard deviation of at least 3 measurements (mean ± SD, n ≥ 3). The other experimental conditions were as in Figs. 1–4.
Figure 8
Figure 8. Formation of electronically excited species in the cell-free medium.
The one-dimensional ultra-weak photon emission (A) and TEMPONE EPR signal (B) detected in the cell suspension and in the cell-free medium 30 min after the addition of 5 mM H2O2 is shown. In order to better compare the results, the sum of one-dimensional ultra-weak photon emission counts and the height of the middle peak of TEPONE EPR signal were normalized to the data from cell suspension.
Figure 9
Figure 9. Picture of U266 cells in Nomarski DIC channel.

References

    1. Pospíšil P. Molecular mechanisms of production and scavenging of reactive oxygen species by photosystem II. Biochim. Biophys. Acta 1817, 218–231, 10.1016/j.bbabio.2011.05.017 (2012). - DOI - PubMed
    1. Han D., Williams E. & Cadenas E. Mitochondrial respiratory chain-dependent generation of superoxide anion and its release into the intermembrane space. Biochem. J. 353, 411–416, 10.1042/0264-6021:3530411 (2001). - DOI - PMC - PubMed
    1. Cocheme H. M. & Murphy M. P. Complex I is the major site of mitochondrial superoxide production by paraquat. J. Biol. Chem. 283, 1786–1798, 10.1074/jbc.M708597200 (2008). - DOI - PubMed
    1. Dahlgren C., Karlsson A. & Bylund J. Measurement of respiratory burst products generated by professional phagocytes. Methods Mol. Biol. 412, 349–363, 10.1007/978-1-59745-467-4_23 (2007). - DOI - PubMed
    1. Gutteridge J. M. C. Lipid-Peroxidation and Antioxidants as Biomarkers of Tissue-Damage. Clin. Chem. 41, 1819–1828 (1995). - PubMed

Publication types

MeSH terms